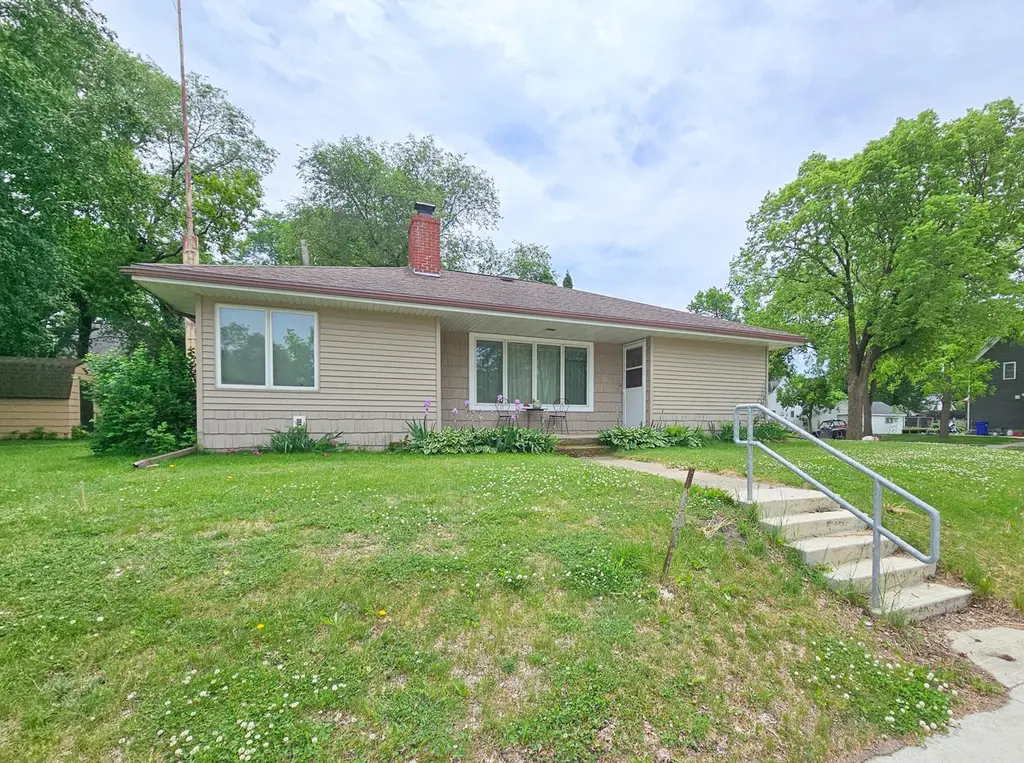
621 10th Ave · Clarkfield, MN
Flood risk 1/10 · Minimal
- FEMA flood zone
- X (unshaded)
- Chance of flooding over 30 yrs
- 0.0%
- Est. flood insurance / yr
- $473 – $860
Fire risk 1/10 · Minimal
- Est. fire insurance / yr
- $888 – $1,650
Heat risk 2/10 · Minimal
- Hot days now (above 99°F)
- 7 days/yr
- Hot days in 30 yrs
- 14 days/yr
Wind risk 2/10 · Minimal
- Chance of severe wind over 30 yrs
- —
Air-quality risk 2/10 · Minimal
- Unhealthy air days now
- 1 days/yr
- Unhealthy air days in 30 yrs
- 1 days/yr
Risk factors via First Street. Map © Google.
Why this score? — see what drove the B- grade
The composite is a weighted blend of 9 inputs, each scored 0–100. Each bar is that input's sub-score; the figure is the points it added to the 100-point composite (weight × sub-score).
- Cash flow +23.1/30.0
- Appreciation +10.0/10.0
- ARV discount +7.5/15.0
- DSCR +7.4/10.0
- 1% rule +6.7/10.0
- Schools +3.4/10.0
- Livability +3.3/5.0
- Rent growth +2.5/5.0
- Condition / age +2.5/5.0
$90,000
🖨 Deal sheet 📄 Offer letter ✓ Due diligence
Listing remarks MLS
Move right in this one story remodeled home with many improvements including Roof, Siding, Insulation, Windows, Part Ele., 200 AMP service, Plus More. Large kitchen/dining room
Key facts
- Anderson windows
- Unfinished basement
- Backyard shed
Tags
Property features AI
Exterior
- Parking: Tuck-under garage (1 stall, approximately 12x20)
- Utilities: City water connected; City sewer connected; Natural gas; 200+ amp electric service
- Home design: Residential property; One story
- Construction: Asphalt roof; Block foundation
- Exterior features: Covered patio/porch; Vinyl siding; Storage shed; Corner lot with medium tree coverage; Road frontage on a state road (publicly maintained)
Interior
- Kitchen: Range
- Bedrooms: Three bedrooms (all on the main level)
- Bathrooms: One full bathroom on the main floor; One three-quarter bathroom in the basement
- Heating & cooling: Hot water heating; Central air conditioning
- Interior features: Living room fireplace; Kitchen and dining combined (kitchen/dining room); Main floor primary bedroom; Full basement
- Laundry & utility: Washer/dryer hookup; Laundry located in the basement
Neighborhood map
What this means for you Summary
Snapshot
- This is a 3-bed/1.0-bath single-family listed at $90k.
Deal economics
- At list price, monthly cash flow is $161 ($2k/yr) — positive.
- The deal already cash-flows at list — no discount required.
- Meets the 1% rule at list price ($1k rent vs $90k).
Location & tenants
- Location reads 66/100 on livability (#497 in MN) — a middle-class / working-renter tenant base. Strengths: cost of living A+, housing A+, schools A-; Watch: employment C-, crime D+, health & safety D+.
- Yellow Medicine East (town): math 31% / reading 47% proficiency, ranked #227 of 301 in MN (top 75%) — families likely to look elsewhere, expect single-tenant / working-renter base with shorter leases.
- Market conditions: 6 active listings in the ZIP; 7 units permitted in Yellow Medicine County in 2024 (0 in 5+ unit buildings).
Forward outlook
- In year one you build about $10k of equity ($622 loan paydown + $9k appreciation (10.0% local appreciation)).
- Yellow Medicine County population projected at -26% by 2050 — secular population decline; favor cash flow + early exit over multi-decade hold.
- At projected returns (10.0% appreciation + 3.0% rent growth), your $25k cash investment doubles in ~3 years — after that, you're playing with house money.
- By year 4, paydown + projected appreciation supports a ~$34k cash-out refi (75% LTV) — recoverable capital for the next deal without selling this one.
Negotiation context
- Only 2 days on market — expect competitive offers; lowballing is unlikely to land.
- 3 sale attempts since 7y ago with the ask held roughly flat each time — persistent listings suggest the price (not the market) is what's stuck; bring a comps-based counter.
Risks & watch-outs
- Watch-outs: built in 1948 — expect roof / HVAC / electrical / plumbing capex.
Questions for the listing agent
- Built in 1948 — when were the roof, HVAC, electrical panel, plumbing, and water heater last replaced?
- Is there a deadline driving the sale (1031 exchange, divorce, estate, relocation)? That informs how much negotiation room exists.
- Schools are A-rated — typically a magnet for longer-tenancy family renters. What's the average tenant stay here, and is there a school-zone premium baked into asking?
- Crime grade is D in this area — have there been break-ins, vandalism, or insurance claims at this property in the last 3 years? What carrier currently insures it and at what premium?
- What's the average days-on-market for RENTAL listings here right now (not sales)? A rising rental-DOM trend means longer vacancies and softer asking-rent achievability than the comps imply.
- What's the recent tenant-quality profile in this submarket — average credit score on applications, eviction rate, late-payment / NSF rate, and stable-employment percentage? A property-management company in the area should have these aggregated.
- How much new for-sale + rental construction is in the pipeline within 1–3 miles? Heavy new supply typically softens prices + rents 12–24 months out; constrained supply supports both.
Investment metrics
- 1% rule
- 1.17% ✓
- Cap rate
- 8.44%
- Cash-on-cash
- 7.68%
- DSCR
- 1.34
- GRM
- 7.1
CMA / ARV
No comps found within radius.
Projected returns pro-forma
10.0% appreciation · 3.0% rent growth · sell at horizon
- IRR
- 29.9%
- Equity multiple
- 3.35×
- Total profit
- $59,330
- Equity at exit
- $81,079
- IRR
- 25.9%
- Equity multiple
- 7.62×
- Total profit
- $166,730
- Equity at exit
- $174,850
Cash invested: $25,200 (down + closing). Projections, not guarantees.
Landlord ↔ Tenant lean methodology
- Overall (STATE)
- 46 Balanced
- State Minnesota
- 46 Balanced · D+2
- County
- — inherits STATE
- City
- — inherits STATE
ZIP-level market 56223
- Active inventory
- 6
- Price-to-rent
- 7.1×
Monthly cashflow live
- Estimated rent
- $1,051 medium interval (Pro) →
- Mortgage (P&I)
- −$472
- Tax from tax record
- −$159 /mo · $1,912/yr
- Insurance
- −$38
- HOA
- −$0
- Vacancy / Maint / Mgmt
- −$221
- Net cashflow
- $161
Break-even live
UW: 25.0% down · 7.5% · 30yr · 1.5% tax · 5.0% vac · 8.0% maint · 8.0% mgmt
Financing live
Cash to close
- Down payment
- $22,500
- Closing costs
- $2,700
- Reserves months
- —
- Total cash needed
- —
Loan-product check · same deal, 3 products live
Conventional
25% down · 7.5% · 30yr
- Down + closing
- —
- Monthly P&I
- —
- Monthly cashflow
- —
- DSCR
- —
- Eligible?
- —
Personal DTI + credit; lowest rate.
DSCR
20% down · 8.5% · 30yr
- Down + closing
- —
- Monthly P&I
- —
- Monthly cashflow
- —
- DSCR
- —
- Eligible?
- —
No personal income docs; deal must DSCR.
Hard money
10% down · 12.0% · 12mo
- Down + closing
- —
- Monthly P&I
- —
- Monthly cashflow
- —
- DSCR
- —
- Eligible?
- —
Short-term bridge; refi at stabilization.
Listing history 3 events
-
2026-06-18days on market $90,000 Active 2 DOM
-
2026-06-17remarks 470-char remark
-
2026-06-17$90,000 Active 1 DOM
ⓘ Source: listings_history table (triggers on properties + properties_extension) + one-shot
backfill from property_details.listing_events for pre-trigger history.
Tax reassessment forecast MN · Partial reset (capped growth)
- Current annual tax
- $1,912 · $159/mo
- Projected year-2 tax
- $1,912 · $159/mo
- Expected delta
- $0/yr ($0/mo · 0.0%)
ⓘ Screening estimate from a state-policy table — verify with the county assessor before closing.
Climate risk First Street
- Flood 1/10 Low FEMA zone X (unshaded) · 0% chance over 30 yrs
- Wildfire 1/10 Low
- Heat 2/10 Low 7 d/yr ≥99°F today · 14 d/yr by 30 yrs out
- Wind 2/10 Low
- Air quality 2/10 Low 1 unhealthy d/yr today · 1 by 30 yrs out
Nearby sold comps map
Loading sold comps map…
Walkable amenities ~0.75 mi
Loading nearby amenities…
Taxation est. · year 1
- Rental income
- $12,608
- − Mortgage interest
- −$5,041
- − Property taxes
- −$1,912
- − Insurance
- −$450
- − Repairs & maintenance
- −$1,009
- − Management
- −$1,009
- − Depreciation
- −$2,618
- Taxable income
- $569
- Est. tax owed @ 24.0%
- −$137
- After-tax cash flow
- $1,798/yr
For passive investors: Depreciation is non-cash, so a rental often shows a tax loss while cash-flowing — sheltering income. Rental losses are passive: they offset passive income freely, and up to $25,000/yr can offset ordinary (W-2) income if you actively participate and your MAGI is under $100k (phasing out to $0 by $150k); unused losses carry forward. On sale, claimed depreciation is recaptured at up to 25%, and gains may owe capital-gains tax (a 1031 exchange can defer both). Figures are a year-1 estimate at your 24.0% rate — not tax advice; consult a CPA.
Schools (NCES district)
- District
- Yellow Medicine East
- NCES district ID
- 2700099
- Math proficiency
- 31% ▼ -7.00%
- Reading proficiency
- 47% ▼ -7.00%
- Median HH income
- $51,457
- Composite
- 33.74/100
- National rank
- #5369
- State rank
- #227 of 301 in MN
Livability — Clarkfield
- Score
- 66/100
- State rank
- #497
- US rank
- #11957
Category grades
Schools grade is shown separately in the Schools card above.
Census & demographics
- Census place
- Clarkfield, MN
- Population (ZIP)
- 1,403
Population outlook (Yellow Medicine County) Hauer SSP2
- Today (2025)
- 8,959 people
- By 2030
- 8,451 · -5.7%
- By 2040
- 7,514 · -16.1%
- By 2050
- 6,650 · -25.8%
- By 2075
- 5,306 · -40.8%
- By 2100
- 4,453 · -50.3%
Race, ethnicity, and origin ACS 2023
- Neighborhood character
- Predominantly White (88%)
- Race & ethnicity
- White 88% Hispanic / Latino 7% Two or more races 5% Native American 2%
- Hispanic origin (detail)
- Mexican 5%
- Common ancestry
- Portuguese 33% Lithuanian 4% Scottish 2%
- Foreign-born
- 4% · Canada
- Languages at home
- 93% English-only · Spanish 6%
Political lean MEDSL · Yellow Medicine
- 2024 margin
- Solid R (+40.6) · D 28.7% · R 69.3% · Other 1.9%
- 2008→2024 swing
- -44.9pp toward R · 2008: 4.3pp · 2024: -40.6pp
- All cycles
- 2024: R+40.6 2020: R+37.0 2016: R+35.4 2012: R+6.3 2008: D+4.3
Not yet ingested
- Civics
- —
Market trends
- HPI YoY
- ▲ 106.79%
- Current HPI
- 318.75
- Rent YoY
- —
- Metro
- —
- State GDP YoY
- ▲ 2.41%
- F500 in state
- 34
Industry mix (Fortune 500 HQ in MN)
| Industry | F500 HQs | Revenue |
|---|---|---|
| Healthcare | 2 | $407B |
|
||
| Retail | 2 | $150B |
|
||
| Consumer Goods | 2 | $32B |
|
||
| Industrial Machinery | 2 | $6B |
|
||
| Agriculture | 1 | $40B |
|
||
| Healthcare / Medical Devices | 1 | $32B |
|
||
Price history
+136.8% since first listed13 events — show timeline
- 2026-06-16 Listed $90,000 NORTHSTARMLS as Distributed by MLS Grid
- 2020-10-26 Sold (Public Records) $82,000 Public Records
- 2020-10-23 Sold (MLS) $82,000 NORTHSTARMLS as Distributed by MLS Grid
- 2020-09-23 Pending — NORTHSTARMLS as Distributed by MLS Grid
- 2020-09-17 Contingent — NORTHSTARMLS as Distributed by MLS Grid
- 2020-09-09 Price Changed $82,500 NORTHSTARMLS as Distributed by MLS Grid
- 2020-08-19 Price Changed $83,500 NORTHSTARMLS as Distributed by MLS Grid
- 2020-07-21 Price Changed $85,500 NORTHSTARMLS as Distributed by MLS Grid
- 2020-06-15 Listed $86,500 NORTHSTARMLS as Distributed by MLS Grid
- 2019-12-16 Listing Removed — NORTHSTARMLS as Distributed by MLS Grid
- 2019-11-05 Price Changed $82,900 NORTHSTARMLS as Distributed by MLS Grid
- 2019-10-16 Listed $85,900 NORTHSTARMLS as Distributed by MLS Grid
- 2013-08-30 Sold (Public Records) $38,000 Public Records
Property tax history
+9.5%/yrLatest (2026): $1,912 · -1.0% YoY. Source: county tax records.
Cash-flow waterfall
monthlySold comps — $/sqft
last 12 mo · ≤1 miLoading sold comps…