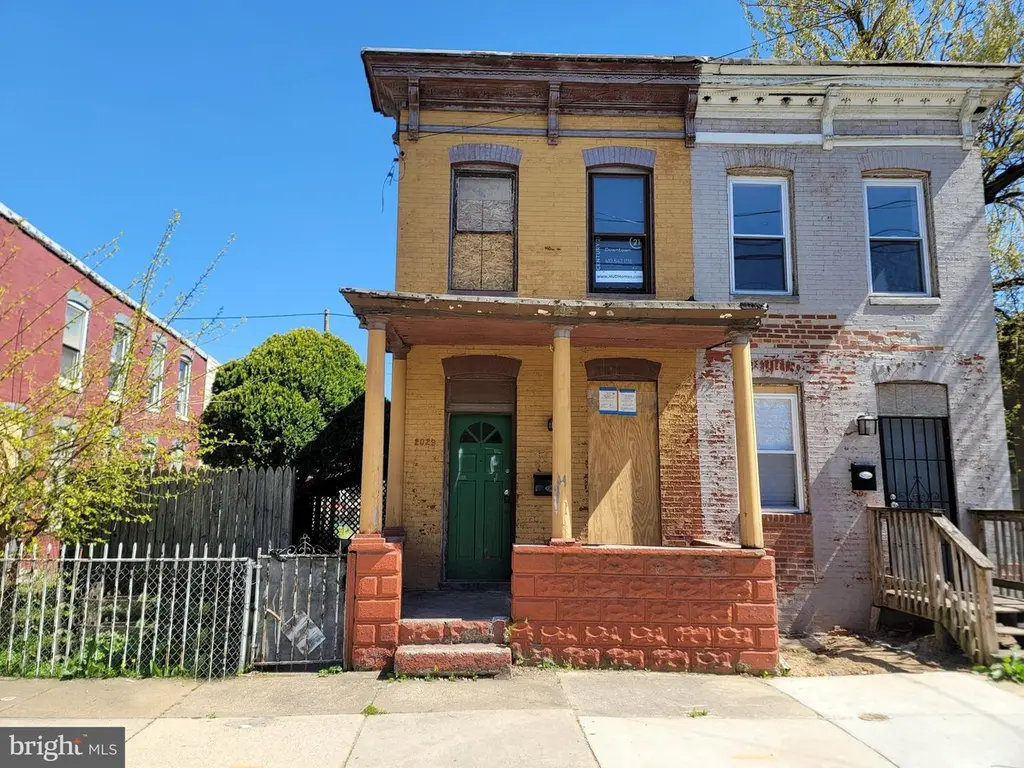
2029 Annapolis Rd · Baltimore, MD
Flood risk 3/10 · Minor
- FEMA flood zone
- X (shaded)
- Chance of flooding over 30 yrs
- 0.2%
- Est. flood insurance / yr
- $473 – $860
Fire risk 1/10 · Minimal
- Est. fire insurance / yr
- $755 – $1,403
Heat risk 8/10 · Major
- Hot days now (above 102°F)
- 7 days/yr
- Hot days in 30 yrs
- 15 days/yr
Wind risk 6/10 · Moderate
- Chance of severe wind over 30 yrs
- 27.0%
Air-quality risk 4/10 · Minor
- Unhealthy air days now
- 6 days/yr
- Unhealthy air days in 30 yrs
- 7 days/yr
Risk factors via First Street. Map © Google.
Why this score? — see what drove the D+ grade
The composite is a weighted blend of 9 inputs, each scored 0–100. Each bar is that input's sub-score; the figure is the points it added to the 100-point composite (weight × sub-score).
- Cash flow +15.0/30.0
- ARV discount +15.0/15.0
- 1% rule +5.0/10.0
- DSCR +5.0/10.0
- Livability +3.8/5.0
- Condition / age +2.5/5.0
- Rent growth +2.2/5.0
- Schools +1.0/10.0
- Appreciation +0.0/10.0
$40,000
🖨 Deal sheet 📄 Offer letter ✓ Due diligence
Listing remarks MLS
HUD Owned Home, case number 241-948224. HUD Homes are sold "as is, subject to appraisal. Discover a wonderful investment opportunity in the heart of the Westport community! This semi-detached home, built in 1920, features a brick exterior and offers 1,272 sq. ft. of living space. Venture inside to find a living room that leads to the dining area and kitchen, three bedrooms, a full bathroom and an unfinished basement that provides endless possibilities for expansion or additional storage. The exterior features include sidewalks and a front porch, ideal for enjoying warm evenings or morning coffee. With off-street and on-street parking options, accessibility is a breeze for residents. This property is close in proximity to amenities, local dining and shopping. It is also near the Patapsco River, providing water access for recreational activities such as kayaking or fishing. This desirable location not only enhances the lifestyle appeal but also positions the property for potential appreciation and strong rental returns. Don't miss your chance to invest on this unique opportunity!
Key facts
- Brick exterior
- Unfinished basement
- Front porch
Tags
Neighborhood map
What this means for you Summary
Snapshot
- This is a 3-bed/1.0-bath townhouse listed at $40k.
Deal economics
- At list price, monthly cash flow is $2k ($19k/yr) — positive.
- The deal already cash-flows at list — no discount required.
- Meets the 1% rule at list price ($2k rent vs $40k).
- Recommended offer: $39k (1.5% below list) — sets the bar for market timing.
- Cap rate 52.9% vs local median 6.0% in Baltimore — top-decile yield for the area; either an underpriced asset or a hidden risk that comps aren't pricing in. Stress-test before assuming the spread holds.
Location & tenants
- Location reads 76/100 on livability (#90 in MD, #3,396 nationally) — a middle-class / working-renter tenant base. Strengths: amenities A+, commute A+, housing A+; Watch: schools D, crime F.
- Baltimore City Public Schools (urban): math 7% / reading 16% proficiency, ranked #24 of 24 in MD (top 100%) — low school quality limits family demand, transient renter base, plan for 1-2y turnover; 79% free/reduced lunch — lower-income household profile, screen leases tightly.
- Market conditions: Rents soft (-1.0%/yr); 362 active listings in the ZIP; 40 comparable units currently listed for rent nearby; rentals at typical pace (median 24d on market — plan ~3-4 weeks tenant-placement turnaround); solid renter incomes; 1,273 units permitted in Baltimore city in 2024 (1,104 in 5+ unit buildings).
- This rent runs 31% of the median local income ($92k/yr) — at the standard rent-burdened threshold; future hikes will face affordability resistance.
Forward outlook
- Local home prices are declining (-3.0%/yr); year-one equity from $277 of loan paydown is wiped out by about $1k of value loss. Plan a longer hold.
- Baltimore County population projected to shrink 4% by 2050 — rents likely to lag national; underwrite the cash flow, not the appreciation.
- At projected returns (-3.0% appreciation + 0.0% rent growth), your $11k cash investment doubles in ~1 year — after that, you're playing with house money.
Negotiation context
- It's been on market 26 days — a 2% lower offer ($39k) is reasonable based on typical stale-listing flexibility.
- 2 sale attempts with the ask held roughly flat each time — persistent listings suggest the price (not the market) is what's stuck; bring a comps-based counter.
Risks & watch-outs
- Watch-outs: property tax is 3.6% of price; built in 1920 — expect roof / HVAC / electrical / plumbing capex.
- Climate carrying-cost: major wind risk, 27% chance of damaging wind over 30y; extreme-heat days projected 7→15/yr by 2055 (HVAC capex compounding) — expect insurance premiums to compound above CPI over the hold.
Questions for the listing agent
- Built in 1920 — when were the roof, HVAC, electrical panel, plumbing, and water heater last replaced?
- Property tax is high relative to price — has the assessment been appealed recently, and will the sale trigger a re-assessment?
- Is there a deadline driving the sale (1031 exchange, divorce, estate, relocation)? That informs how much negotiation room exists.
- Schools are D-rated, which usually means shorter tenancies and higher turnover. Who's the typical renter profile here, and what's been the actual vacancy rate?
- Crime grade is F in this area — have there been break-ins, vandalism, or insurance claims at this property in the last 3 years? What carrier currently insures it and at what premium?
- The area grade is low — what's the realistic commute time and amenity access for the typical tenant pool here? Any planned neighborhood developments (good or bad) we should know about?
- What's the average days-on-market for RENTAL listings here right now (not sales)? A rising rental-DOM trend means longer vacancies and softer asking-rent achievability than the comps imply.
- What's the recent tenant-quality profile in this submarket — average credit score on applications, eviction rate, late-payment / NSF rate, and stable-employment percentage? A property-management company in the area should have these aggregated.
- How much new for-sale + rental construction is in the pipeline within 1–3 miles? Heavy new supply typically softens prices + rents 12–24 months out; constrained supply supports both.
Investment metrics
- 1% rule
- 6.02% ✓
- Cap rate
- 52.93%
- Cash-on-cash
- 166.57%
- DSCR
- 8.41
- GRM
- 1.4
CMA / ARV
- ARV (median comp)
- $63,620
- List price
- $40,000
- Delta
- -37.13%
- Verdict
- UNDERPRICED
- Comps
- 20 within 1.0 mi
Show comp detail 12 sales within ~0.75 mi
| Address | Dist | Beds/Ba | Sqft | Sold | Price | $/sf | Match |
|---|---|---|---|---|---|---|---|
| 2113 Sidney Ave | 0.13mi | 3/1.0 | 1,260 (-1%) | 2mo | $72,500 | $58 | 91 |
| 2317 Annapolis Rd | 0.28mi | 3/1.0 | 1,372 (+8%) | 5mo | $40,000 | $29 | 70 |
| 2625 Waterview Ave | 0.55mi | 3/1.0 | 1,260 (-1%) | 6mo | $94,200 | $75 | 68 |
| 2239 Annapolis Rd | 0.22mi | 3/1.5 | 1,370 (+8%) | 8mo | $40,000 | $29 | 68 |
| 2318 Sidney Ave | 0.28mi | 3/1.0 | 1,120 (-12%) | 2mo | $72,500 | $65 | 65 |
| 2405 Westport St | 0.38mi | 2/2.0 (-1) | 1,200 (-6%) | 0mo | $75,000 | $63 | 64 |
| 2316 Cedley St | 0.29mi | 3/2.0 | 1,144 (-10%) | 4mo | $140,000 | $122 | 62 |
| 2348 Sidney Ave | 0.32mi | 3/1.0 | 1,120 (-12%) | 11mo | $115,000 | $103 | 56 |
| 2512 Ridgely St | 0.74mi | 3/1.5 | 1,152 (-9%) | 10mo | $145,000 | $126 | 40 |
| 2439 Ridgely St | 0.71mi | 4/2.5 (+1) | 1,152 (-9%) | 4mo | $222,000 | $193 | 37 |
| 2105 Maisel St | 0.68mi | 3/1.0 | 1,456 (+14%) | 11mo | $180,000 | $124 | 35 |
| 2400 Ridgely St | 0.66mi | 3/2.5 | 1,440 (+13%) | 10mo | $243,000 | $169 | 33 |
Match score weights: distance 35% · size 25% · config 20% · recency 20%. Top-matched comps best support the ARV.
Projected returns pro-forma
-3.0% appreciation · 0.0% rent growth · sell at horizon
- IRR
- —
- Equity multiple
- 8.64×
- Total profit
- $85,564
- Equity at exit
- $5,964
- IRR
- —
- Equity multiple
- 16.63×
- Total profit
- $175,074
- Equity at exit
- $3,458
Cash invested: $11,200 (down + closing). Projections, not guarantees.
Landlord ↔ Tenant lean methodology
- Overall (CITY)
- 12 Strongly Tenant-Friendly
- State Maryland
- 27 Tenant-Leaning · D+14
- County
- — inherits STATE
- City Baltimore
- 12 Strongly Tenant-Friendly · D+58
ZIP-level market 21230
- Rents YoY
- -1.0%
- Active inventory
- 362
- Price-to-rent
- 1.4×
Monthly cashflow live
- Estimated rent
- $2,407 high interval (Pro) →
- Mortgage (P&I)
- −$210
- Tax from tax record
- −$120 /mo · $1,444/yr
- Insurance
- −$17
- HOA
- −$0
- Vacancy / Maint / Mgmt
- −$505
- Net cashflow
- $1,555
Break-even live
UW: 25.0% down · 7.5% · 30yr · 1.5% tax · 5.0% vac · 8.0% maint · 8.0% mgmt
Financing live
Cash to close
- Down payment
- $10,000
- Closing costs
- $1,200
- Reserves months
- —
- Total cash needed
- —
Loan-product check · same deal, 3 products live
Conventional
25% down · 7.5% · 30yr
- Down + closing
- —
- Monthly P&I
- —
- Monthly cashflow
- —
- DSCR
- —
- Eligible?
- —
Personal DTI + credit; lowest rate.
DSCR
20% down · 8.5% · 30yr
- Down + closing
- —
- Monthly P&I
- —
- Monthly cashflow
- —
- DSCR
- —
- Eligible?
- —
No personal income docs; deal must DSCR.
Hard money
10% down · 12.0% · 12mo
- Down + closing
- —
- Monthly P&I
- —
- Monthly cashflow
- —
- DSCR
- —
- Eligible?
- —
Short-term bridge; refi at stabilization.
Rent comps 40 comps
| Address | Beds | Baths | Sqft | Rent | $/sqft | DOM | Units | Dist |
|---|---|---|---|---|---|---|---|---|
| 1432 Carroll St Baltimore, MD | 2.0 | 1.5 | 912 | $1,900 | $2.08 | 43d | 1 | 0.88mi |
| 111 W Heath St Baltimore, MD | 2.0 | 1.0–2.5 | 1263 | $2,850 | $2.26 | 3d | 7 | 0.88mi |
| 2056 Griffis Ave Baltimore, MD | 3.0 | 1.5 | 1230 | $1,495 | $1.22 | 22d | 1 | 0.90mi |
| 1900 S Hanover St Baltimore, MD | 3.0 | 1.0–2.0 | 875 | $3,932 | $4.49 | 2d | 66 | 0.91mi |
| 1746 S Hanover St Baltimore, MD | 3.0 | 2.0 | 1490 | $2,700 | $1.81 | 11d | 1 | 0.93mi |
| 1110 S Paca St Baltimore, MD | 2.0 | 3.5 | 1557 | $2,150 | $1.38 | 43d | 1 | 0.93mi |
| 1718 S Hanover St Baltimore, MD | 2.0 | 2.5 | 1296 | $2,700 | $2.08 | 24d | 1 | 0.93mi |
| 1125 Wicomico St Baltimore, MD | 3.0 | 3.0 | 1068 | $1,955 | $1.83 | 24d | 1 | 0.93mi |
| 1108 Sterrett St Baltimore, MD | 2.0 | 1.0 | 1400 | $2,300 | $1.64 | 24d | 1 | 0.94mi |
| 1516 Clarkson St Baltimore, MD | 2.0 | 1.5 | 1050 | $1,795 | $1.71 | 24d | 1 | 0.95mi |
| 1725 S Hanover St Baltimore, MD | 3.0 | 3.5 | 1704 | $3,090 | $1.81 | 43d | 1 | 0.96mi |
| 1403 Race St Baltimore, MD | 3.0 | 3.0 | 1008 | $2,200 | $2.18 | 43d | 1 | 0.96mi |
| 1608 S Hanover St Baltimore, MD | 3.0 | 3.5 | 1346 | $3,000 | $2.23 | 18d | 1 | 0.96mi |
| 1205 Cleveland St Baltimore, MD | 2.0 | 2.0 | 1232 | $1,900 | $1.54 | 43d | 1 | 0.97mi |
| 1402 Clarkson St Baltimore, MD | 2.0 | 2.0 | 1557 | $2,400 | $1.54 | 24d | 1 | 0.98mi |
| 1931 Griffis Ave Baltimore, MD | 2.0 | 1.0 | 912 | $1,349 | $1.48 | 4d | 1 | 0.98mi |
| 1601 S Hanover St Apt 1R Baltimore, MD | 2.0 | 1.0 | 900 | $1,600 | $1.78 | 2d | 1 | 0.99mi |
| 126 Burnett St Baltimore, MD | 2.0 | 2.5 | 984 | $2,200 | $2.24 | 24d | 1 | 0.99mi |
| 117 E Cromwell St Unit A Baltimore, MD | 3.0 | 2.5 | 1603 | $3,750 | $2.34 | 43d | 1 | 1.00mi |
| 1839 S Charles St Baltimore, MD | 3.0 | 2.5 | 1238 | $2,600 | $2.10 | 43d | 1 | 1.00mi |
| 1815 S Charles St Baltimore, MD | 2.0 | 2.0 | 1208 | $2,100 | $1.74 | 43d | 1 | 1.01mi |
| 1631 S Charles St Baltimore, MD | 2.0 | 3.0 | 1460 | $2,607 | $1.79 | 4d | 1 | 1.03mi |
| 1132 Nanticoke St Baltimore, MD | 2.0 | 2.5 | 1500 | $1,875 | $1.25 | 24d | 1 | 1.03mi |
| 1259 Washington Blvd Baltimore, MD | 3.0 | 3.0 | 1232 | $2,999 | $2.43 | 4d | 1 | 1.04mi |
| 2500 Insulator Dr Baltimore, MD | 3.0 | 1.0–2.0 | 988 | $4,786 | $4.84 | 2d | 152 | 1.04mi |
| 1243 Washington Blvd Baltimore, MD | 3.0 | 2.0 | 1148 | $1,950 | $1.70 | 43d | 1 | 1.05mi |
| 1127 S Carey St Baltimore, MD | 3.0 | 2.5 | 1340 | $1,900 | $1.42 | 4d | 1 | 1.05mi |
| 22 E Heath St Baltimore, MD | 3.0 | 2.5 | 1800 | $2,900 | $1.61 | 12d | 1 | 1.05mi |
| 2454 Terra Firma Rd Brooklyn, MD | 3.0 | 1.0 | 1024 | $1,650 | $1.61 | 15d | 1 | 1.06mi |
| 1942 Light St Baltimore, MD | 2.0 | 2.5 | 1150 | $2,200 | $1.91 | 22d | 1 | 1.06mi |
| 1303 James St Baltimore, MD | 2.0 | 1.5 | 1160 | $1,350 | $1.16 | 24d | 1 | 1.07mi |
| 8 E Randall St Baltimore, MD | 2.0 | 2.5 | 1148 | $2,600 | $2.26 | 4d | 1 | 1.07mi |
| 101 W Cross St Baltimore, MD | 2.0 | 1.0–2.0 | 937 | $3,332 | $3.55 | 2d | 23 | 1.07mi |
| 1703 Patapsco St Baltimore, MD | 4.0 | 4.5 | 960 | $3,000 | $3.12 | 24d | 1 | 1.07mi |
| 1503 S Charles St Unit 2 Baltimore, MD | 2.0 | 2.0 | 1100 | $2,375 | $2.16 | 43d | 1 | 1.07mi |
| 1253 Sargeant St Baltimore, MD | 2.0 | 1.5 | 1200 | $1,695 | $1.41 | 24d | 1 | 1.08mi |
| 2 W Clement St Baltimore, MD | 3.0 | 3.5 | 1866 | $3,400 | $1.82 | 18d | 1 | 1.08mi |
| 709 Scott St Baltimore, MD | 3.0 | 2.5 | 1448 | $2,500 | $1.73 | 24d | 1 | 1.08mi |
| 709 Scott St Baltimore, MD | 3.0 | 3.0 | 1448 | $2,500 | $1.73 | 15d | 1 | 1.08mi |
| 1617 Patapsco St Baltimore, MD | 3.0 | 3.0 | 1537 | $2,500 | $1.63 | 2d | 1 | 1.08mi |
Listing history 4 events
-
2026-05-14status Pending 1099-char remark
Show marketing remark (1099 chars)
HUD Owned Home, case number 241-948224. HUD Homes are sold "as is, subject to appraisal. Discover a wonderful investment opportunity in the heart of the Westport community! This semi-detached home, built in 1920, features a brick exterior and offers 1,272 sq. ft. of living space. Venture inside to find a living room that leads to the dining area and kitchen, three bedrooms, a full bathroom and an unfinished basement that provides endless possibilities for expansion or additional storage. The exterior features include sidewalks and a front porch, ideal for enjoying warm evenings or morning coffee. With off-street and on-street parking options, accessibility is a breeze for residents. This property is close in proximity to amenities, local dining and shopping. It is also near the Patapsco River, providing water access for recreational activities such as kayaking or fishing. This desirable location not only enhances the lifestyle appeal but also positions the property for potential appreciation and strong rental returns. Don't miss your chance to invest on this unique opportunity!
-
2026-05-11status Active 1099-char remark
Show marketing remark (1099 chars)
HUD Owned Home, case number 241-948224. HUD Homes are sold "as is, subject to appraisal. Discover a wonderful investment opportunity in the heart of the Westport community! This semi-detached home, built in 1920, features a brick exterior and offers 1,272 sq. ft. of living space. Venture inside to find a living room that leads to the dining area and kitchen, three bedrooms, a full bathroom and an unfinished basement that provides endless possibilities for expansion or additional storage. The exterior features include sidewalks and a front porch, ideal for enjoying warm evenings or morning coffee. With off-street and on-street parking options, accessibility is a breeze for residents. This property is close in proximity to amenities, local dining and shopping. It is also near the Patapsco River, providing water access for recreational activities such as kayaking or fishing. This desirable location not only enhances the lifestyle appeal but also positions the property for potential appreciation and strong rental returns. Don't miss your chance to invest on this unique opportunity!
-
2026-05-08status Pending 1099-char remark
Show marketing remark (1099 chars)
HUD Owned Home, case number 241-948224. HUD Homes are sold "as is, subject to appraisal. Discover a wonderful investment opportunity in the heart of the Westport community! This semi-detached home, built in 1920, features a brick exterior and offers 1,272 sq. ft. of living space. Venture inside to find a living room that leads to the dining area and kitchen, three bedrooms, a full bathroom and an unfinished basement that provides endless possibilities for expansion or additional storage. The exterior features include sidewalks and a front porch, ideal for enjoying warm evenings or morning coffee. With off-street and on-street parking options, accessibility is a breeze for residents. This property is close in proximity to amenities, local dining and shopping. It is also near the Patapsco River, providing water access for recreational activities such as kayaking or fishing. This desirable location not only enhances the lifestyle appeal but also positions the property for potential appreciation and strong rental returns. Don't miss your chance to invest on this unique opportunity!
-
2026-04-15$40,000 Active 1099-char remark
Show marketing remark (1099 chars)
HUD Owned Home, case number 241-948224. HUD Homes are sold "as is, subject to appraisal. Discover a wonderful investment opportunity in the heart of the Westport community! This semi-detached home, built in 1920, features a brick exterior and offers 1,272 sq. ft. of living space. Venture inside to find a living room that leads to the dining area and kitchen, three bedrooms, a full bathroom and an unfinished basement that provides endless possibilities for expansion or additional storage. The exterior features include sidewalks and a front porch, ideal for enjoying warm evenings or morning coffee. With off-street and on-street parking options, accessibility is a breeze for residents. This property is close in proximity to amenities, local dining and shopping. It is also near the Patapsco River, providing water access for recreational activities such as kayaking or fishing. This desirable location not only enhances the lifestyle appeal but also positions the property for potential appreciation and strong rental returns. Don't miss your chance to invest on this unique opportunity!
ⓘ Source: listings_history table (triggers on properties + properties_extension) + one-shot
backfill from property_details.listing_events for pre-trigger history.
Tax reassessment forecast MD · Partial reset (capped growth)
- Current annual tax
- $1,444 · $120/mo
- Projected year-2 tax
- $1,444 · $120/mo
- Expected delta
- $0/yr ($0/mo · 0.0%)
ⓘ Screening estimate from a state-policy table — verify with the county assessor before closing.
Climate risk First Street
- Flood 3/10 Moderate FEMA zone X (shaded) · 20% chance over 30 yrs
- Wildfire 1/10 Low
- Heat 8/10 Severe 7 d/yr ≥102°F today · 15 d/yr by 30 yrs out
- Wind 6/10 Major 27% chance of damaging wind over 30 yrs
- Air quality 4/10 Moderate 6 unhealthy d/yr today · 7 by 30 yrs out
Nearby sold comps map
Loading sold comps map…
Walkable amenities ~0.75 mi
Loading nearby amenities…
Taxation est. · year 1
- Rental income
- $28,883
- − Mortgage interest
- −$2,241
- − Property taxes
- −$1,444
- − Insurance
- −$200
- − Repairs & maintenance
- −$2,311
- − Management
- −$2,311
- − Depreciation
- −$1,164
- Taxable income
- $19,213
- Est. tax owed @ 24.0%
- −$4,611
- After-tax cash flow
- $14,045/yr
For passive investors: Depreciation is non-cash, so a rental often shows a tax loss while cash-flowing — sheltering income. Rental losses are passive: they offset passive income freely, and up to $25,000/yr can offset ordinary (W-2) income if you actively participate and your MAGI is under $100k (phasing out to $0 by $150k); unused losses carry forward. On sale, claimed depreciation is recaptured at up to 25%, and gains may owe capital-gains tax (a 1031 exchange can defer both). Figures are a year-1 estimate at your 24.0% rate — not tax advice; consult a CPA.
Schools (NCES district)
- District
- Baltimore City Public Schools
- NCES district ID
- 2400090
- Math proficiency
- 7% ▼ -9.00%
- Reading proficiency
- 16% ▼ -5.00%
- Median HH income
- $42,108
- Composite
- 10.08/100
- National rank
- #9805
- State rank
- #24 of 24 in MD
Livability — Baltimore
- Score
- 76/100
- State rank
- #90
- US rank
- #3396
Category grades
Schools grade is shown separately in the Schools card above.
Census & demographics
- Census place
- Baltimore, MD
- County
- Baltimore City · 558,601 people
- City population
- 588,727
- Metro
- Baltimore-Columbia-Towson, MD
- Population (ZIP)
- 32,977
- Household income
- $91,842
- Rent vs Own
- Severe rent burden
- 1463.0
Population outlook (Baltimore County) Hauer SSP2
- Today (2025)
- 624,249 people
- By 2030
- 621,541 · -0.4%
- By 2040
- 609,756 · -2.3%
- By 2050
- 597,249 · -4.3%
- By 2075
- 552,236 · -11.5%
- By 2100
- 513,934 · -17.7%
Race, ethnicity, and origin ACS 2023
- Neighborhood character
- Diverse neighborhood (Simpson 0.63)
- Race & ethnicity
- White 55% Black 23% Hispanic / Latino 13% Two or more races 6% Asian 4%
- Hispanic origin (detail)
- Mexican 1% Puerto Rican 1%
- Common ancestry
- Romanian 5% Lithuanian 2% Italian 2%
- Foreign-born
- 10% · Canada, China
- Languages at home
- 85% English-only · Spanish 9% Other Indo-European 1% Other Asian/Pacific 1%
Political lean MEDSL · Baltimore
- 2024 margin
- Solid D (+73.0) · D 85.2% · R 12.2% · Other 2.6%
- 2008→2024 swing
- -2.5pp toward R · 2008: 75.5pp · 2024: 73.0pp
- All cycles
- 2024: D+73.0 2020: D+76.6 2016: D+74.6 2012: D+76.4 2008: D+75.5
Not yet ingested
- Civics
- —
Market trends
- HPI YoY
- ▼ -311.43%
- Current HPI
- 284.338
- Rent YoY
- ▼ -1.00%
- Metro
- Baltimore-Columbia-Towson, MD
- State GDP YoY
- ▲ 2.97%
- F500 in state
- 12
Industry mix (Fortune 500 HQ in MD)
| Industry | F500 HQs | Revenue |
|---|---|---|
| Aerospace / Defense | 1 | $71B |
|
||
| Utilities | 1 | $25B |
|
||
| Hotels | 1 | $24B |
|
||
| Consumer Goods | 1 | $7B |
|
||
| Real Estate | 1 | $6B |
|
||
| Chemicals | 1 | $2B |
|
||
Price history
4 events — show timeline
- 2026-05-14 Pending — BRIGHT MLS
- 2026-05-11 Relisted — BRIGHT MLS
- 2026-05-08 Pending — BRIGHT MLS
- 2026-04-15 Listed $40,000 BRIGHT MLS
Property tax history
+4.8%/yrLatest (2025): $1,444 · +69.7% YoY. Source: county tax records.
Cash-flow waterfall
monthlySold comps — $/sqft
last 12 mo · ≤1 miLoading sold comps…