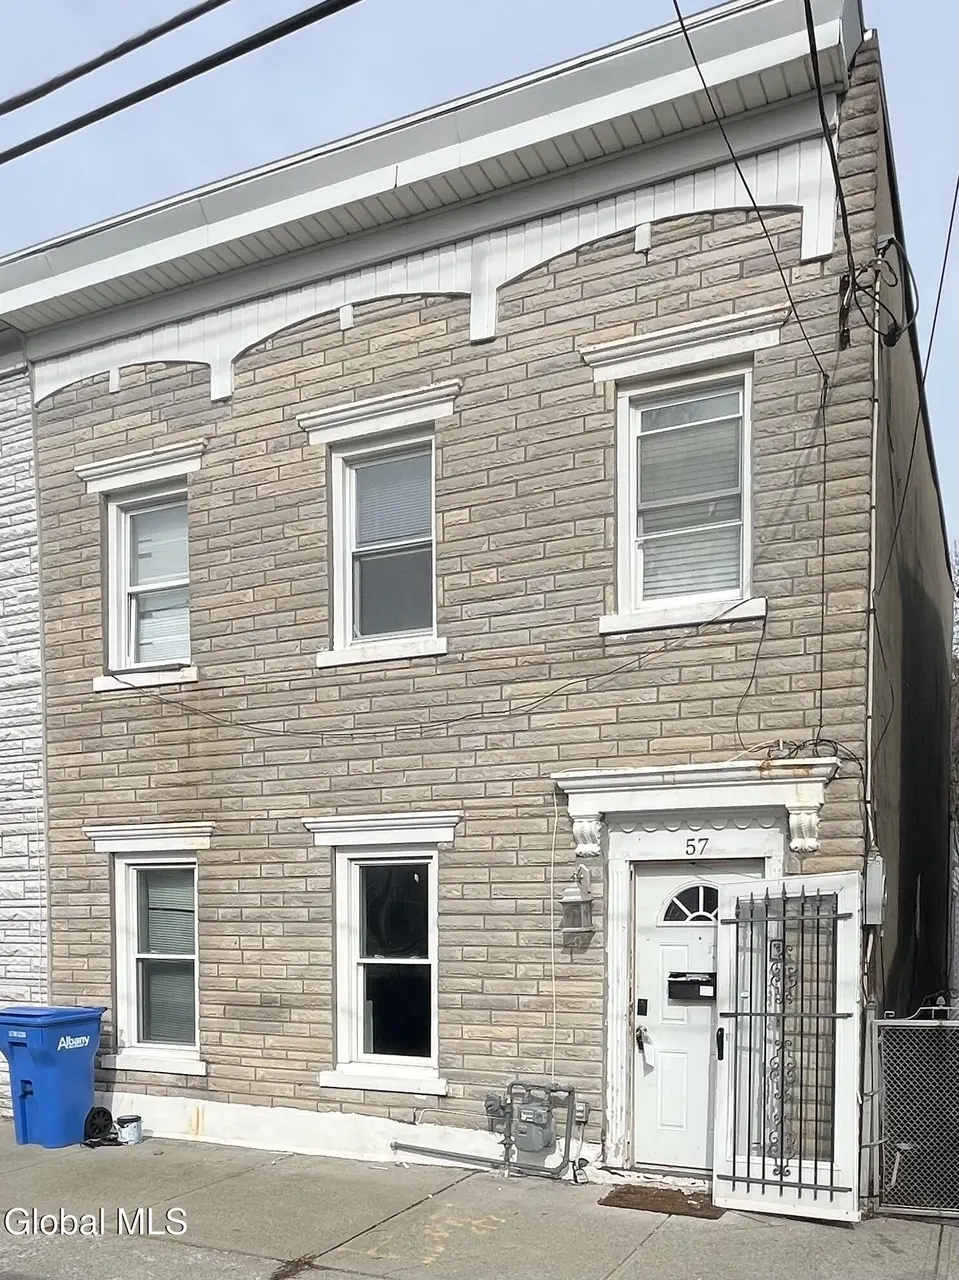
57 O Connell St · Albany, NY
Flood risk 1/10 · Minimal
- FEMA flood zone
- X (unshaded)
- Chance of flooding over 30 yrs
- 0.0%
- Est. flood insurance / yr
- $473 – $860
Fire risk 2/10 · Minimal
- Est. fire insurance / yr
- $691 – $1,283
Heat risk 4/10 · Minor
- Hot days now (above 99°F)
- 7 days/yr
- Hot days in 30 yrs
- 16 days/yr
Wind risk 3/10 · Minor
- Chance of severe wind over 30 yrs
- 6.0%
Air-quality risk 1/10 · Minimal
- Unhealthy air days now
- 0 days/yr
- Unhealthy air days in 30 yrs
- 0 days/yr
Risk factors via First Street. Map © Google.
Why this score? — see what drove the B- grade
The composite is a weighted blend of 9 inputs, each scored 0–100. Each bar is that input's sub-score; the figure is the points it added to the 100-point composite (weight × sub-score).
- Cash flow +30.0/30.0
- 1% rule +10.0/10.0
- DSCR +10.0/10.0
- ARV discount +7.5/15.0
- Livability +4.0/5.0
- Schools +3.2/10.0
- Rent growth +2.5/5.0
- Condition / age +2.5/5.0
- Appreciation +0.0/10.0
$70,000
🖨 Deal sheet (PDF) 📄 Offer letter ✓ Due diligence
Listing remarks MLS
This is a short sale, offers require approval from the lender. Property needs considerable repairs and is being sold as-is. This property presents a great opportunity for an experienced investor or contractor. Cash only. 3 large bedrooms and 2 full baths. Fenced-in back yard. Street parking.
Key facts
- 2,613 sq ft lot
- Built 1901
- Listed 36 days
Neighborhood map
What this means for you Summary
Snapshot
- This is a 3-bed/1.5-bath townhouse listed at $70k.
Deal economics
- At list price, monthly cash flow is $1k ($14k/yr) — positive.
- The deal already cash-flows at list — no discount required.
- Meets the 1% rule at list price ($2k rent vs $70k).
- Recommended offer: $68k (3.0% below list) — sets the bar for market timing.
- Cap rate 26.0% vs local median 5.7% in Albany — top-decile yield for the area; either an underpriced asset or a hidden risk that comps aren't pricing in. Stress-test before assuming the spread holds.
Location & tenants
- Location reads 79/100 on livability (#129 in NY, #2,083 nationally) — a middle-class / working-renter tenant base. Strengths: amenities A+, commute A+, housing A+; Watch: employment C-, crime F.
- Albany City School District (urban): math 37% / reading 40% proficiency, ranked #543 of 590 in NY (top 92%) — families likely to look elsewhere, expect single-tenant / working-renter base with shorter leases; 66% free/reduced lunch — lower-income household profile, screen leases tightly.
- Market conditions: 47 active listings in the ZIP; 40 comparable units currently listed for rent nearby; rentals at typical pace (median 25d on market — plan ~3-4 weeks tenant-placement turnaround); 40% of comp listings sitting > 30 days — soft ceiling on asking rent; 675 units permitted in Albany County in 2024 (451 in 5+ unit buildings).
Forward outlook
- Local home prices are declining (-3.0%/yr); year-one equity from $484 of loan paydown is wiped out by about $2k of value loss. Plan a longer hold.
- Albany County population projected at +9% by 2050 — modest demand growth; plan on rents tracking national, not racing it.
- At projected returns (-3.0% appreciation + 3.0% rent growth), your $20k cash investment doubles in ~2 years — after that, you're playing with house money.
Negotiation context
- It's been on market 36 days — a 3% lower offer ($68k) is reasonable based on typical stale-listing flexibility.
- 32 sale attempts since 27y ago with the ask held roughly flat each time — persistent listings suggest the price (not the market) is what's stuck; bring a comps-based counter.
Risks & watch-outs
- Watch-outs: built in 1901 — expect roof / HVAC / electrical / plumbing capex.
Questions for the listing agent
- It's been on market 36 days. Have you received any prior offers? Is the seller open to a 3% concession, seller financing, or rate buy-down credit?
- Built in 1901 — when were the roof, HVAC, electrical panel, plumbing, and water heater last replaced?
- Is there a deadline driving the sale (1031 exchange, divorce, estate, relocation)? That informs how much negotiation room exists.
- Crime grade is F in this area — have there been break-ins, vandalism, or insurance claims at this property in the last 3 years? What carrier currently insures it and at what premium?
- What's the average days-on-market for RENTAL listings here right now (not sales)? A rising rental-DOM trend means longer vacancies and softer asking-rent achievability than the comps imply.
- What's the recent tenant-quality profile in this submarket — average credit score on applications, eviction rate, late-payment / NSF rate, and stable-employment percentage? A property-management company in the area should have these aggregated.
- How much new for-sale + rental construction is in the pipeline within 1–3 miles? Heavy new supply typically softens prices + rents 12–24 months out; constrained supply supports both.
Investment metrics
- 1% rule
- 2.96% ✓
- Cap rate
- 26.05%
- Cash-on-cash
- 70.56%
- DSCR
- 4.14
- GRM
- 2.8
CMA / ARV
- ARV (median comp)
- $210,160
- List price
- $70,000
- Delta
- -66.69%
- Verdict
- UNDERPRICED
- Comps
- 20 within 1.0 mi
Show comp detail 1 sale within ~0.75 mi
| Address | Dist | Beds/Ba | Sqft | Sold | Price | $/sf | Match |
|---|---|---|---|---|---|---|---|
| 43 Garland Ct | 0.63mi | 4/1.5 (+1) | 1,720 (+9%) | 19mo | $204,400 | $119 | 36 |
Match score weights: distance 35% · size 25% · config 20% · recency 20%. Top-matched comps best support the ARV.
Projected returns pro-forma
-3.0% appreciation · 3.0% rent growth · sell at horizon
- IRR
- 70.1%
- Equity multiple
- 4.17×
- Total profit
- $62,088
- Equity at exit
- $10,437
- IRR
- 74.2%
- Equity multiple
- 8.59×
- Total profit
- $148,705
- Equity at exit
- $6,052
Cash invested: $19,600 (down + closing). Projections, not guarantees.
Landlord ↔ Tenant lean methodology
- Overall (STATE)
- 15 Strongly Tenant-Friendly
- State New York
- 15 Strongly Tenant-Friendly · D+10
- County
- — inherits STATE
- City
- — inherits STATE
ZIP-level market 12209
- Home prices YoY
- -7.3%
- Active inventory
- 47
- Price-to-rent
- 2.8×
Monthly cashflow live
- Estimated rent
- $2,071 high interval (Pro) →
- Mortgage (P&I)
- −$367
- Tax est. 1.5%
- −$88 /mo · $1,050/yr
- Insurance
- −$29
- HOA
- −$0
- Vacancy / Maint / Mgmt
- −$435
- Net cashflow
- $1,152
Break-even live
Sensitivity live
| Price | -10% $1,201 | -5% $1,177 | +0% $1,152 | +5% $1,128 | +10% $1,104 |
|---|---|---|---|---|---|
| Rent | -10% $989 | -5% $1,071 | +0% $1,152 | +5% $1,234 | +10% $1,316 |
| Rate | -1.0pp $1,188 | -0.5pp $1,170 | base $1,152 | +0.5pp $1,134 | +1.0pp $1,116 |
UW: 25.0% down · 7.5% · 30yr · 1.5% tax · 5.0% vac · 8.0% maint · 8.0% mgmt
Financing live
Cash to close
- Down payment
- $17,500
- Closing costs
- $2,100
- Reserves months
- —
- Total cash needed
- —
Loan-product check · same deal, 3 products live
Conventional
25% down · 7.5% · 30yr
- Down + closing
- —
- Monthly P&I
- —
- Monthly cashflow
- —
- DSCR
- —
- Eligible?
- —
Personal DTI + credit; lowest rate.
DSCR
20% down · 8.5% · 30yr
- Down + closing
- —
- Monthly P&I
- —
- Monthly cashflow
- —
- DSCR
- —
- Eligible?
- —
No personal income docs; deal must DSCR.
Hard money
10% down · 12.0% · 12mo
- Down + closing
- —
- Monthly P&I
- —
- Monthly cashflow
- —
- DSCR
- —
- Eligible?
- —
Short-term bridge; refi at stabilization.
Rent comps 40 comps
| Address | Beds | Baths | Sqft | Rent | $/sqft | DOM | Units | Dist |
|---|---|---|---|---|---|---|---|---|
| 22 Hurlbut St Albany, NY | 3.0 | 1.0 | 1209 | $2,050 | $1.70 | 45d | 1 | 0.16mi |
| 31 Bertha St Albany, NY | 4.0 | 1.0 | 1116 | $2,000 | $1.79 | 25d | 1 | 0.19mi |
| 15 Stanwix St Albany, NY | 4.0 | 1.5 | 1660 | $2,500 | $1.51 | 16d | 1 | 0.33mi |
| 86 Hackett Blvd Albany, NY | 2.0 | 1.0 | 1100 | $1,900 | $1.73 | 25d | 1 | 0.43mi |
| 502 Second Ave #3 Albany, NY | 3.0 | 1.0 | 1100 | $1,800 | $1.64 | 45d | 1 | 0.49mi |
| 50 Southern Blvd Albany, NY | 3.0 | 1.0 | 1200 | $1,650 | $1.38 | 16d | 1 | 0.55mi |
| 201 Park Ave Unit 10 Albany, NY | 3.0 | 2.0 | 1600 | $2,100 | $1.31 | 45d | 1 | 0.66mi |
| 98 Mount Hope Dr Albany, NY | 2.0 | 1.5 | 1200 | $2,000 | $1.67 | 16d | 1 | 0.73mi |
| 475 S Pearl St #3 Albany, NY | 4.0 | 2.0 | 1200 | $1,850 | $1.54 | 23d | 1 | 0.78mi |
| 475 S Pearl St #3 Albany, NY | 4.0 | 2.0 | 1200 | $1,850 | $1.54 | 16d | 1 | 0.78mi |
| 364 Madison Ave Albany, NY | 2.0 | 2.0 | 1150 | $1,850 | $1.61 | 23d | 1 | 0.84mi |
| 346 Madison Ave Unit 3 Albany, NY | 3.0 | 2.0 | 1110 | $2,725 | $2.45 | 45d | 1 | 0.84mi |
| 346 Madison Ave Albany, NY | 3.0 | 2.0 | 1500 | $2,495 | $1.66 | 25d | 1 | 0.84mi |
| 25 Bleecker Pl #1 Albany, NY | 2.0 | 1.0 | 1150 | $1,350 | $1.17 | 46d | 1 | 0.85mi |
| 409 Madison Ave Albany, NY | 2.0 | 2.0 | 1050 | $2,094 | $1.99 | 25d | 1 | 0.88mi |
| 119 Grand St Albany, NY | 3.0 | 1.0 | 1600 | $1,300 | $0.81 | 45d | 1 | 0.91mi |
| 292 Lark St Albany, NY | 2.0 | 1.0 | 1100 | $1,500 | $1.36 | 45d | 1 | 0.91mi |
| 520 Madison Ave Unit 1 Albany, NY | 3.0 | 1.0 | 1080 | $1,700 | $1.57 | 45d | 1 | 0.92mi |
| 88 Willett St Albany, NY | 3.0 | 1.0 | 825 | $2,080 | $2.52 | 16d | 10 | 0.94mi |
| 164 Madison Ave Albany, NY | 2.0 | 1.0 | 1200 | $1,500 | $1.25 | 45d | 1 | 0.97mi |
| 52 Grove Ave Albany, NY | 4.0 | 1.0 | 1200 | $2,200 | $1.83 | 23d | 1 | 1.00mi |
| 21 Woodlawn Ave Unit 3rd floor Albany, NY | 3.0 | 1.0 | 1300 | $1,500 | $1.15 | 25d | 1 | 1.02mi |
| 21 Woodlawn Ave Unit 3RDFL Albany, NY | 3.0 | 1.0 | 1300 | $1,500 | $1.15 | 45d | 1 | 1.02mi |
| 227 Jay St Albany, NY | 2.0 | 2.0 | 1710 | $2,150 | $1.26 | 45d | 1 | 1.04mi |
| 154 Lancaster St Unit 1 Albany, NY | 2.0 | 1.5 | 1500 | $2,200 | $1.47 | 25d | 1 | 1.04mi |
| 546 Mercer St Unit 1 Albany, NY | 3.0 | 1.0 | 1400 | $1,800 | $1.29 | 25d | 1 | 1.05mi |
| 352 State St Albany, NY | 2.0 | 2.0 | 1143 | $2,500 | $2.19 | 25d | 1 | 1.15mi |
| 614 Park Ave Albany, NY | 3.0 | 1.0 | 1118 | $2,500 | $2.24 | 45d | 1 | 1.20mi |
| 240 Washington Ave Albany, NY | 2.0 | 2.0 | 1560 | $2,450 | $1.57 | 45d | 1 | 1.24mi |
| 433 Hamilton St Unit 1 Albany, NY | 4.0 | 1.0 | 1200 | $2,300 | $1.92 | 16d | 1 | 1.31mi |
| 363 Ontario St Albany, NY | 1.0–2.0 | 1.0–2.5 | 1610 | $3,485 | $2.16 | 16d | 1 | 1.31mi |
| 437 Hamilton St Unit 2 Albany, NY | 4.0 | 1.0 | 1200 | $2,300 | $1.92 | 16d | 1 | 1.32mi |
| 257 Quail St Albany, NY | 4.0 | 2.5 | 2208 | $2,800 | $1.27 | 45d | 1 | 1.33mi |
| 830 Madison Ave Albany, NY | 3.0 | 1.0 | 1180 | $1,700 | $1.44 | 25d | 1 | 1.36mi |
| 673 Myrtle Ave Albany, NY | 4.0 | 1.0 | 1076 | $2,400 | $2.23 | 23d | 1 | 1.37mi |
| 48 N Pearl St Albany, NY | 2.0 | 1.0–2.5 | 1251 | $3,500 | $2.80 | 16d | 17 | 1.38mi |
| 58 Elberon Pl Apt 2 Albany, NY | 4.0 | 1.0 | 1250 | $2,200 | $1.76 | 45d | 1 | 1.39mi |
| 147 Western Ave Albany, NY | 3.0 | 1.0 | 1428 | $1,800 | $1.26 | 16d | 1 | 1.39mi |
| 178 Western Ave Unit 3 Albany, NY | 3.0 | 1.0 | 1500 | $1,725 | $1.15 | 16d | 1 | 1.40mi |
| 30 Cardinal Ave Albany, NY | 4.0 | 1.0 | 1529 | $2,800 | $1.83 | 46d | 1 | 1.42mi |
Listing history 50 events
-
2026-05-14status Pending 292-char remark
Show marketing remark (292 chars)
This is a short sale, offers require approval from the lender. Property needs considerable repairs and is being sold as-is. This property presents a great opportunity for an experienced investor or contractor. Cash only. 3 large bedrooms and 2 full baths. Fenced-in back yard. Street parking.
-
2026-04-08$70,000 Active 292-char remark
Show marketing remark (292 chars)
This is a short sale, offers require approval from the lender. Property needs considerable repairs and is being sold as-is. This property presents a great opportunity for an experienced investor or contractor. Cash only. 3 large bedrooms and 2 full baths. Fenced-in back yard. Street parking.
-
2026-03-11status Active
-
2026-02-20status Pending
-
2026-01-13historical Contingent
-
2026-01-13historical
-
2025-12-29price $70,000
-
2025-12-26$155,000 Active
-
2025-11-22historical
-
2025-10-13price $154,900
-
2025-09-25$139,900 Active
-
2025-09-24historical
-
2025-08-27$145,000 Active
-
2025-07-24historical
-
2025-06-23$167,000 Active
-
2025-06-04status Pending
-
2025-05-27historical
-
2025-05-18$165,000 Active
-
2025-04-21status Active
-
2025-04-10status Pending
-
2025-04-10historical
-
2025-03-21price $165,000
-
2025-03-14historical $1,900
-
2025-02-19$150,000 Active
-
2024-11-01historical
-
2024-10-23$167,000 Active
-
2024-10-04$1,900
-
2024-08-19historical $1,900
-
2024-08-14historical
-
2024-08-09price $157,000
-
2024-07-14$1,900
-
2024-07-11$162,000 Active
-
2024-06-29status Active
-
2024-06-17historical Contingent
-
2024-06-17historical
-
2024-06-03$162,000 Active
-
2024-05-29historical
-
2024-05-06$162,000 Active
-
2024-05-02historical
-
2024-04-27$169,900 Active
-
2024-04-22historical
-
2024-03-19$135,000 Active
-
2024-03-16historical
-
2024-03-06$169,900 Active
-
2024-01-14historical
-
2023-12-28price $169,900
-
2023-12-13$179,900 Active
-
2023-12-04historical
-
2023-11-16price $179,000
-
2023-11-04$189,900 Active
ⓘ Source: listings_history table (triggers on properties + properties_extension) + one-shot
backfill from property_details.listing_events for pre-trigger history.
Climate risk First Street
- Flood 1/10 Low FEMA zone X (unshaded) · 0% chance over 30 yrs
- Wildfire 2/10 Low
- Heat 4/10 Moderate 7 d/yr ≥99°F today · 16 d/yr by 30 yrs out
- Wind 3/10 Moderate 6% chance of damaging wind over 30 yrs
- Air quality 1/10 Low 0 unhealthy d/yr today · 0 by 30 yrs out
Nearby sold comps map
Loading sold comps map…
Walkable amenities ~0.75 mi
Loading nearby amenities…
Taxation est. · year 1
- Rental income
- $24,854
- − Mortgage interest
- −$3,921
- − Property taxes
- −$1,050
- − Insurance
- −$350
- − Repairs & maintenance
- −$1,988
- − Management
- −$1,988
- − Depreciation
- −$2,036
- Taxable income
- $13,520
- Est. tax owed @ 24.0%
- −$3,245
- After-tax cash flow
- $10,585/yr
For passive investors: Depreciation is non-cash, so a rental often shows a tax loss while cash-flowing — sheltering income. Rental losses are passive: they offset passive income freely, and up to $25,000/yr can offset ordinary (W-2) income if you actively participate and your MAGI is under $100k (phasing out to $0 by $150k); unused losses carry forward. On sale, claimed depreciation is recaptured at up to 25%, and gains may owe capital-gains tax (a 1031 exchange can defer both). Figures are a year-1 estimate at your 24.0% rate — not tax advice; consult a CPA.
Schools (NCES district)
- District
- Albany City School District
- NCES district ID
- 3602460
- Math proficiency
- 37% ▲ 6.00%
- Reading proficiency
- 40% ▲ 7.00%
- Median HH income
- $40,568
- Composite
- 32.34/100
- National rank
- #5744
- State rank
- #543 of 590 in NY
Livability — Albany
- Score
- 79/100
- State rank
- #129
- US rank
- #2083
Category grades
Schools grade is shown separately in the Schools card above.
Census & demographics
- Census place
- Albany, NY
- City population
- 116,921
- Population (ZIP)
- 10,754
Population outlook (Albany County) Hauer SSP2
- Today (2025)
- 320,794 people
- By 2030
- 327,401 · +2.1%
- By 2040
- 338,218 · +5.4%
- By 2050
- 348,467 · +8.6%
- By 2075
- 381,693 · +19.0%
- By 2100
- 393,809 · +22.8%
Race, ethnicity, and origin ACS 2023
- Neighborhood character
- Diverse neighborhood (Simpson 0.69)
- Race & ethnicity
- White 46% Black 23% Hispanic / Latino 19% Asian 8% Two or more races 7%
- Hispanic origin (detail)
- Puerto Rican 6%
- Common ancestry
- Romanian 4% Lithuanian 3% Serbian 1%
- Foreign-born
- 18% · Canada, Philippines, South Korea
- Languages at home
- 77% English-only · Spanish 13% Other Asian/Pacific 3% Tagalog/Filipino 1%
Political lean MEDSL · Albany
- 2024 margin
- Strong D (+25.8) · D 62.9% · R 37.1%
- 2008→2024 swing
- -3.6pp toward R · 2008: 29.4pp · 2024: 25.8pp
- All cycles
- 2024: D+25.8 2020: D+31.4 2016: D+24.3 2012: D+31.0 2008: D+29.4
Not yet ingested
- Civics
- —
Market trends
- HPI YoY
- ▼ -24.91%
- Current HPI
- 318.0191
- Rent YoY
- —
- Metro
- —
- State GDP YoY
- ▲ 2.60%
- F500 in state
- 92
Industry mix (Fortune 500 HQ in NY)
| Industry | F500 HQs | Revenue |
|---|---|---|
| Financial Services | 10 | $950B |
|
||
| Consumer Goods | 9 | $162B |
|
||
| Insurance | 4 | $225B |
|
||
| Telecommunications | 2 | $144B |
|
||
| Pharmaceuticals | 2 | $112B |
|
||
| Media / Entertainment | 2 | $69B |
|
||
Price history
+52.5% since first listed82 events — show timeline
- 2026-05-14 Pending — Global MLS
- 2026-04-08 Listed $70,000 Global MLS
- 2026-03-11 Relisted — Global MLS
- 2026-02-20 Pending — Global MLS
- 2026-01-13 Contingent — Global MLS
- 2026-01-13 Listing Removed — Global MLS
- 2025-12-29 Price Changed $70,000 Global MLS
- 2025-12-26 Listed $155,000 Global MLS
- 2025-11-22 Listing Removed — Global MLS
- 2025-10-13 Price Changed $154,900 Global MLS
- 2025-09-25 Listed $139,900 Global MLS
- 2025-09-24 Listing Removed — Global MLS
- 2025-08-27 Listed $145,000 Global MLS
- 2025-07-24 Listing Removed — Global MLS
- 2025-06-23 Listed $167,000 Global MLS
- 2025-06-04 Pending — Global MLS
- 2025-05-27 Listing Removed — Global MLS
- 2025-05-18 Listed $165,000 Global MLS
- 2025-04-21 Relisted — Global MLS
- 2025-04-10 Pending — Global MLS
- 2025-04-10 Listing Removed — Global MLS
- 2025-03-21 Price Changed $165,000 Global MLS
- 2025-03-14 Rental Removed $1,900 APPFOLIO
- 2025-02-19 Listed $150,000 Global MLS
- 2024-11-01 Listing Removed — Global MLS
- 2024-10-23 Listed $167,000 Global MLS
- 2024-10-04 Listed for Rent $1,900 APPFOLIO
- 2024-08-19 Rental Removed $1,900 APPFOLIO
- 2024-08-14 Listing Removed — Global MLS
- 2024-08-09 Price Changed $157,000 Global MLS
- 2024-07-14 Listed for Rent $1,900 APPFOLIO
- 2024-07-11 Listed $162,000 Global MLS
- 2024-06-29 Relisted — Global MLS
- 2024-06-17 Contingent — Global MLS
- 2024-06-17 Listing Removed — Global MLS
- 2024-06-03 Listed $162,000 Global MLS
- 2024-05-29 Listing Removed — Global MLS
- 2024-05-06 Listed $162,000 Global MLS
- 2024-05-02 Listing Removed — Global MLS
- 2024-04-27 Listed $169,900 Global MLS
- 2024-04-22 Listing Removed — Global MLS
- 2024-03-19 Listed $135,000 Global MLS
- 2024-03-16 Listing Removed — Global MLS
- 2024-03-06 Listed $169,900 Global MLS
- 2024-01-14 Listing Removed — Global MLS
- 2023-12-28 Price Changed $169,900 Global MLS
- 2023-12-13 Listed $179,900 Global MLS
- 2023-12-04 Listing Removed — Global MLS
- 2023-11-16 Price Changed $179,000 Global MLS
- 2023-11-04 Listed $189,900 Global MLS
- 2023-09-06 Listing Removed — Global MLS
- 2023-08-04 Price Changed $198,600 Global MLS
- 2023-06-14 Listed $187,000 Global MLS
- 2023-06-12 Listing Removed — Global MLS
- 2023-02-14 Listed $187,000 Global MLS
- 2023-02-01 Listing Removed — Global MLS
- 2022-11-28 Listed $187,500 Global MLS
- 2022-08-25 Listing Removed — Global MLS
- 2022-05-30 Price Changed $190,000 Global MLS
- 2022-05-17 Price Changed $180,000 Global MLS
- 2022-04-13 Relisted — Global MLS
- 2022-03-01 Listing Removed — Global MLS
- 2022-02-25 Listed $170,000 Global MLS
- 2021-10-04 Listing Removed — Global MLS
- 2021-09-13 Price Changed $170,000 Global MLS
- 2021-07-22 Listed $160,000 Global MLS
- 2019-02-26 Sold (Public Records) $77,500 Public Records
- 2019-02-20 Sold (MLS) $77,500 Global MLS
- 2019-01-22 Pending — Global MLS
- 2019-01-03 Price Changed $77,500 Global MLS
- 2018-11-06 Listed $82,500 Global MLS
- 2015-08-29 Listing Removed — Global MLS
- 2015-08-08 Listed $89,900 Global MLS
- 2015-08-08 Listing Removed — Global MLS
- 2015-01-18 Listing Removed — Global MLS
- 2015-01-18 Listed $89,900 Global MLS
- 2014-07-17 Listed $89,900 Global MLS
- 2000-03-24 Sold (Public Records) $53,100 Public Records
- 1999-12-27 Sold (MLS) $23,500 Global MLS
- 1999-12-22 Sold (Public Records) $26,500 Public Records
- 1999-12-16 Listing Removed — Global MLS
- 1999-02-09 Listed $45,900 Global MLS
Property tax history
+10.8%/yrLatest (2025): $3,534 · -0.8% YoY. Source: county tax records.
Cash-flow waterfall
monthlySold comps — $/sqft
last 12 mo · ≤1 miLoading sold comps…