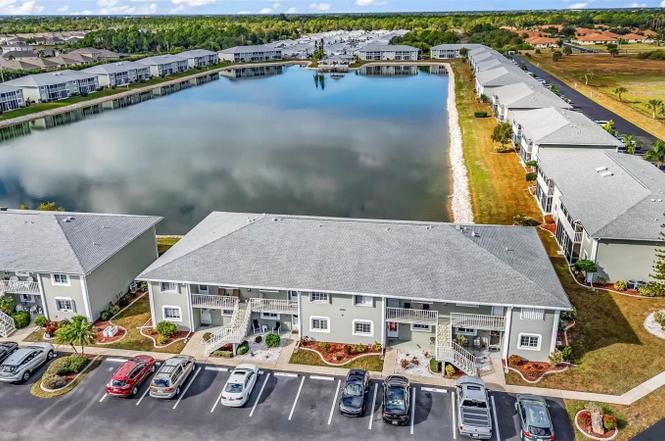
 🌊 Lakefront
3310 Loveland Blvd #1406 · Charlotte Harbor, FL
Flood risk 7/10 · Major
- FEMA flood zone
- X (shaded)
- Chance of flooding over 30 yrs
- 0.75%
- Est. flood insurance / yr
- $507 – $1,088
Fire risk 2/10 · Minimal
- Est. fire insurance / yr
- $947 – $1,759
Heat risk 10/10 · Severe
- Hot days now (above 107°F)
- 7 days/yr
- Hot days in 30 yrs
- 27 days/yr
Wind risk 10/10 · Severe
- Chance of severe wind over 30 yrs
- 99.0%
Air-quality risk 3/10 · Minor
- Unhealthy air days now
- 2 days/yr
- Unhealthy air days in 30 yrs
- 2 days/yr
Risk factors via First Street. Map © Google.
Why this score? — see what drove the C- grade
The composite is a weighted blend of 9 inputs, each scored 0–100. Each bar is that input's sub-score; the figure is the points it added to the 100-point composite (weight × sub-score).
- Cash flow +18.8/30.0
- ARV discount +7.5/15.0
- 1% rule +6.3/10.0
- DSCR +5.9/10.0
- Schools +4.6/10.0
- Livability +3.4/5.0
- Condition / age +2.5/5.0
- Rent growth +1.5/5.0
- Appreciation +0.0/10.0
$174,500
🖨 Deal sheet 📄 Offer letter ✓ Due diligence
Listing remarks
Step into effortless Florida living at Lakes Edge in Port Charlotte. This fully furnished 3 bedroom, 2 bath, second-floor home offers an open layout designed for easy living and seamless entertaining, all with a beautiful lake front view. The spacious living area flows seamlessly into a well-appointed kitchen featuring modern appliances and a cozy dining area—perfect for casual meals or hosting friends. The primary suite delivers privacy and comfort with its own en-suite bath and walk-in closet, while two additional bedrooms adapt easily for guests, remote work, or hobbies. Step outside to your private balcony overlooking the lake and enjoy peaceful water views—ideal for morning
Key facts
- Fishing pier
- Clubhouse
- Private balcony
Tags
Property features AI
Finance
- Other: Furnished; Homestead exempt
- Financial info: Total annual fees $3,640 (total monthly fees approx. $303.33); Lease restrictions apply
- HOA & community: Gateway Management HOA (fees required, quarterly); Quarterly condo fees approximately $303 (approx. $910 quarterly noted); Association fee covers common area taxes, pool, structure maintenance, grounds maintenance, management, pest control, sewer, trash and water; Association approval required; Community clubhouse, pool, park, sidewalks, street lights, community mailbox; Pets allowed (max ~35 lbs)
Exterior
- Parking: Paved access
- Utilities: Public water; Public sewer; Electricity connected; Cable connected; BB/HS internet available; Sewer connected; Water connected
- Home design: Condominium; One-level unit; North-facing
- Construction: Block construction; Shingle roof; Slab foundation; Built as part of a multi-unit building (building number 1400)
- Exterior features: Balcony; Hurricane shutters; Exterior lighting; Sidewalk; Sliding doors; Lake view; Lake access; Fishing pier
Interior
- Kitchen: Dishwasher; Disposal; Microwave; Range; Refrigerator; Electric water heater
- Bedrooms: 3 bedrooms
- Flooring: Ceramic tile; Laminate
- Bathrooms: 2 full bathrooms
- Heating & cooling: Electric heating; Central air conditioning
- Interior features: Ceiling fans; Living room / dining room combo; Walk-in closet(s); Window treatments
- Laundry & utility: Inside laundry; Washer; Dryer
Neighborhood map
What this means for you Summary
Snapshot
- This is a 2-bed/2.0-bath condo listed at $174k.
Deal economics
- At list price, monthly cash flow is $109 ($1k/yr) — positive.
- The deal already cash-flows at list — no discount required.
- Meets the 1% rule at list price ($2k rent vs $174k).
- Recommended offer: $154k (12.0% below list) — sets the bar for market timing.
Location & tenants
- Location reads 68/100 on livability (#536 in FL) — a middle-class / working-renter tenant base. Strengths: cost of living A+, housing A+, crime A-; Watch: employment D+, schools F, amenities F.
- Charlotte (suburban): math 54% / reading 54% proficiency, ranked #22 of 73 in FL (top 30%) — acceptable for families but not a draw, mixed tenant base, ~2y average lease.
- Market conditions: Rents falling (-4.0%/yr); 600 active listings in the ZIP; 12 comparable units currently listed for rent nearby; rentals at typical pace (median 21d on market — plan ~3-4 weeks tenant-placement turnaround); 4,585 units permitted in Charlotte County in 2024 (703 in 5+ unit buildings).
- This rent runs 37% of the median local income ($64k/yr) — at the standard rent-burdened threshold; future hikes will face affordability resistance.
Forward outlook
- Local home prices are declining (-3.0%/yr); year-one equity from $1k of loan paydown is wiped out by about $5k of value loss. Plan a longer hold.
- Charlotte County population projected at +24% by 2050 — long-run rental-demand tailwind backs the buy-and-hold thesis.
Negotiation context
- It's been on market 188 days — a 12% lower offer ($154k) is reasonable based on typical stale-listing flexibility.
- 3 sale attempts since 2y ago; this cycle's ask has dropped $15k (8%) from the opening price — seller is motivated, your offer sets the floor, not the list.
- Current owner paid $58k; list at $174k implies a 198% gain — meaningful room to come down on a strong offer.
Risks & watch-outs
- Watch-outs: flood insurance adds $66/mo.
- Climate carrying-cost: major flood risk; severe wind risk, 99% chance of damaging wind over 30y; extreme-heat days projected 7→27/yr by 2055 (HVAC capex compounding) — expect insurance premiums to compound above CPI over the hold.
Questions for the listing agent
- It's been on market 188 days. Have you received any prior offers? Is the seller open to a 12% concession, seller financing, or rate buy-down credit?
- What's the actual annual flood-insurance premium (NFIP or private), and is the property in a SFHA with mandatory coverage?
- What does the HOA fee cover, when was the last increase, and are there any pending special assessments or reserve-fund shortfalls?
- Any open or pending special assessments — roof, HVAC, plumbing, elevator, façade? What's the per-unit balance and payoff schedule, and is the seller paying it off at close or rolling it to the buyer?
- Why hasn't it sold? Are there any deal-killer items the seller is aware of (foundation, flood, title, zoning, code violations)?
- Is there a deadline driving the sale (1031 exchange, divorce, estate, relocation)? That informs how much negotiation room exists.
- Schools are F-rated, which usually means shorter tenancies and higher turnover. Who's the typical renter profile here, and what's been the actual vacancy rate?
- This sits on a lake — are riparian / water-frontage rights deeded with the parcel? Any dock permits, shoreline easements, or HOA water-use restrictions?
- What's the documented flood / surge / shoreline-erosion history here (FEMA AND non-FEMA — e.g., storm surge, creek backup, septic-field saturation)?
- Any water-quality or seasonal algae-bloom issues that affect tenant satisfaction or short-term-rental demand?
- What's the average days-on-market for RENTAL listings here right now (not sales)? A rising rental-DOM trend means longer vacancies and softer asking-rent achievability than the comps imply.
- What's the recent tenant-quality profile in this submarket — average credit score on applications, eviction rate, late-payment / NSF rate, and stable-employment percentage? A property-management company in the area should have these aggregated.
- How much new apartment / multifamily construction is in the pipeline within 1–3 miles? Heavy new supply (>2% of stock underway) typically softens rents 12–24 months out; light construction supports rent growth.
Investment metrics
- 1% rule
- 1.13% ✓
- Cap rate
- 7.50%
- Cash-on-cash
- 4.32%
- DSCR
- 1.19
- GRM
- 7.4
CMA / ARV
No comps found within radius.
Projected returns pro-forma
-3.0% appreciation · 0.0% rent growth · sell at horizon
- IRR
- -16.0%
- Equity multiple
- 0.45×
- Total profit
- $-26,910
- Equity at exit
- $26,019
- IRR
- -15.6%
- Equity multiple
- 0.26×
- Total profit
- $-36,060
- Equity at exit
- $15,088
Cash invested: $48,860 (down + closing). Projections, not guarantees.
Landlord ↔ Tenant lean methodology
- Overall (STATE)
- 87 Strongly Landlord-Friendly
- State Florida
- 87 Strongly Landlord-Friendly · R+3
- County
- — inherits STATE
- City
- — inherits STATE
ZIP-level market 33980
- Home prices YoY
- -5.0%
- Rents YoY
- -4.0%
- Active inventory
- 600
- Price-to-rent
- 7.4×
Monthly cashflow live
- Estimated rent
- $1,970 high interval (Pro) →
- Mortgage (P&I)
- −$915
- Tax from tax record
- −$90 /mo · $1,080/yr
- Insurance
- −$73
- Flood insurance flood zone
- −$66 /mo · $798/yr
- HOA
- −$303
- Vacancy / Maint / Mgmt
- −$414
- Net cashflow
- $109
Break-even live
UW: 25.0% down · 7.5% · 30yr · 1.5% tax · 5.0% vac · 8.0% maint · 8.0% mgmt
Financing live
Cash to close
- Down payment
- $43,625
- Closing costs
- $5,235
- Reserves months
- —
- Total cash needed
- —
Loan-product check · same deal, 3 products live
Conventional
25% down · 7.5% · 30yr
- Down + closing
- —
- Monthly P&I
- —
- Monthly cashflow
- —
- DSCR
- —
- Eligible?
- —
Personal DTI + credit; lowest rate.
DSCR
20% down · 8.5% · 30yr
- Down + closing
- —
- Monthly P&I
- —
- Monthly cashflow
- —
- DSCR
- —
- Eligible?
- —
No personal income docs; deal must DSCR.
Hard money
10% down · 12.0% · 12mo
- Down + closing
- —
- Monthly P&I
- —
- Monthly cashflow
- —
- DSCR
- —
- Eligible?
- —
Short-term bridge; refi at stabilization.
Rent comps 12 comps
| Address | Beds | Baths | Sqft | Rent | $/sqft | DOM | Units | Dist |
|---|---|---|---|---|---|---|---|---|
| 24145 Green Heron Dr Port Charlotte, FL | 2.0 | 2.0 | 1512 | $1,900 | $1.26 | 21d | 1 | 0.41mi |
| 24055 Peaceful Brook Loop Punta Gorda, FL | 3.0–5.0 | 2.0–3.0 | 2138 | $2,183 | $1.02 | 13d | 4 | 0.48mi |
| 4016 Oakview Dr Unit J9 Punta Gorda, FL | 2.0 | 2.0 | 893 | $2,400 | $2.69 | 21d | 1 | 0.54mi |
| 4024 Oakview Dr Unit I3 Punta Gorda, FL | 2.0 | 2.0 | 893 | $1,900 | $2.13 | 21d | 1 | 0.55mi |
| 4056 Oakview Dr Unit E7 Punta Gorda, FL | 2.0 | 2.0 | 892 | $3,000 | $3.36 | 21d | 1 | 0.63mi |
| 25038 Harborview Rd Unit B Punta Gorda, FL | 2.0 | 2.0 | 1188 | $1,600 | $1.35 | 21d | 1 | 0.86mi |
| 25068 Harbor View Rd Punta Gorda, FL | 2.0 | 2.0 | 956 | $1,500 | $1.57 | 21d | 1 | 0.87mi |
| 24717 Snook Ave Unit 11 D Punta Gorda, FL | 3.0 | 2.0 | 1500 | $2,000 | $1.33 | 21d | 1 | 0.93mi |
| 23465 Harborview Rd Port Charlotte, FL | 2.0 | 2.0 | 1480 | $1,975 | $1.33 | 21d | 2 | 1.27mi |
| 3185 Clifford St Port Charlotte, FL | 3.0 | 2.0 | 1776 | $2,400 | $1.35 | 13d | 1 | 1.36mi |
| 23067 Elmira Blvd Punta Gorda, FL | 2.0 | 2.0 | 1052 | $1,750 | $1.66 | 21d | 1 | 1.39mi |
| 23491 Harper Ave Punta Gorda, FL | 3.0 | 2.0 | 1382 | $1,450 | $1.05 | 21d | 1 | 1.41mi |
HOA detail condo
- Monthly dues
- $303 · $3,636/yr
- Likely covers
- water
- Assessments
- None detected in remarks — confirm with the listing agent.
Listing history 27 events
-
2026-06-18days on market $174,500 Active 188 DOM
-
2026-06-17days on market $174,500 Active 187 DOM
-
2026-06-16days on market $174,500 Active 186 DOM
-
2026-06-15days on market $174,500 Active 185 DOM
-
2026-06-14days on market $174,500 Active 183 DOM
-
2026-06-13days on market $174,500 Active 182 DOM
-
2026-06-10days on market $174,500 Active 180 DOM
-
2026-06-09days on market $174,500 Active 179 DOM
-
2026-06-08days on market $174,500 Active 178 DOM
-
2026-06-05days on market $174,500 Active 174 DOM
-
2026-06-03days on market $174,500 Active 173 DOM
-
2026-06-02days on market $174,500 Active 172 DOM
-
2026-06-01days on market $174,500 Active 171 DOM
-
2026-05-31days on market $174,500 Active 170 DOM
-
2026-05-30days on market $174,500 Active 169 DOM
-
2026-04-09price $174,500
-
2026-02-10price $184,900
-
2025-12-12$189,900 Active
-
2025-12-04historical
-
2025-08-25status Active
-
2025-08-23historical
-
2025-07-02price $214,500
-
2025-03-13price $244,500
-
2024-10-03price $249,700
-
2024-08-23$256,700 Active
-
1995-03-31soldstatus $58,500
-
1991-04-01soldstatus $53,900
ⓘ Source: listings_history table (triggers on properties + properties_extension) + one-shot
backfill from property_details.listing_events for pre-trigger history.
Tax reassessment forecast FL · Resets to sale price
- Current annual tax
- $1,080 · $90/mo
- Projected year-2 tax
- $1,448 · $121/mo
- Expected delta
- +$369/yr (+$31/mo · 34.1%)
ⓘ Screening estimate from a state-policy table — verify with the county assessor before closing.
Climate risk First Street
- Flood 7/10 Severe FEMA zone X (shaded) · 75% chance over 30 yrs
- Wildfire 2/10 Low
- Heat 10/10 Extreme 7 d/yr ≥107°F today · 27 d/yr by 30 yrs out
- Wind 10/10 Extreme 99% chance of damaging wind over 30 yrs
- Air quality 3/10 Moderate 2 unhealthy d/yr today · 2 by 30 yrs out
Nearby sold comps map
Loading sold comps map…
Walkable amenities ~0.75 mi
Loading nearby amenities…
Taxation est. · year 1
- Rental income
- $23,644
- − Mortgage interest
- −$9,775
- − Property taxes
- −$1,080
- − Insurance
- −$1,670
- − Repairs & maintenance
- −$1,892
- − Management
- −$1,892
- − HOA
- −$3,636
- − Depreciation
- −$5,076
- Taxable loss
- −$1,376
- Est. tax savings @ 24.0%
- +$330
- After-tax cash flow
- $1,642/yr
For passive investors: Depreciation is non-cash, so a rental often shows a tax loss while cash-flowing — sheltering income. Rental losses are passive: they offset passive income freely, and up to $25,000/yr can offset ordinary (W-2) income if you actively participate and your MAGI is under $100k (phasing out to $0 by $150k); unused losses carry forward. On sale, claimed depreciation is recaptured at up to 25%, and gains may owe capital-gains tax (a 1031 exchange can defer both). Figures are a year-1 estimate at your 24.0% rate — not tax advice; consult a CPA.
Schools (NCES district)
- District
- Charlotte
- NCES district ID
- 1200240
- Math proficiency
- 54% ▼ -6.00%
- Reading proficiency
- 54% ▼ -1.00%
- Median HH income
- $44,864
- Composite
- 45.62/100
- National rank
- #2586
- State rank
- #22 of 73 in FL
Livability — Charlotte Harbor
- Score
- 68/100
- State rank
- #536
- US rank
- #10043
Category grades
Schools grade is shown separately in the Schools card above.
Census & demographics
- County
- Charlotte County · 196,994 people
- Metro
- Punta Gorda, FL
- Population (ZIP)
- 13,120
- Household income
- $63,591
- Rent vs Own
- Severe rent burden
- 612.0
Population outlook (Charlotte County) Hauer SSP2
- Today (2025)
- 198,646 people
- By 2030
- 210,507 · +6.0%
- By 2040
- 230,857 · +16.2%
- By 2050
- 247,148 · +24.4%
- By 2075
- 281,777 · +41.8%
- By 2100
- 293,609 · +47.8%
Race, ethnicity, and origin ACS 2023
- Neighborhood character
- Predominantly White (75%)
- Race & ethnicity
- White 75% Hispanic / Latino 10% Two or more races 10% Black 9%
- Hispanic origin (detail)
- Puerto Rican 3% Cuban 2% Dominican 2%
- Common ancestry
- Romanian 5% Hispanic 4% Slovak 3%
- Foreign-born
- 16% · Canada, Jamaica
- Languages at home
- 85% English-only · Spanish 8% French/Haitian/Cajun 5% German/W. Germanic 1%
Political lean MEDSL · Charlotte
- 2024 margin
- Solid R (+34.0) · D 32.7% · R 66.7%
- 2008→2024 swing
- -26.7pp toward R · 2008: -7.2pp · 2024: -34.0pp
- All cycles
- 2024: R+34.0 2020: R+26.6 2016: R+27.8 2012: R+14.3 2008: R+7.2
Not yet ingested
- Civics
- —
Market trends
- HPI YoY
- ▼ -16.02%
- Current HPI
- 306.3331
- Rent YoY
- ▼ -4.04%
- Metro
- Punta Gorda, FL
- State GDP YoY
- ▲ 3.28%
- F500 in state
- 36
Industry mix (Fortune 500 HQ in FL)
| Industry | F500 HQs | Revenue |
|---|---|---|
| Industrial Technology | 2 | $29B |
|
||
| Insurance | 2 | $17B |
|
||
| Retail | 1 | $60B |
|
||
| Technology Distribution | 1 | $58B |
|
||
| Homebuilding | 1 | $35B |
|
||
| Technology Manufacturing | 1 | $35B |
|
||
Price history
+223.7% since first listed12 events — show timeline
- 2026-04-09 Price Changed $174,500 Stellar MLS as Distributed by MLS Grid
- 2026-02-10 Price Changed $184,900 Stellar MLS as Distributed by MLS Grid
- 2025-12-12 Listed $189,900 Stellar MLS as Distributed by MLS Grid
- 2025-12-04 Listing Removed — Stellar MLS as Distributed by MLS Grid
- 2025-08-25 Relisted — Stellar MLS as Distributed by MLS Grid
- 2025-08-23 Listing Removed — Stellar MLS as Distributed by MLS Grid
- 2025-07-02 Price Changed $214,500 Stellar MLS as Distributed by MLS Grid
- 2025-03-13 Price Changed $244,500 Stellar MLS as Distributed by MLS Grid
- 2024-10-03 Price Changed $249,700 Stellar MLS as Distributed by MLS Grid
- 2024-08-23 Listed $256,700 Stellar MLS as Distributed by MLS Grid
- 1995-03-31 Sold (Public Records) $58,500 Public Records
- 1991-04-01 Sold (Public Records) $53,900 Public Records
Property tax history
+3.2%/yrLatest (2025): $1,080 · +3.3% YoY. Source: county tax records.
Cash-flow waterfall
monthlySold comps — $/sqft
last 12 mo · ≤1 miLoading sold comps…