 🏷️ Likely Rental
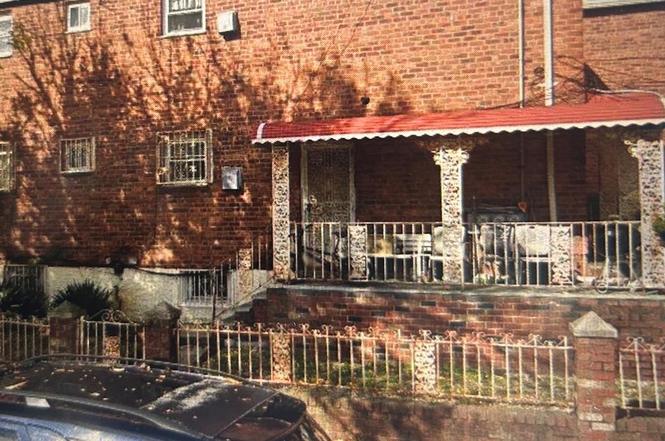
224-20 141st Ave · New York, NY
Flood risk 9/10 · Severe
- FEMA flood zone
- X (unshaded)
- Chance of flooding over 30 yrs
- 0.99%
- Est. flood insurance / yr
- $507 – $1,088
Fire risk 1/10 · Minimal
- Est. fire insurance / yr
- $691 – $1,283
Heat risk 7/10 · Major
- Hot days now (above 97°F)
- 7 days/yr
- Hot days in 30 yrs
- 16 days/yr
Wind risk 6/10 · Moderate
- Chance of severe wind over 30 yrs
- 72.0%
Air-quality risk 4/10 · Minor
- Unhealthy air days now
- 6 days/yr
- Unhealthy air days in 30 yrs
- 6 days/yr
Risk factors via First Street. Map © Google.
Why this score? — see what drove the D+ grade
The composite is a weighted blend of 9 inputs, each scored 0–100. Each bar is that input's sub-score; the figure is the points it added to the 100-point composite (weight × sub-score).
- Cash flow +15.0/30.0
- ARV discount +7.5/15.0
- 1% rule +5.0/10.0
- DSCR +5.0/10.0
- Schools +5.0/10.0
- Livability +3.8/5.0
- Rent growth +2.5/5.0
- Condition / age +2.5/5.0
- Appreciation +0.0/10.0
$630
🖨 Deal sheet 📄 Offer letter ✓ Due diligence
Multi-family units
County records classify this as Multi-Family (2-4 Unit). Listing-text estimate: 1 unit. estimate disagrees with records
Listing remarks
Short sale, sold as is, subject to bank approval
Key facts
- 2,704 sq ft lot
- Built 1955
- Listed 48 days
Neighborhood map
What this means for you Summary
Snapshot
- This is a 4-bed/?-bath multifamily listed at $630.
Deal economics
- At list price, monthly cash flow is $3k ($34k/yr) — positive.
- The deal already cash-flows at list — no discount required.
- Meets the 1% rule at list price ($4k rent vs $630).
- Recommended offer: $611 (3.0% below list) — sets the bar for market timing.
- Cap rate 5485.6% vs local median 2.6% in New York — top-decile yield for the area; either an underpriced asset or a hidden risk that comps aren't pricing in. Stress-test before assuming the spread holds.
Location & tenants
- Location reads 75/100 on livability (#268 in NY, #4,188 nationally) — a middle-class / working-renter tenant base. Strengths: amenities A+, commute A+, health & safety A; Watch: crime F, cost of living F.
- Market conditions: 193 active listings in the ZIP; 29 comparable units currently listed for rent nearby; rentals at typical pace (median 25d on market — plan ~3-4 weeks tenant-placement turnaround); 5,302 units permitted in Queens County in 2024 (4,918 in 5+ unit buildings).
Forward outlook
- Local home prices are declining (-3.0%/yr); year-one equity from $4 of loan paydown is wiped out by about $19 of value loss. Plan a longer hold.
- Queens County population projected at +16% by 2050 — long-run rental-demand tailwind backs the buy-and-hold thesis.
- At projected returns (-3.0% appreciation + 3.0% rent growth), your $176 cash investment doubles in ~1 year — after that, you're playing with house money.
Negotiation context
- It's been on market 48 days — a 3% lower offer ($611) is reasonable based on typical stale-listing flexibility.
- 3 sale attempts since 11y ago; this cycle's ask has dropped $699k (100%) from the opening price — seller is motivated, your offer sets the floor, not the list.
Risks & watch-outs
- Watch-outs: flood insurance adds $66/mo; built in 1955 — expect roof / HVAC / electrical / plumbing capex.
- Climate carrying-cost: severe flood risk; major wind risk, 72% chance of damaging wind over 30y; extreme-heat days projected 7→16/yr by 2055 (HVAC capex compounding) — expect insurance premiums to compound above CPI over the hold.
Questions for the listing agent
- It's been on market 48 days. Have you received any prior offers? Is the seller open to a 3% concession, seller financing, or rate buy-down credit?
- Built in 1955 — when were the roof, HVAC, electrical panel, plumbing, and water heater last replaced?
- What's the actual annual flood-insurance premium (NFIP or private), and is the property in a SFHA with mandatory coverage?
- Is there a deadline driving the sale (1031 exchange, divorce, estate, relocation)? That informs how much negotiation room exists.
- Schools are B-rated — typically a magnet for longer-tenancy family renters. What's the average tenant stay here, and is there a school-zone premium baked into asking?
- Crime grade is F in this area — have there been break-ins, vandalism, or insurance claims at this property in the last 3 years? What carrier currently insures it and at what premium?
- The area grade is low — what's the realistic commute time and amenity access for the typical tenant pool here? Any planned neighborhood developments (good or bad) we should know about?
- What's the average days-on-market for RENTAL listings here right now (not sales)? A rising rental-DOM trend means longer vacancies and softer asking-rent achievability than the comps imply.
- What's the recent tenant-quality profile in this submarket — average credit score on applications, eviction rate, late-payment / NSF rate, and stable-employment percentage? A property-management company in the area should have these aggregated.
- How much new apartment / multifamily construction is in the pipeline within 1–3 miles? Heavy new supply (>2% of stock underway) typically softens rents 12–24 months out; light construction supports rent growth.
Investment metrics
- 1% rule
- 578.86% ✓
- Cap rate
- 5485.61%
- Cash-on-cash
- 19568.99%
- DSCR
- 871.71
- GRM
- 0.0
CMA / ARV
- ARV (on-the-fly)
- $952,128
- Comps found
- 4
Show comp detail 4 sales within ~0.75 mi
| Address | Dist | Beds/Ba | Sqft | Sold | Price | $/sf | Match |
|---|---|---|---|---|---|---|---|
| 14019 183rd St | 0.57mi | 4/2.0 | 1,800 (+4%) | 2mo | $790,000 | $439 | 65 |
| 221-20 137th Ave | 0.37mi | 4/2.0 | 1,544 (-11%) | 2mo | $850,000 | $551 | 64 |
| 22039 136th Ave | 0.50mi | 3/2.0 (-1) | 1,650 (-4%) | 1mo | $940,000 | $570 | 63 |
| 13826 Brookville Blvd | 0.69mi | 5/2.0 (+1) | 1,724 (-0%) | 6mo | $849,000 | $492 | 57 |
Match score weights: distance 35% · size 25% · config 20% · recency 20%. Top-matched comps best support the ARV.
Projected returns pro-forma
-3.0% appreciation · 3.0% rent growth · sell at horizon
- IRR
- —
- Equity multiple
- 1015.60×
- Total profit
- $178,976
- Equity at exit
- $94
- IRR
- —
- Equity multiple
- 2193.21×
- Total profit
- $386,707
- Equity at exit
- $54
Cash invested: $176 (down + closing). Projections, not guarantees.
Landlord ↔ Tenant lean methodology
- Overall (CITY)
- 0 Strongly Tenant-Friendly
- State New York
- 15 Strongly Tenant-Friendly · D+10
- County
- — inherits STATE
- City New York
- 0 Strongly Tenant-Friendly · D+34
ZIP-level market 11413
- Active inventory
- 193
Monthly cashflow live
- Estimated rent
- $3,647 high interval (Pro) →
- Mortgage (P&I)
- −$3
- Tax est. 1.5%
- −$1 /mo · $9/yr
- Insurance
- −$0
- Flood insurance flood zone
- −$66 /mo · $798/yr
- HOA
- −$0
- Vacancy / Maint / Mgmt
- −$766
- Net cashflow
- $2,810
Break-even live
UW: 25.0% down · 7.5% · 30yr · 1.5% tax · 5.0% vac · 8.0% maint · 8.0% mgmt
Financing live
Cash to close
- Down payment
- $158
- Closing costs
- $19
- Reserves months
- —
- Total cash needed
- —
Loan-product check · same deal, 3 products live
Conventional
25% down · 7.5% · 30yr
- Down + closing
- —
- Monthly P&I
- —
- Monthly cashflow
- —
- DSCR
- —
- Eligible?
- —
Personal DTI + credit; lowest rate.
DSCR
20% down · 8.5% · 30yr
- Down + closing
- —
- Monthly P&I
- —
- Monthly cashflow
- —
- DSCR
- —
- Eligible?
- —
No personal income docs; deal must DSCR.
Hard money
10% down · 12.0% · 12mo
- Down + closing
- —
- Monthly P&I
- —
- Monthly cashflow
- —
- DSCR
- —
- Eligible?
- —
Short-term bridge; refi at stabilization.
Rent comps 29 comps
| Address | Beds | Baths | Sqft | Rent | $/sqft | DOM | Units | Dist |
|---|---|---|---|---|---|---|---|---|
| 138-26 223rd St #1 Jamaica, NY | 4.0 | 1.0 | 2085 | $4,000 | $1.92 | 24d | 1 | 0.24mi |
| 219-16 141st Ave Unit 2 Jamaica, NY | 4.0 | 2.0 | 1050 | $4,400 | $4.19 | 24d | 1 | 0.25mi |
| 228-20 Edgewood Ave Unit A Jamaica, NY | 3.0 | 2.0 | 2208 | $3,200 | $1.45 | 24d | 1 | 0.27mi |
| 144-35 224th St Unit First Floor Jamaica, NY | 3.0 | 2.0 | 1970 | $3,800 | $1.93 | 24d | 1 | 0.42mi |
| 230-38 144th Ave Unit 1st Floor Jamaica, NY | 3.0 | 1.0 | 1922 | $3,400 | $1.77 | 24d | 1 | 0.47mi |
| 13525 223rd St Laurelton, NY | 3.0 | 2.0 | 1200 | $3,400 | $2.83 | 24d | 1 | 0.49mi |
| 14519 220th St Springfield Gardens, NY | 3.0 | 2.0 | 1200 | $3,800 | $3.17 | 24d | 1 | 0.56mi |
| 14547 224th St Springfield Gardens, NY | 3.0 | 1.0 | 1880 | $3,500 | $1.86 | 24d | 1 | 0.57mi |
| 231-10 145th Ave Unit ONE Jamaica, NY | 3.0 | 1.0 | 1872 | $3,750 | $2.00 | 22d | 1 | 0.60mi |
| 14578 226th St Springfield Gardens, NY | 3.0 | 1.5 | 2100 | $3,600 | $1.71 | 24d | 1 | 0.63mi |
| 13719 Southgate St Springfield Gardens, NY | 3.0 | 1.0 | 1672 | $3,400 | $2.03 | 24d | 1 | 0.64mi |
| 21707 134th Rd Springfield Gardens, NY | 3.0 | 1.0 | 1848 | $3,800 | $2.06 | 14d | 1 | 0.71mi |
| 18021 140th Ave Jamaica, NY | 3.0 | 2.0 | 2102 | $3,800 | $1.81 | 24d | 1 | 0.71mi |
| 14720 226th St Springfield Gardens, NY | 3.0 | 2.0 | 1100 | $3,300 | $3.00 | 20d | 1 | 0.82mi |
| 179-12 145th Ave Unit 1 Jamaica, NY | 3.0 | 1.0 | 2080 | $3,500 | $1.68 | 2d | 1 | 0.83mi |
| 179-12 145th Ave Unit 2 Jamaica, NY | 3.0 | 1.0 | 2080 | $3,500 | $1.68 | 24d | 1 | 0.83mi |
| 147-29 Springfield Ln Unit 1 Jamaica, NY | 3.0 | 2.0 | 1980 | $3,500 | $1.77 | 17d | 1 | 0.89mi |
| 14019 247th St Rosedale, NY | 3.0 | 2.0 | 2058 | $4,100 | $1.99 | 1d | 1 | 0.90mi |
| 147-36 Springfield Ln Unit 1 Springfield Gardens, NY | 3.0 | 2.0 | 1750 | $3,500 | $2.00 | 24d | 1 | 0.91mi |
| 176-34 133rd Ave Unit 2nd Floor Jamaica, NY | 4.0 | 2.0 | 2244 | $3,500 | $1.56 | 24d | 1 | 0.94mi |
| 170-16 143rd Rd Unit 2 Jamaica, NY | 3.0 | 2.0 | 1125 | $3,600 | $3.20 | 24d | 1 | 1.02mi |
| 248-13 139th Ave Unit 2F Jamaica, NY | 4.0 | 2.0 | 1500 | $4,000 | $2.67 | 5d | 1 | 1.04mi |
| 249-17 147th Rd Unit 1 Jamaica, NY | 3.0 | 2.0 | 2000 | $4,400 | $2.20 | 1d | 1 | 1.05mi |
| 249-10 139th Ave Unit 1 Jamaica, NY | 4.0 | 2.0 | 1500 | $4,600 | $3.07 | 18d | 1 | 1.06mi |
| 238-23 148th Dr Unit 1st Floor Jamaica, NY | 3.0 | 1.5 | 1435 | $3,500 | $2.44 | 19d | 1 | 1.10mi |
| 245-09 148th Rd Unit 2 Jamaica, NY | 3.0 | 2.0 | 2086 | $3,373 | $1.62 | 22d | 1 | 1.13mi |
| 12054 194th St Saint Albans, NY | 3.0 | 1.0 | 1099 | $3,200 | $2.91 | 24d | 1 | 1.27mi |
| 167-11 144th Dr Unit 2nd Floor Jamaica, NY | 3.0 | 1.0 | 2016 | $3,850 | $1.91 | 24d | 1 | 1.37mi |
| 12606 172nd St Jamaica, NY | 3.0 | 2.0 | 1050 | $3,200 | $3.05 | 19d | 1 | 1.41mi |
Listing history 12 events
-
2025-12-26status Pending
-
2025-11-28price $630
-
2025-11-08$700,000 Active
-
2020-08-11historical
-
2020-03-26status Pending
-
2019-12-12historical
-
2019-12-11status Pending Bank Approval (Short Sale)
-
2019-10-09$450,000 New
-
2016-03-04historical
-
2015-04-08$379,990
-
2004-08-19soldstatus $520,000
-
1997-12-23soldstatus $205,000
ⓘ Source: listings_history table (triggers on properties + properties_extension) + one-shot
backfill from property_details.listing_events for pre-trigger history.
Climate risk First Street
- Flood 9/10 Extreme FEMA zone X (unshaded) · 99% chance over 30 yrs
- Wildfire 1/10 Low
- Heat 7/10 Severe 7 d/yr ≥97°F today · 16 d/yr by 30 yrs out
- Wind 6/10 Major 72% chance of damaging wind over 30 yrs
- Air quality 4/10 Moderate 6 unhealthy d/yr today · 6 by 30 yrs out
Nearby sold comps map
Loading sold comps map…
Walkable amenities ~0.75 mi
Loading nearby amenities…
Taxation est. · year 1
- Rental income
- $43,762
- − Mortgage interest
- −$35
- − Property taxes
- −$9
- − Insurance
- −$801
- − Repairs & maintenance
- −$3,501
- − Management
- −$3,501
- − Depreciation
- −$18
- Taxable income
- $35,896
- Est. tax owed @ 24.0%
- −$8,615
- After-tax cash flow
- $25,107/yr
For passive investors: Depreciation is non-cash, so a rental often shows a tax loss while cash-flowing — sheltering income. Rental losses are passive: they offset passive income freely, and up to $25,000/yr can offset ordinary (W-2) income if you actively participate and your MAGI is under $100k (phasing out to $0 by $150k); unused losses carry forward. On sale, claimed depreciation is recaptured at up to 25%, and gains may owe capital-gains tax (a 1031 exchange can defer both). Figures are a year-1 estimate at your 24.0% rate — not tax advice; consult a CPA.
Schools (NCES district)
No district data.
Livability — New York
- Score
- 75/100
- State rank
- #268
- US rank
- #4188
Category grades
Schools grade is shown separately in the Schools card above.
Census & demographics
- Census place
- New York, NY
- City population
- 7,731,280
- Population (ZIP)
- 45,072
Population outlook (Queens County) Hauer SSP2
- Today (2025)
- 2,546,320 people
- By 2030
- 2,643,059 · +3.8%
- By 2040
- 2,815,563 · +10.6%
- By 2050
- 2,944,423 · +15.6%
- By 2075
- 3,123,338 · +22.7%
- By 2100
- 3,098,688 · +21.7%
Race, ethnicity, and origin ACS 2023
- Neighborhood character
- Predominantly Black (84%)
- Race & ethnicity
- Black 84% Hispanic / Latino 9% Two or more races 4% Asian 2% White 1%
- Hispanic origin (detail)
- Puerto Rican 3% Dominican 3%
- Common ancestry
- Hispanic 6%
- Foreign-born
- 39% · Canada, Mexico
- Languages at home
- 84% English-only · French/Haitian/Cajun 7% Spanish 6% Other Indo-European 1%
Political lean MEDSL · Queens
- 2024 margin
- Strong D (+24.6) · D 62.3% · R 37.7%
- 2008→2024 swing
- -26.2pp toward R · 2008: 50.8pp · 2024: 24.6pp
- All cycles
- 2024: D+24.6 2020: D+45.2 2016: D+53.4 2012: D+58.5 2008: D+50.8
Not yet ingested
- Civics
- —
Market trends
- HPI YoY
- ▼ -390.89%
- Current HPI
- 311.5327
- Rent YoY
- —
- Metro
- —
- State GDP YoY
- ▲ 2.60%
- F500 in state
- 92
Industry mix (Fortune 500 HQ in NY)
| Industry | F500 HQs | Revenue |
|---|---|---|
| Financial Services | 10 | $950B |
|
||
| Consumer Goods | 9 | $162B |
|
||
| Insurance | 4 | $225B |
|
||
| Telecommunications | 2 | $144B |
|
||
| Pharmaceuticals | 2 | $112B |
|
||
| Media / Entertainment | 2 | $69B |
|
||
Price history
+241.5% since first listed12 events — show timeline
- 2025-12-26 Pending — OneKey® MLS as Distributed by MLS Grid
- 2025-11-28 Price Changed $630 OneKey® MLS as Distributed by MLS Grid
- 2025-11-08 Listed $700,000 OneKey® MLS as Distributed by MLS Grid
- 2020-08-11 Listing Removed — OneKey® MLS as Distributed by MLS Grid
- 2020-03-26 Pending — OneKey® MLS as Distributed by MLS Grid
- 2019-12-12 Listing Removed — OneKey® MLS as Distributed by MLS Grid
- 2019-12-11 Pending — OneKey® MLS as Distributed by MLS Grid
- 2019-10-09 Listed $450,000 OneKey® MLS as Distributed by MLS Grid
- 2016-03-04 Listing Removed — OneKey® MLS as Distributed by MLS Grid
- 2015-04-08 Listed $379,990 OneKey® MLS as Distributed by MLS Grid
- 2004-08-19 Sold (Public Records) $520,000 Public Records
- 1997-12-23 Sold (Public Records) $205,000 Public Records
Property tax history
+5.9%/yrLatest (2025): $7,804 · +2.2% YoY. Source: county tax records.
Cash-flow waterfall
monthlySold comps — $/sqft
last 12 mo · ≤1 miLoading sold comps…