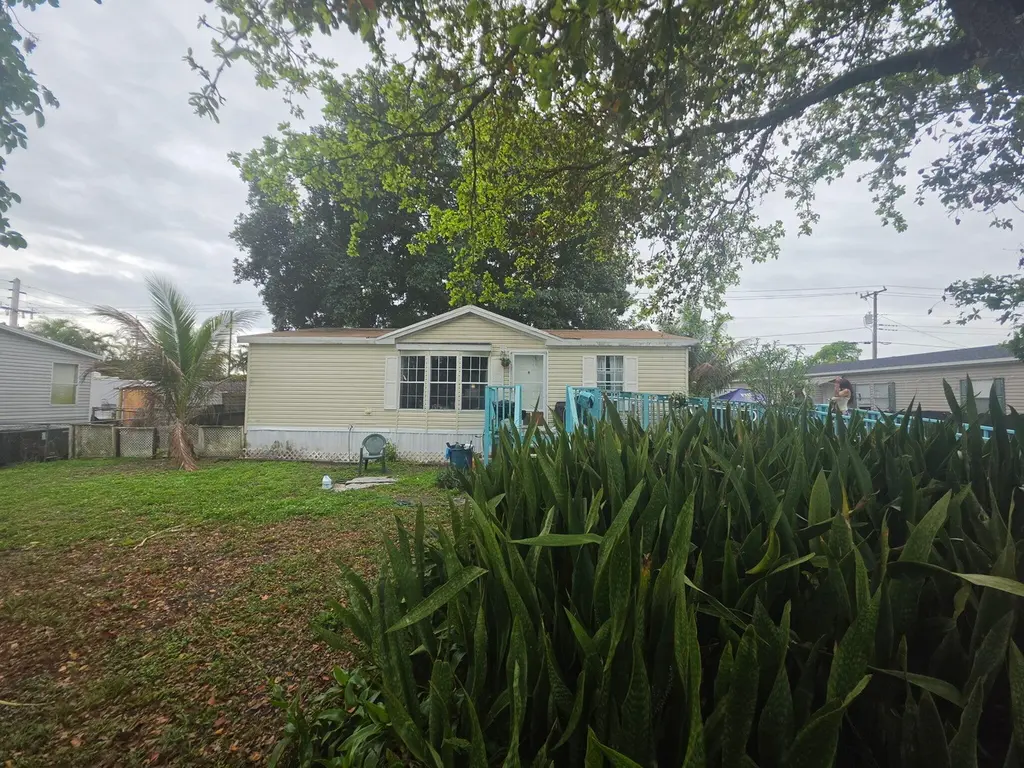
13310 SW 6th Ct · Davie, FL
Flood risk 1/10 · Minimal
- FEMA flood zone
- X (shaded)
- Chance of flooding over 30 yrs
- 0.0%
- Est. flood insurance / yr
- $507 – $1,088
Fire risk 1/10 · Minimal
- Est. fire insurance / yr
- $947 – $1,759
Heat risk 10/10 · Severe
- Hot days now (above 106°F)
- 7 days/yr
- Hot days in 30 yrs
- 28 days/yr
Wind risk 10/10 · Severe
- Chance of severe wind over 30 yrs
- 99.0%
Air-quality risk 3/10 · Minor
- Unhealthy air days now
- 2 days/yr
- Unhealthy air days in 30 yrs
- 3 days/yr
Risk factors via First Street. Map © Google.
Why this score? — see what drove the C grade
The composite is a weighted blend of 9 inputs, each scored 0–100. Each bar is that input's sub-score; the figure is the points it added to the 100-point composite (weight × sub-score).
- Cash flow +22.1/30.0
- ARV discount +7.5/15.0
- DSCR +7.1/10.0
- 1% rule +7.0/10.0
- Schools +4.1/10.0
- Livability +4.1/5.0
- Condition / age +2.5/5.0
- Rent growth +2.3/5.0
- Appreciation +0.0/10.0
$230,000
🖨 Deal sheet 📄 Offer letter ✓ Due diligence
Listing remarks
Huge Price Reduction!! The seller is extremely motivated. All reasonable offers will be considered. Opportunity awaits on this large lot in Davie. The current home is in need of TLC, making it ideal for investors, renovators, or those looking to place a new manufactured home of their choice. No HOA and no lot rent, FULL land ownership. Located near great schools with strong rental potential. Cash Only Offers, please.
Key facts
- Full land ownership
- Large lot
- No hoa
Tags
Property features AI
Finance
- Other: Living area approximately 1,113 (public records); Stories: 1
Exterior
- Parking: 2 parking spaces; No carport
- Utilities: Public water; Septic tank; Electricity available; Water available
- Home design: Single-story mobile home; Faces northwest; Resale condition
- Construction: Vinyl siding; Shingle roof; Other roof material
- Exterior features: Not waterfront
Interior
- Kitchen: Electric range; Refrigerator
- Bedrooms: 2 bedrooms on the main level
- Flooring: Other flooring
- Bathrooms: 2 full bathrooms (main level)
- Heating & cooling: Central air
- Interior features: Central air conditioning; In-unit laundry
- Laundry & utility: Laundry inside the unit
Neighborhood map
What this means for you Summary
Snapshot
- This is a 2-bed/2.0-bath manufactured listed at $230k.
Deal economics
- At list price, monthly cash flow is $370 ($4k/yr) — positive.
- The deal already cash-flows at list — no discount required.
- Meets the 1% rule at list price ($3k rent vs $230k).
- Recommended offer: $227k (1.5% below list) — sets the bar for market timing.
- Cap rate 8.2% vs local median 3.4% in Davie — top-decile yield for the area; either an underpriced asset or a hidden risk that comps aren't pricing in. Stress-test before assuming the spread holds.
Location & tenants
- Location reads 82/100 on livability (#68 in FL, #1,159 nationally) — a professional / high-income tenant draw. Strengths: schools A+, crime A+, housing A+; Watch: cost of living D, amenities D-.
- Broward (suburban): math 42% / reading 53% proficiency, ranked #46 of 73 in FL (top 63%) — families likely to look elsewhere, expect single-tenant / working-renter base with shorter leases.
- Market conditions: Rents soft (-0.9%/yr); 176 active listings in the ZIP; 40 comparable units currently listed for rent nearby; rentals at typical pace (median 17d on market — plan ~3-4 weeks tenant-placement turnaround); solid renter incomes; 2,111 units permitted in Broward County in 2024 (1,265 in 5+ unit buildings).
- This rent runs 33% of the median local income ($101k/yr) — at the standard rent-burdened threshold; future hikes will face affordability resistance.
Forward outlook
- Local home prices are declining (-3.0%/yr); year-one equity from $2k of loan paydown is wiped out by about $7k of value loss. Plan a longer hold.
- Broward County population projected at +34% by 2050 — long-run rental-demand tailwind backs the buy-and-hold thesis.
Negotiation context
- It's been on market 30 days — a 2% lower offer ($227k) is reasonable based on typical stale-listing flexibility.
- 2 sale attempts; this cycle's ask has dropped $45k (16%) from the opening price — seller is motivated, your offer sets the floor, not the list.
- Current owner paid $29k; list at $230k implies a 693% gain — meaningful room to come down on a strong offer.
Risks & watch-outs
- Watch-outs: property tax is 2.7% of price.
- Climate carrying-cost: severe wind risk, 99% chance of damaging wind over 30y; extreme-heat days projected 7→28/yr by 2055 (HVAC capex compounding) — expect insurance premiums to compound above CPI over the hold.
Questions for the listing agent
- Property tax is high relative to price — has the assessment been appealed recently, and will the sale trigger a re-assessment?
- Is there a deadline driving the sale (1031 exchange, divorce, estate, relocation)? That informs how much negotiation room exists.
- Schools are A-rated — typically a magnet for longer-tenancy family renters. What's the average tenant stay here, and is there a school-zone premium baked into asking?
- What's the average days-on-market for RENTAL listings here right now (not sales)? A rising rental-DOM trend means longer vacancies and softer asking-rent achievability than the comps imply.
- What's the recent tenant-quality profile in this submarket — average credit score on applications, eviction rate, late-payment / NSF rate, and stable-employment percentage? A property-management company in the area should have these aggregated.
- How much new for-sale + rental construction is in the pipeline within 1–3 miles? Heavy new supply typically softens prices + rents 12–24 months out; constrained supply supports both.
Investment metrics
- 1% rule
- 1.20% ✓
- Cap rate
- 8.22%
- Cash-on-cash
- 6.90%
- DSCR
- 1.31
- GRM
- 6.9
CMA / ARV
No comps found within radius.
Projected returns pro-forma
-3.0% appreciation · 0.0% rent growth · sell at horizon
- IRR
- -9.5%
- Equity multiple
- 0.66×
- Total profit
- $-21,602
- Equity at exit
- $34,294
- IRR
- -5.3%
- Equity multiple
- 0.70×
- Total profit
- $-19,001
- Equity at exit
- $19,886
Cash invested: $64,400 (down + closing). Projections, not guarantees.
Landlord ↔ Tenant lean methodology
- Overall (STATE)
- 87 Strongly Landlord-Friendly
- State Florida
- 87 Strongly Landlord-Friendly · R+3
- County
- — inherits STATE
- City
- — inherits STATE
ZIP-level market 33325
- Rents YoY
- -0.9%
- Active inventory
- 176
- Price-to-rent
- 6.9×
Monthly cashflow live
- Estimated rent
- $2,762 high interval (Pro) →
- Mortgage (P&I)
- −$1,206
- Tax from tax record
- −$510 /mo · $6,119/yr
- Insurance
- −$96
- HOA
- −$0
- Vacancy / Maint / Mgmt
- −$580
- Net cashflow
- $370
Break-even live
UW: 25.0% down · 7.5% · 30yr · 1.5% tax · 5.0% vac · 8.0% maint · 8.0% mgmt
Financing live
Cash to close
- Down payment
- $57,500
- Closing costs
- $6,900
- Reserves months
- —
- Total cash needed
- —
Loan-product check · same deal, 3 products live
Conventional
25% down · 7.5% · 30yr
- Down + closing
- —
- Monthly P&I
- —
- Monthly cashflow
- —
- DSCR
- —
- Eligible?
- —
Personal DTI + credit; lowest rate.
DSCR
20% down · 8.5% · 30yr
- Down + closing
- —
- Monthly P&I
- —
- Monthly cashflow
- —
- DSCR
- —
- Eligible?
- —
No personal income docs; deal must DSCR.
Hard money
10% down · 12.0% · 12mo
- Down + closing
- —
- Monthly P&I
- —
- Monthly cashflow
- —
- DSCR
- —
- Eligible?
- —
Short-term bridge; refi at stabilization.
Rent comps 40 comps
| Address | Beds | Baths | Sqft | Rent | $/sqft | DOM | Units | Dist |
|---|---|---|---|---|---|---|---|---|
| 13761 Newport Mnr Davie, FL | 3.0 | 2.0 | 1249 | $3,500 | $2.80 | 24d | 1 | 0.36mi |
| 651 Shiloh Ter Unit 651 Davie, FL | 3.0 | 2.0 | 1249 | $4,700 | $3.76 | 24d | 1 | 0.38mi |
| 118 Riverwalk Cir Sunrise, FL | 3.0 | 2.5 | 1447 | $3,100 | $2.14 | 24d | 1 | 0.57mi |
| 14025 Langley Pl Davie, FL | 3.0 | 2.0 | 1360 | $3,250 | $2.39 | 12d | 1 | 0.67mi |
| 14025 Langley Pl Davie, FL | 3.0 | 2.0 | 1360 | $3,250 | $2.39 | 14d | 1 | 0.67mi |
| 200 Commodore Dr Plantation, FL | 2.0 | 2.0 | 1078 | $2,743 | $2.54 | 22d | 1 | 0.73mi |
| 200 Commodore Dr Plantation, FL | 3.0 | 2.0 | 1124 | $3,014 | $2.68 | 24d | 1 | 0.73mi |
| 200 Commodore Dr Plantation, FL | 3.0 | 2.0 | 1124 | $2,913 | $2.59 | 20d | 1 | 0.73mi |
| 13500 NW 3rd St Plantation, FL | 1.0–3.0 | 1.0–2.5 | 1099 | $3,013 | $2.74 | 2d | 21 | 0.78mi |
| 400 Commodore Dr #308 Plantation, FL | 2.0 | 2.5 | 1296 | $2,400 | $1.85 | 5d | 1 | 0.86mi |
| 1631 SW 129th Way Davie, FL | 3.0 | 2.0 | 1189 | $3,700 | $3.11 | 5d | 1 | 0.89mi |
| 430 Commodore Dr #210 Plantation, FL | 2.0 | 2.0 | 1130 | $2,100 | $1.86 | 24d | 1 | 0.91mi |
| 430 Commodore Dr Unit 430 Plantation, FL | 2.0 | 2.5 | 1296 | $2,400 | $1.85 | 5d | 1 | 0.91mi |
| 13755 SW 20th St Davie, FL | 2.0 | 2.0 | 864 | $2,500 | $2.89 | 24d | 1 | 1.13mi |
| 701 SW 148th Ave Davie, FL | 3.0 | 3.0 | 1285 | $2,500 | $1.95 | 24d | 1 | 1.24mi |
| 705 SW 148th Ave #213 Davie, FL | 3.0 | 3.0 | 1409 | $2,300 | $1.63 | 16d | 1 | 1.24mi |
| 781 SW 148th Ave Davie, FL | 3.0 | 3.0 | 1285 | $2,675 | $2.08 | 24d | 2 | 1.24mi |
| 781 SW 148th Ave Davie, FL | 1.0–3.0 | 1.0–3.0 | 1176 | $2,500 | $2.12 | 15d | 3 | 1.24mi |
| 785 SW 148th Ave #1406 Davie, FL | 3.0 | 3.0 | 1285 | $2,550 | $1.98 | 24d | 1 | 1.24mi |
| 735 SW 148th Ave Davie, FL | 3.0 | 3.0 | 1285 | $2,575 | $2.00 | 24d | 2 | 1.25mi |
| 721 SW 148th Ave Davie, FL | 2.0 | 2.0–3.0 | 1138 | $2,700 | $2.37 | 24d | 2 | 1.25mi |
| 741 SW 148th Ave Davie, FL | 2.0 | 2.0 | 1064 | $2,348 | $2.21 | 5d | 2 | 1.27mi |
| 741 SW 148th Ave Davie, FL | 2.0 | 2.0 | 1064 | $2,348 | $2.21 | 10d | 2 | 1.27mi |
| 741 SW 148th Ave #705 Davie, FL | 2.0 | 2.0 | 1064 | $2,395 | $2.25 | 5d | 1 | 1.27mi |
| 761 SW 148th Ave #915 Davie, FL | 2.0 | 2.0 | 1034 | $2,490 | $2.41 | 18d | 1 | 1.27mi |
| 761 SW 148th Ave #915 Davie, FL | 2.0 | 2.0 | 1034 | $2,380 | $2.30 | 17d | 1 | 1.27mi |
| 711 SW 148th Ave Davie, FL | 3.0 | 3.0 | 1347 | $2,750 | $2.04 | 14d | 3 | 1.28mi |
| 711 SW 148th Ave Davie, FL | 3.0 | 3.0 | 1347 | $2,720 | $2.02 | 7d | 2 | 1.28mi |
| 771 SW 148th Ave #1305 Davie, FL | 2.0 | 1.0 | 1068 | $2,250 | $2.11 | 2d | 1 | 1.28mi |
| 715 SW 148th Ave #611 Davie, FL | 2.0 | 1.0 | 1068 | $2,250 | $2.11 | 7d | 1 | 1.28mi |
| 715 SW 148th Ave #611 Davie, FL | 2.0 | 1.0 | 1068 | $2,250 | $2.11 | 12d | 1 | 1.28mi |
| 745 SW 148th Ave #815 Davie, FL | 2.0 | 2.0 | 1034 | $2,425 | $2.35 | 24d | 1 | 1.30mi |
| 751 SW 148th Ave Davie, FL | 2.0–3.0 | 2.0–3.0 | 1123 | $2,450 | $2.18 | 24d | 3 | 1.32mi |
| 13060 Vista Isles Dr #222 Plantation, FL | 2.0 | 1.0 | 965 | $2,100 | $2.18 | 7d | 1 | 1.33mi |
| 12980 Vista Isles Dr #315 Plantation, FL | 1.0 | 1.0 | 743 | $1,850 | $2.49 | 14d | 1 | 1.37mi |
| 595 Vista Isles Dr #1925 Plantation, FL | 2.0 | 1.0 | 965 | $2,195 | $2.27 | 18d | 1 | 1.38mi |
| 12950 Vista Isles Dr #421 Plantation, FL | 2.0 | 2.0 | 1105 | $2,300 | $2.08 | 24d | 1 | 1.42mi |
| 663 Vista Isles Dr #1711 Plantation, FL | 2.0 | 2.0 | 1105 | $2,350 | $2.13 | 7d | 1 | 1.42mi |
| 12840 Vista Isles Dr Plantation, FL | 2.0 | 1.0 | 965 | $2,100 | $2.18 | 7d | 2 | 1.44mi |
| 12620 Vista Isles Dr #1013 Plantation, FL | 1.0 | 1.0 | 743 | $1,850 | $2.49 | 7d | 1 | 1.44mi |
Listing history 8 events
-
2026-05-20status Pending
-
2026-05-18status Active
-
2026-04-17status Pending
-
2026-04-08price $230,000
-
2026-04-06price $250,000
-
2026-04-01price $260,000
-
2026-03-17$275,000 Active
-
1986-11-01soldstatus $29,000
ⓘ Source: listings_history table (triggers on properties + properties_extension) + one-shot
backfill from property_details.listing_events for pre-trigger history.
Tax reassessment forecast FL · Resets to sale price
- Current annual tax
- $6,119 · $510/mo
- Projected year-2 tax
- $6,119 · $510/mo
- Expected delta
- $0/yr ($0/mo · 0.0%)
ⓘ Screening estimate from a state-policy table — verify with the county assessor before closing.
Climate risk First Street
- Flood 1/10 Low FEMA zone X (shaded) · 0% chance over 30 yrs
- Wildfire 1/10 Low
- Heat 10/10 Extreme 7 d/yr ≥106°F today · 28 d/yr by 30 yrs out
- Wind 10/10 Extreme 99% chance of damaging wind over 30 yrs
- Air quality 3/10 Moderate 2 unhealthy d/yr today · 3 by 30 yrs out
Nearby sold comps map
Loading sold comps map…
Walkable amenities ~0.75 mi
Loading nearby amenities…
Taxation est. · year 1
- Rental income
- $33,147
- − Mortgage interest
- −$12,884
- − Property taxes
- −$6,119
- − Insurance
- −$1,150
- − Repairs & maintenance
- −$2,652
- − Management
- −$2,652
- − Depreciation
- −$6,691
- Taxable income
- $1,000
- Est. tax owed @ 24.0%
- −$240
- After-tax cash flow
- $4,204/yr
For passive investors: Depreciation is non-cash, so a rental often shows a tax loss while cash-flowing — sheltering income. Rental losses are passive: they offset passive income freely, and up to $25,000/yr can offset ordinary (W-2) income if you actively participate and your MAGI is under $100k (phasing out to $0 by $150k); unused losses carry forward. On sale, claimed depreciation is recaptured at up to 25%, and gains may owe capital-gains tax (a 1031 exchange can defer both). Figures are a year-1 estimate at your 24.0% rate — not tax advice; consult a CPA.
Schools (NCES district)
- District
- Broward
- NCES district ID
- 1200180
- Math proficiency
- 42% ▼ -18.00%
- Reading proficiency
- 53% ▼ -5.00%
- Median HH income
- $52,139
- Composite
- 40.88/100
- National rank
- #3621
- State rank
- #46 of 73 in FL
Livability — Davie
- Score
- 82/100
- State rank
- #68
- US rank
- #1159
Category grades
Schools grade is shown separately in the Schools card above.
Census & demographics
- Census place
- Davie, FL
- County
- Broward County · 1,963,430 people
- City population
- 92,317
- Metro
- Miami-Fort Lauderdale-Pompano Beach, FL
- Population (ZIP)
- 32,399
- Household income
- $100,553
- Rent vs Own
- Severe rent burden
- 924.0
Population outlook (Broward County) Hauer SSP2
- Today (2025)
- 2,207,033 people
- By 2030
- 2,360,704 · +7.0%
- By 2040
- 2,661,208 · +20.6%
- By 2050
- 2,946,698 · +33.5%
- By 2075
- 3,602,273 · +63.2%
- By 2100
- 3,970,984 · +79.9%
Race, ethnicity, and origin ACS 2023
- Neighborhood character
- Diverse neighborhood (Simpson 0.62)
- Race & ethnicity
- Hispanic / Latino 51% White 33% Two or more races 31% Black 6% Asian 3%
- Hispanic origin (detail)
- Mexican 3% Puerto Rican 8% Cuban 9% Dominican 1% Salvadoran 1%
- Common ancestry
- Italian 3% Romanian 1% Scotch-Irish 1%
- Foreign-born
- 35% · Canada, Jamaica, Dominican Republic
- Languages at home
- 49% English-only · Spanish 46% Other Indo-European 2% French/Haitian/Cajun 2%
Political lean MEDSL · Broward
- 2024 margin
- D (+17.0) · D 58.0% · R 41.0%
- 2008→2024 swing
- -17.8pp toward R · 2008: 34.7pp · 2024: 17.0pp
- All cycles
- 2024: D+17.0 2020: D+29.8 2016: D+35.0 2012: D+34.9 2008: D+34.7
Not yet ingested
- Civics
- —
Market trends
- HPI YoY
- ▼ -437.64%
- Current HPI
- 385.1467
- Rent YoY
- ▼ -0.88%
- Metro
- Miami-Fort Lauderdale-Pompano Beach, FL
- State GDP YoY
- ▲ 3.28%
- F500 in state
- 36
Industry mix (Fortune 500 HQ in FL)
| Industry | F500 HQs | Revenue |
|---|---|---|
| Industrial Technology | 2 | $29B |
|
||
| Insurance | 2 | $17B |
|
||
| Retail | 1 | $60B |
|
||
| Technology Distribution | 1 | $58B |
|
||
| Homebuilding | 1 | $35B |
|
||
| Technology Manufacturing | 1 | $35B |
|
||
Price history
+693.1% since first listed8 events — show timeline
- 2026-05-20 Pending — Beaches MLS
- 2026-05-18 Relisted — Beaches MLS
- 2026-04-17 Pending — Beaches MLS
- 2026-04-08 Price Changed $230,000 Beaches MLS
- 2026-04-06 Price Changed $250,000 Beaches MLS
- 2026-04-01 Price Changed $260,000 Beaches MLS
- 2026-03-17 Listed $275,000 Beaches MLS
- 1986-11-01 Sold (Public Records) $29,000 Public Records
Property tax history
+16.6%/yrLatest (2025): $6,119 · +0.1% YoY. Source: county tax records.
Cash-flow waterfall
monthlySold comps — $/sqft
last 12 mo · ≤1 miLoading sold comps…