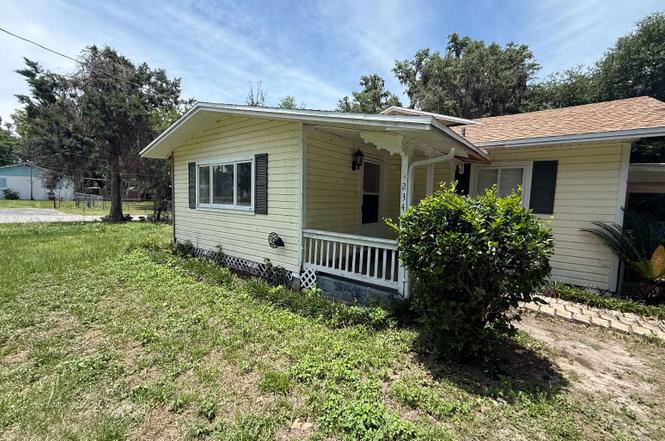
234 SE James Ave · Watertown, FL
Flood risk 1/10 · Minimal
- FEMA flood zone
- X (unshaded)
- Chance of flooding over 30 yrs
- 0.0%
- Est. flood insurance / yr
- $507 – $1,088
Fire risk 5/10 · Moderate
- Est. fire insurance / yr
- $947 – $1,759
Heat risk 8/10 · Major
- Hot days now (above 107°F)
- 7 days/yr
- Hot days in 30 yrs
- 20 days/yr
Wind risk 9/10 · Severe
- Chance of severe wind over 30 yrs
- 99.0%
Air-quality risk 5/10 · Moderate
- Unhealthy air days now
- 9 days/yr
- Unhealthy air days in 30 yrs
- 10 days/yr
Risk factors via First Street. Map © Google.
Why this score? — see what drove the B+ grade
The composite is a weighted blend of 9 inputs, each scored 0–100. Each bar is that input's sub-score; the figure is the points it added to the 100-point composite (weight × sub-score).
- Cash flow +25.8/30.0
- ARV discount +15.0/15.0
- Appreciation +10.0/10.0
- DSCR +8.6/10.0
- 1% rule +6.7/10.0
- Schools +4.5/10.0
- Livability +3.0/5.0
- Rent growth +2.5/5.0
- Condition / age +2.5/5.0
$150,000
🖨 Deal sheet 📄 Offer letter ✓ Due diligence
Listing remarks
Turnkey Income-Producing Home Near Town and School! Looking for a fantastic investment opportunity? This charming 3-bedroom, 2-bathroom home is ideally located just minutes from downtown and nestled close to local schools. Whether you're looking to expand your portfolio or find a perfect spot for your family, this property checks all the boxes!
Key facts
- 0.33 acre lot
- Garage
- Built 1978
Property features AI
Exterior
- Parking: 1-car garage
- Home design: Single-story residential property; Zoned residential
- Exterior features: Shingle roof
Interior
- Flooring: Carpet
- Bathrooms: 2 full bathrooms
- Heating & cooling: Central heating (electric); Central air conditioning
- Interior features: Carpet flooring; Central heating; Electric heating; Central air conditioning
Neighborhood map
What this means for you Summary
Snapshot
- This is a 3-bed/2.0-bath single-family listed at $150k.
Deal economics
- At list price, monthly cash flow is $363 ($4k/yr) — positive.
- The deal already cash-flows at list — no discount required.
- Meets the 1% rule at list price ($2k rent vs $150k).
- Recommended offer: $132k (12.0% below list) — sets the bar for market timing.
- Cap rate 9.2% vs local median 5.5% in Watertown — top-decile yield for the area; either an underpriced asset or a hidden risk that comps aren't pricing in. Stress-test before assuming the spread holds.
Location & tenants
- Location reads 60/100 on livability (#798 in FL) — a middle-class / working-renter tenant base. Strengths: crime A+, cost of living A+, housing A-; Watch: schools F, amenities F, commute F.
- Columbia (town): math 53% / reading 54% proficiency, ranked #25 of 73 in FL (top 34%) — acceptable for families but not a draw, mixed tenant base, ~2y average lease.
- Market conditions: 143 active listings in the ZIP; 178 units permitted in Columbia County in 2024 (0 in 5+ unit buildings).
- This rent runs 38% of the median local income ($55k/yr) — at the standard rent-burdened threshold; future hikes will face affordability resistance.
Forward outlook
- In year one you build about $16k of equity ($1k loan paydown + $15k appreciation (10.0% local appreciation)).
- Columbia County population projected to shrink 7% by 2050 — rents likely to lag national; underwrite the cash flow, not the appreciation.
- At projected returns (10.0% appreciation + 3.0% rent growth), your $42k cash investment doubles in ~2 years — after that, you're playing with house money.
- By year 3, paydown + projected appreciation supports a ~$41k cash-out refi (75% LTV) — recoverable capital for the next deal without selling this one.
Negotiation context
- It's been on market 247 days — a 12% lower offer ($132k) is reasonable based on typical stale-listing flexibility.
- 2 sale attempts with the ask held roughly flat each time — persistent listings suggest the price (not the market) is what's stuck; bring a comps-based counter.
- Current owner paid $90k; list at $150k implies a 67% gain — meaningful room to come down on a strong offer.
Risks & watch-outs
- Climate carrying-cost: severe wind risk, 99% chance of damaging wind over 30y; moderate wildfire risk; extreme-heat days projected 7→20/yr by 2055 (HVAC capex compounding) — expect insurance premiums to compound above CPI over the hold.
Questions for the listing agent
- It's been on market 247 days. Have you received any prior offers? Is the seller open to a 12% concession, seller financing, or rate buy-down credit?
- Built in 1978 — when were the roof, HVAC, electrical panel, plumbing, and water heater last replaced?
- Why hasn't it sold? Are there any deal-killer items the seller is aware of (foundation, flood, title, zoning, code violations)?
- Is there a deadline driving the sale (1031 exchange, divorce, estate, relocation)? That informs how much negotiation room exists.
- Schools are F-rated, which usually means shorter tenancies and higher turnover. Who's the typical renter profile here, and what's been the actual vacancy rate?
- What's the average days-on-market for RENTAL listings here right now (not sales)? A rising rental-DOM trend means longer vacancies and softer asking-rent achievability than the comps imply.
- What's the recent tenant-quality profile in this submarket — average credit score on applications, eviction rate, late-payment / NSF rate, and stable-employment percentage? A property-management company in the area should have these aggregated.
- How much new for-sale + rental construction is in the pipeline within 1–3 miles? Heavy new supply typically softens prices + rents 12–24 months out; constrained supply supports both.
Investment metrics
- 1% rule
- 1.17% ✓
- Cap rate
- 9.20%
- Cash-on-cash
- 10.37%
- DSCR
- 1.46
- GRM
- 7.1
CMA / ARV
- ARV (on-the-fly)
- $221,578
- Comps found
- 12
Show comp detail 12 sales within ~0.75 mi
| Address | Dist | Beds/Ba | Sqft | Sold | Price | $/sf | Match |
|---|---|---|---|---|---|---|---|
| 231 SE Golf Club Ave | 0.28mi | 4/1.5 (+1) | 1,696 (+2%) | 6mo | $119,000 | $70 | 72 |
| 195 SE Emma Pl | 0.47mi | 3/1.5 | 1,748 (+5%) | 4mo | $232,000 | $133 | 65 |
| 1104 SE Magnolia Loop | 0.61mi | 4/2.0 (+1) | 1,600 (-4%) | 4mo | $245,655 | $154 | 56 |
| 795 SE Defender Dr | 0.61mi | 3/1.5 | 1,568 (-6%) | 8mo | $193,500 | $123 | 53 |
| 132 SE Tribble St | 0.49mi | 4/3.0 (+1) | 1,800 (+8%) | 3mo | $274,900 | $153 | 52 |
| 211 NE Labelle Ter | 0.64mi | 4/2.0 (+1) | 1,726 (+4%) | 9mo | $85,000 | $49 | 52 |
| 114 SE Ibis Way | 0.73mi | 3/2.0 | 1,745 (+5%) | 8mo | $257,050 | $147 | 52 |
| 772 SE Defender Dr | 0.61mi | 3/1.5 | 1,509 (-9%) | 8mo | $170,000 | $113 | 48 |
| 505 NE Williams St | 0.70mi | 4/2.0 (+1) | 1,560 (-6%) | 8mo | $193,000 | $124 | 45 |
| 465 SE Rosewood Cir | 0.71mi | 2/2.0 (-1) | 1,488 (-11%) | 6mo | $255,000 | $171 | 39 |
| 993 SE Putnam St | 0.63mi | 4/2.0 (+1) | 1,438 (-14%) | 6mo | $165,000 | $115 | 38 |
| 186 SE Rosewood Cir | 0.73mi | 2/1.5 (-1) | 1,448 (-13%) | 6mo | $235,000 | $162 | 33 |
Match score weights: distance 35% · size 25% · config 20% · recency 20%. Top-matched comps best support the ARV.
Projected returns pro-forma
10.0% appreciation · 3.0% rent growth · sell at horizon
- IRR
- 31.9%
- Equity multiple
- 3.50×
- Total profit
- $104,821
- Equity at exit
- $135,132
- IRR
- 27.5%
- Equity multiple
- 7.92×
- Total profit
- $290,547
- Equity at exit
- $291,417
Cash invested: $42,000 (down + closing). Projections, not guarantees.
Landlord ↔ Tenant lean methodology
- Overall (STATE)
- 87 Strongly Landlord-Friendly
- State Florida
- 87 Strongly Landlord-Friendly · R+3
- County
- — inherits STATE
- City
- — inherits STATE
ZIP-level market 32025
- Home prices YoY
- 6.8%
- Active inventory
- 143
- Price-to-rent
- 7.1×
Monthly cashflow live
- Estimated rent
- $1,756 medium interval (Pro) →
- Mortgage (P&I)
- −$787
- Tax from tax record
- −$175 /mo · $2,099/yr
- Insurance
- −$62
- HOA
- −$0
- Vacancy / Maint / Mgmt
- −$369
- Net cashflow
- $363
Break-even live
UW: 25.0% down · 7.5% · 30yr · 1.5% tax · 5.0% vac · 8.0% maint · 8.0% mgmt
Financing live
Cash to close
- Down payment
- $37,500
- Closing costs
- $4,500
- Reserves months
- —
- Total cash needed
- —
Loan-product check · same deal, 3 products live
Conventional
25% down · 7.5% · 30yr
- Down + closing
- —
- Monthly P&I
- —
- Monthly cashflow
- —
- DSCR
- —
- Eligible?
- —
Personal DTI + credit; lowest rate.
DSCR
20% down · 8.5% · 30yr
- Down + closing
- —
- Monthly P&I
- —
- Monthly cashflow
- —
- DSCR
- —
- Eligible?
- —
No personal income docs; deal must DSCR.
Hard money
10% down · 12.0% · 12mo
- Down + closing
- —
- Monthly P&I
- —
- Monthly cashflow
- —
- DSCR
- —
- Eligible?
- —
Short-term bridge; refi at stabilization.
Listing history 22 events
-
2026-06-19days on market $150,000 Active 247 DOM
-
2026-06-18days on market $150,000 Active 246 DOM
-
2026-06-17days on market $150,000 Active 245 DOM
-
2026-06-16days on market $150,000 Active 244 DOM
-
2026-06-15days on market $150,000 Active 243 DOM
-
2026-06-14days on market $150,000 Active 241 DOM
-
2026-06-12days on market $150,000 Active 240 DOM
-
2026-06-09days on market $150,000 Active 237 DOM
-
2026-06-08days on market $150,000 Active 236 DOM
-
2026-06-07days on market $150,000 Active 235 DOM
-
2026-06-05days on market $150,000 Active 232 DOM
-
2026-06-03days on market $150,000 Active 231 DOM
-
2026-06-02days on market $150,000 Active 230 DOM
-
2026-06-01days on market $150,000 Active 229 DOM
-
2026-05-31days on market $150,000 Active 228 DOM
-
2026-05-30days on market $150,000 Active 227 DOM
-
2025-10-15$150,000 Active
-
2025-05-28$150,000 Active
-
2011-12-06soldstatus $90,000
-
1997-07-30soldstatus $48,000
-
1994-10-01soldstatus $50,000
-
1977-05-01soldstatus $10,900
ⓘ Source: listings_history table (triggers on properties + properties_extension) + one-shot
backfill from property_details.listing_events for pre-trigger history.
Tax reassessment forecast FL · Resets to sale price
- Current annual tax
- $2,099 · $175/mo
- Projected year-2 tax
- $2,099 · $175/mo
- Expected delta
- $0/yr ($0/mo · 0.0%)
ⓘ Screening estimate from a state-policy table — verify with the county assessor before closing.
Climate risk First Street
- Flood 1/10 Low FEMA zone X (unshaded) · 0% chance over 30 yrs
- Wildfire 5/10 Major
- Heat 8/10 Severe 7 d/yr ≥107°F today · 20 d/yr by 30 yrs out
- Wind 9/10 Extreme 99% chance of damaging wind over 30 yrs
- Air quality 5/10 Major 9 unhealthy d/yr today · 10 by 30 yrs out
Nearby sold comps map
Loading sold comps map…
Walkable amenities ~0.75 mi
Loading nearby amenities…
Taxation est. · year 1
- Rental income
- $21,067
- − Mortgage interest
- −$8,402
- − Property taxes
- −$2,099
- − Insurance
- −$750
- − Repairs & maintenance
- −$1,685
- − Management
- −$1,685
- − Depreciation
- −$4,364
- Taxable income
- $2,081
- Est. tax owed @ 24.0%
- −$499
- After-tax cash flow
- $3,855/yr
For passive investors: Depreciation is non-cash, so a rental often shows a tax loss while cash-flowing — sheltering income. Rental losses are passive: they offset passive income freely, and up to $25,000/yr can offset ordinary (W-2) income if you actively participate and your MAGI is under $100k (phasing out to $0 by $150k); unused losses carry forward. On sale, claimed depreciation is recaptured at up to 25%, and gains may owe capital-gains tax (a 1031 exchange can defer both). Figures are a year-1 estimate at your 24.0% rate — not tax advice; consult a CPA.
Schools (NCES district)
- District
- Columbia
- NCES district ID
- 1200360
- Math proficiency
- 53% ▼ -10.00%
- Reading proficiency
- 54% ▼ -3.00%
- Median HH income
- $40,053
- Composite
- 44.74/100
- National rank
- #2750
- State rank
- #25 of 73 in FL
Livability — Watertown
- Score
- 60/100
- State rank
- #798
- US rank
- #18481
Category grades
Schools grade is shown separately in the Schools card above.
Census & demographics
- Census place
- Watertown, FL
- County
- Columbia County · 40,507 people
- Metro
- Lake City, FL
- Population (ZIP)
- 22,948
- Household income
- $55,004
- Rent vs Own
- Severe rent burden
- 754.0
Population outlook (Columbia County) Hauer SSP2
- Today (2025)
- 68,129 people
- By 2030
- 67,501 · -0.9%
- By 2040
- 65,465 · -3.9%
- By 2050
- 63,058 · -7.4%
- By 2075
- 56,291 · -17.4%
- By 2100
- 45,243 · -33.6%
Race, ethnicity, and origin ACS 2023
- Neighborhood character
- Predominantly White (67%)
- Race & ethnicity
- White 67% Black 20% Hispanic / Latino 8% Two or more races 7%
- Hispanic origin (detail)
- Mexican 1% Puerto Rican 3% Cuban 1%
- Common ancestry
- Serbian 2% Lithuanian 2% Romanian 2%
- Foreign-born
- 3% · Canada
- Languages at home
- 91% English-only · Spanish 6% French/Haitian/Cajun 2%
Political lean MEDSL · Columbia
- 2024 margin
- Solid R (+50.2) · D 24.6% · R 74.7%
- 2008→2024 swing
- -16.4pp toward R · 2008: -33.8pp · 2024: -50.2pp
- All cycles
- 2024: R+50.2 2020: R+45.2 2016: R+44.5 2012: R+36.7 2008: R+33.8
Not yet ingested
- Civics
- —
Market trends
- HPI YoY
- ▲ 17.57%
- Current HPI
- 276.7253
- Rent YoY
- —
- Metro
- Lake City, FL
- State GDP YoY
- ▲ 3.28%
- F500 in state
- 36
Industry mix (Fortune 500 HQ in FL)
| Industry | F500 HQs | Revenue |
|---|---|---|
| Industrial Technology | 2 | $29B |
|
||
| Insurance | 2 | $17B |
|
||
| Retail | 1 | $60B |
|
||
| Technology Distribution | 1 | $58B |
|
||
| Homebuilding | 1 | $35B |
|
||
| Technology Manufacturing | 1 | $35B |
|
||
Price history
+1276.1% since first listed6 events — show timeline
- 2025-10-15 Listed $150,000 NFMLS
- 2025-05-28 Listed $150,000 NFMLS
- 2011-12-06 Sold (Public Records) $90,000 Public Records
- 1997-07-30 Sold (Public Records) $48,000 Public Records
- 1994-10-01 Sold (Public Records) $50,000 Public Records
- 1977-05-01 Sold (Public Records) $10,900 Public Records
Property tax history
+4.3%/yrLatest (2025): $2,099 · +2.8% YoY. Source: county tax records.
Cash-flow waterfall
monthlySold comps — $/sqft
last 12 mo · ≤1 miLoading sold comps…