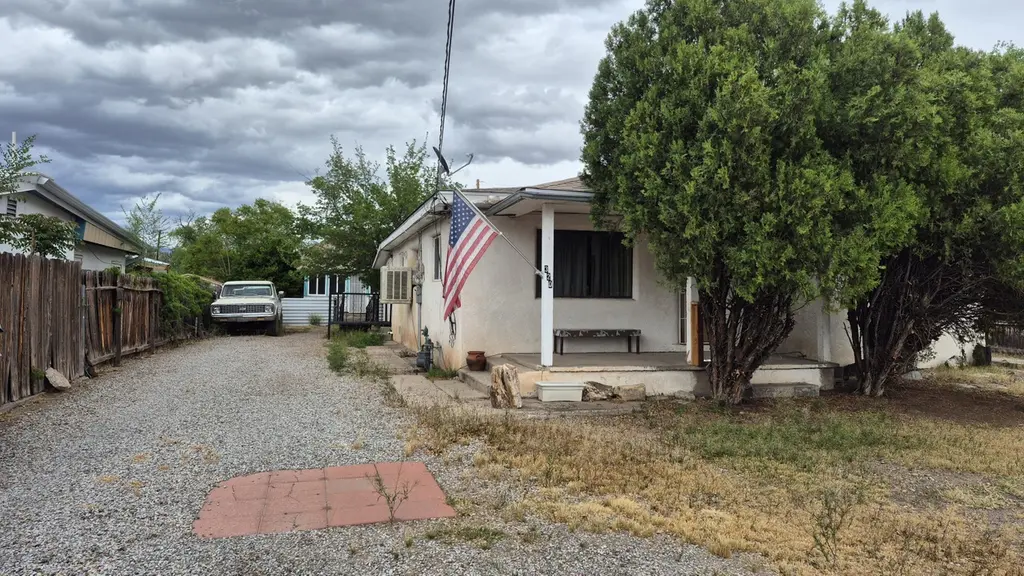
320 Montoya St NW · Albuquerque, NM
Flood risk 1/10 · Minimal
- FEMA flood zone
- X
- Chance of flooding over 30 yrs
- 0.0%
- Est. flood insurance / yr
- $507 – $1,088
Fire risk 3/10 · Minor
- Est. fire insurance / yr
- $706 – $1,312
Heat risk 5/10 · Moderate
- Hot days now (above 96°F)
- 7 days/yr
- Hot days in 30 yrs
- 19 days/yr
Wind risk 1/10 · Minimal
- Chance of severe wind over 30 yrs
- —
Air-quality risk 2/10 · Minimal
- Unhealthy air days now
- 1 days/yr
- Unhealthy air days in 30 yrs
- 2 days/yr
Risk factors via First Street. Map © Google.
Why this score? — see what drove the D grade
The composite is a weighted blend of 9 inputs, each scored 0–100. Each bar is that input's sub-score; the figure is the points it added to the 100-point composite (weight × sub-score).
- ARV discount +15.0/15.0
- Cash flow +8.0/30.0
- Schools +5.3/10.0
- Rent growth +5.0/5.0
- Livability +3.6/5.0
- Condition / age +2.5/5.0
- DSCR +2.0/10.0
- 1% rule +1.3/10.0
- Appreciation +0.0/10.0
$315,000
🖨 Deal sheet (PDF) 📄 Offer letter ✓ Due diligence
Listing remarks
Two homes, one property! Great opportunity to be in the beautiful Old Town/Sawmill area. Unique opportunity with endless potential! This property features a primary residence ready for renovation--and a 1 bedroom casita ideal for guests, rental income, or multigenerational living. The main home is ~1430 sq ft, and the additional dwelling is ~805 sq ft. Buyer to verify all square footage. This property is being SOLD AS-IS, where is, no warranties expressed or implied. No repairs will be completed.
Key facts
- 1 bedroom casita
- Ideal for guests
- Rental income
Tags
Property features AI
Finance
- Other: Zoning: R-1B*; Lot size about 0.3 acres
Exterior
- Utilities: Electricity connected; Natural gas connected; Public sewer; Public water
- Home design: Single-story home; Faces west; Resale property
- Construction: Adobe construction; Stucco exterior; Wood siding; Pitched shingle roof
- Exterior features: Private yard; Covered patio; Screened patio; Shed(s); Full fencing; Landscaped lot with few trees; Paved road access
Interior
- Flooring: Carpet; Laminate; Wood
- Bathrooms: 2 full bathrooms
- Heating & cooling: Ductless heating; Forced air heating; Evaporative cooling; Window cooling units
- Interior features: Ceiling fans; Multiple living areas; Main-level primary bedroom; Walk-in closet(s); Metal-framed windows
- Laundry & utility: Electric dryer hookup
Neighborhood map
What this means for you Summary
Snapshot
- This is a 4-bed/2.0-bath single-family listed at $315k.
Deal economics
- At list price, monthly cash flow is $-322 ($-4k/yr) — negative.
- To cash-flow at today's rent, offer at most $258k (18.1% below list).
- To meet the 1% rule (rent ≥ 1% of price), the offer needs to be $198k (37.1% below list).
- Recommended offer: $198k (37.1% below list) — sets the bar for 1% rule.
- Cap rate 5.1% vs local median 3.6% in Albuquerque — top-decile yield for the area; either an underpriced asset or a hidden risk that comps aren't pricing in. Stress-test before assuming the spread holds.
Location & tenants
- Location reads 72/100 on livability (#13 in NM) — a middle-class / working-renter tenant base. Strengths: amenities A+, commute A+, cost of living A+; Watch: crime F.
- Albuquerque Public Schools (urban): math 51% / reading 75% proficiency, ranked #3 of 29 in NM (top 10%) — acceptable for families but not a draw, mixed tenant base, ~2y average lease; 60% free/reduced lunch — lower-income household profile, screen leases tightly.
- Zoned schools: Coronado Elementary (308 students, 30% FRL); Washington Middle (275 students, 100% FRL); Albuquerque High (math 52% / reading 77%, grade B-, #22 of 110 statewide, top 22%, 1,714 students, 45% FRL) — zoned schools at 58% FRL track the district average.
- Market conditions: Rents rising fast (+10.8%/yr); 93 active listings in the ZIP; 5 comparable units currently listed for rent nearby; rentals at typical pace (median 23d on market — plan ~3-4 weeks tenant-placement turnaround); 40% of comp listings sitting > 30 days — soft ceiling on asking rent; solid renter incomes; 1,316 units permitted in Bernalillo County in 2024 (546 in 5+ unit buildings).
- This rent runs 32% of the median local income ($75k/yr) — at the standard rent-burdened threshold; future hikes will face affordability resistance.
Forward outlook
- Local home prices are declining (-3.0%/yr); year-one equity from $2k of loan paydown is wiped out by about $9k of value loss. Plan a longer hold.
Negotiation context
- It's been on market 57 days — a 3% lower offer ($306k) is reasonable based on typical stale-listing flexibility.
Risks & watch-outs
- Watch-outs: built in 1956 — expect roof / HVAC / electrical / plumbing capex.
- Climate carrying-cost: extreme-heat days projected 7→19/yr by 2055 (HVAC capex compounding) — expect insurance premiums to compound above CPI over the hold.
Questions for the listing agent
- What do current leases actually rent for vs. the listed asking? Can we see a recent rent roll and the last 12 months of T-12 income?
- It's been on market 57 days. Have you received any prior offers? Is the seller open to a 37% concession, seller financing, or rate buy-down credit?
- Built in 1956 — when were the roof, HVAC, electrical panel, plumbing, and water heater last replaced?
- Is there a deadline driving the sale (1031 exchange, divorce, estate, relocation)? That informs how much negotiation room exists.
- Schools are D-rated, which usually means shorter tenancies and higher turnover. Who's the typical renter profile here, and what's been the actual vacancy rate?
- Crime grade is F in this area — have there been break-ins, vandalism, or insurance claims at this property in the last 3 years? What carrier currently insures it and at what premium?
- The area grade is low — what's the realistic commute time and amenity access for the typical tenant pool here? Any planned neighborhood developments (good or bad) we should know about?
- What's the average days-on-market for RENTAL listings here right now (not sales)? A rising rental-DOM trend means longer vacancies and softer asking-rent achievability than the comps imply.
- What's the recent tenant-quality profile in this submarket — average credit score on applications, eviction rate, late-payment / NSF rate, and stable-employment percentage? A property-management company in the area should have these aggregated.
- How much new for-sale + rental construction is in the pipeline within 1–3 miles? Heavy new supply typically softens prices + rents 12–24 months out; constrained supply supports both.
Investment metrics
- 1% rule
- 0.63% ✗
- Cap rate
- 5.07%
- Cash-on-cash
- -4.38%
- DSCR
- 0.80
- GRM
- 13.3
CMA / ARV
- ARV (median comp)
- $533,090
- List price
- $315,000
- Delta
- -40.91%
- Verdict
- UNDERPRICED
- Comps
- 20 within 1.0 mi
Show comp detail 2 sales within ~0.75 mi
| Address | Dist | Beds/Ba | Sqft | Sold | Price | $/sf | Match |
|---|---|---|---|---|---|---|---|
| 2705 Mountain Rd NW | 0.15mi | 3/1.0 (-1) | 1,446 (+3%) | 2mo | $285,000 | $197 | 78 |
| 2428 Floral Rd NW | 0.72mi | 3/2.0 (-1) | 1,249 (-11%) | 8mo | $328,900 | $263 | 36 |
Match score weights: distance 35% · size 25% · config 20% · recency 20%. Top-matched comps best support the ARV.
Projected returns pro-forma
-3.0% appreciation · 8.0% rent growth · sell at horizon
- IRR
- -19.1%
- Equity multiple
- 0.31×
- Total profit
- $-61,244
- Equity at exit
- $46,968
- IRR
- -4.8%
- Equity multiple
- 0.63×
- Total profit
- $-32,708
- Equity at exit
- $27,235
Cash invested: $88,200 (down + closing). Projections, not guarantees.
Landlord ↔ Tenant lean methodology
- Overall (STATE)
- 55 Moderately Landlord-Leaning
- State New Mexico
- 55 Moderately Landlord-Leaning · D+3
- County
- — inherits STATE
- City
- — inherits STATE
ZIP-level market 87104
- Home prices YoY
- -29.7%
- Rents YoY
- 10.8%
- Active inventory
- 93
- Price-to-rent
- 13.3×
Monthly cashflow live
- Estimated rent
- $1,981 high interval (Pro) →
- Mortgage (P&I)
- −$1,652
- Tax from tax record
- −$104 /mo · $1,249/yr
- Insurance
- −$131
- HOA
- −$0
- Vacancy / Maint / Mgmt
- −$416
- Net cashflow
- $-322
Break-even live
Sensitivity live
| Price | -10% $-144 | -5% $-233 | +0% $-322 | +5% $-411 | +10% $-501 |
|---|---|---|---|---|---|
| Rent | -10% $-479 | -5% $-400 | +0% $-322 | +5% $-244 | +10% $-166 |
| Rate | -1.0pp $-164 | -0.5pp $-242 | base $-322 | +0.5pp $-404 | +1.0pp $-487 |
UW: 25.0% down · 7.5% · 30yr · 1.5% tax · 5.0% vac · 8.0% maint · 8.0% mgmt
Financing live
Cash to close
- Down payment
- $78,750
- Closing costs
- $9,450
- Reserves months
- —
- Total cash needed
- —
Loan-product check · same deal, 3 products live
Conventional
25% down · 7.5% · 30yr
- Down + closing
- —
- Monthly P&I
- —
- Monthly cashflow
- —
- DSCR
- —
- Eligible?
- —
Personal DTI + credit; lowest rate.
DSCR
20% down · 8.5% · 30yr
- Down + closing
- —
- Monthly P&I
- —
- Monthly cashflow
- —
- DSCR
- —
- Eligible?
- —
No personal income docs; deal must DSCR.
Hard money
10% down · 12.0% · 12mo
- Down + closing
- —
- Monthly P&I
- —
- Monthly cashflow
- —
- DSCR
- —
- Eligible?
- —
Short-term bridge; refi at stabilization.
Rent comps 5 comps
| Address | Beds | Baths | Sqft | Rent | $/sqft | DOM | Units | Dist |
|---|---|---|---|---|---|---|---|---|
| 1812 Indian School Rd NW Albuquerque, NM | 1.0–3.0 | 1.0–2.0 | 776 | $1,705 | $2.20 | 4d | 9 | 1.14mi |
| 1700 Violetas Rd NW Albuquerque, NM | 3.0 | 2.5 | 1426 | $1,695 | $1.19 | 21d | 1 | 1.15mi |
| 2804 19th St NW Albuquerque, NM | 3.0 | 2.0 | 1676 | $2,245 | $1.34 | 23d | 1 | 1.32mi |
| 2304 Alamogordo Dr NW Albuquerque, NM | 3.0 | 2.0 | 1420 | $2,095 | $1.48 | 45d | 1 | 1.40mi |
| 5501 Iliff Rd NW Albuquerque, NM | 4.0 | 2.0 | 1400 | $2,000 | $1.43 | 45d | 1 | 1.46mi |
Listing history 19 events
-
2026-06-22days on market $315,000 Active 57 DOM
-
2026-06-18days on market $315,000 Active 54 DOM
-
2026-06-17days on market $315,000 Active 53 DOM
-
2026-06-16days on market $315,000 Active 52 DOM
-
2026-06-15days on market $315,000 Active 51 DOM
-
2026-06-13days on market $315,000 Active 49 DOM
-
2026-06-10days on market $315,000 Active 46 DOM
-
2026-06-09days on market $315,000 Active 45 DOM
-
2026-06-08days on market $315,000 Active 44 DOM
-
2026-06-07days on market $315,000 Active 43 DOM
-
2026-06-05days on market $315,000 Active 40 DOM
-
2026-06-03days on market $315,000 Active 39 DOM
-
2026-06-02days on market $315,000 Active 38 DOM
-
2026-06-01days on market $315,000 Active 37 DOM
-
2026-05-31days on market $315,000 Active 36 DOM
-
2026-04-11$315,000 Active 502-char remark
-
2025-09-26price $307,000
-
2025-08-27price $325,000
-
2025-08-12price $350,000
ⓘ Source: listings_history table (triggers on properties + properties_extension) + one-shot
backfill from property_details.listing_events for pre-trigger history.
Tax reassessment forecast NM · Resets to sale price
- Current annual tax
- $1,249 · $104/mo
- Projected year-2 tax
- $2,520 · $210/mo
- Expected delta
- +$1,271/yr (+$106/mo · 101.8%)
ⓘ Screening estimate from a state-policy table — verify with the county assessor before closing.
Climate risk First Street
- Flood 1/10 Low FEMA zone X · 0% chance over 30 yrs
- Wildfire 3/10 Moderate
- Heat 5/10 Major 7 d/yr ≥96°F today · 19 d/yr by 30 yrs out
- Wind 1/10 Low
- Air quality 2/10 Low 1 unhealthy d/yr today · 2 by 30 yrs out
Nearby sold comps map
Loading sold comps map…
Walkable amenities ~0.75 mi
Loading nearby amenities…
Taxation est. · year 1
- Rental income
- $23,772
- − Mortgage interest
- −$17,645
- − Property taxes
- −$1,249
- − Insurance
- −$1,575
- − Repairs & maintenance
- −$1,902
- − Management
- −$1,902
- − Depreciation
- −$9,164
- Taxable loss
- −$9,664
- Est. tax savings @ 24.0%
- +$2,319
- After-tax cash flow
- $-1,547/yr
For passive investors: Depreciation is non-cash, so a rental often shows a tax loss while cash-flowing — sheltering income. Rental losses are passive: they offset passive income freely, and up to $25,000/yr can offset ordinary (W-2) income if you actively participate and your MAGI is under $100k (phasing out to $0 by $150k); unused losses carry forward. On sale, claimed depreciation is recaptured at up to 25%, and gains may owe capital-gains tax (a 1031 exchange can defer both). Figures are a year-1 estimate at your 24.0% rate — not tax advice; consult a CPA.
Schools (NCES district)
- District
- Albuquerque Public Schools
- NCES district ID
- 3500060
- Math proficiency
- 51% ▲ 30.00%
- Reading proficiency
- 75% ▲ 45.00%
- Median HH income
- $48,151
- Composite
- 53.29/100
- National rank
- #1487
- State rank
- #3 of 29 in NM
Livability — Albuquerque
- Score
- 72/100
- State rank
- #13
- US rank
- #6219
Category grades
Schools grade is shown separately in the Schools card above.
Census & demographics
- Census place
- Albuquerque, NM
- County
- Bernalillo County · 647,165 people
- City population
- 647,165
- Metro
- Albuquerque, NM
- Population (ZIP)
- 12,853
- Household income
- $75,436
- Rent vs Own
- Severe rent burden
- 589.0
Population outlook (Bernalillo County) Hauer SSP2
- Today (2025)
- 704,528 people
- By 2030
- 711,723 · +1.0%
- By 2040
- 714,522 · +1.4%
- By 2050
- 709,274 · +0.7%
- By 2075
- 680,015 · -3.5%
- By 2100
- 619,879 · -12.0%
Race, ethnicity, and origin ACS 2023
- Neighborhood character
- Diverse neighborhood (Simpson 0.57)
- Race & ethnicity
- Hispanic / Latino 55% White 35% Two or more races 31% Black 4% Native American 2%
- Hispanic origin (detail)
- Mexican 34%
- Common ancestry
- Romanian 3% Italian 2% Slovak 2%
- Foreign-born
- 6% · Canada
- Languages at home
- 73% English-only · Spanish 25%
Political lean MEDSL · Bernalillo
- 2024 margin
- Strong D (+21.0) · D 59.2% · R 38.2% · Other 2.6%
- 2008→2024 swing
- -0.3pp no change · 2008: 21.4pp · 2024: 21.0pp
- All cycles
- 2024: D+21.0 2020: D+24.4 2016: D+17.8 2012: D+16.2 2008: D+21.4
Not yet ingested
- Civics
- —
Market trends
- HPI YoY
- ▼ -102.54%
- Current HPI
- 242.948
- Rent YoY
- ▲ 10.78%
- Metro
- Albuquerque, NM
- State GDP YoY
- —
- F500 in state
- 0
Price history
-10.0% since first listed4 events — show timeline
- 2026-04-11 Listed $315,000 Southwest MLS
- 2025-09-26 Price Changed $307,000 Southwest MLS
- 2025-08-27 Price Changed $325,000 Southwest MLS
- 2025-08-12 Price Changed $350,000 Southwest MLS
Property tax history
-3.4%/yrLatest (2025): $1,249 · -15.8% YoY. Source: county tax records.
Cash-flow waterfall
monthlySold comps — $/sqft
last 12 mo · ≤1 miLoading sold comps…