5118 Thrush Dr · Indianapolis city (balance), IN
Flood risk 1/10 · Minimal
- FEMA flood zone
- X (unshaded)
- Chance of flooding over 30 yrs
- 0.0%
- Est. flood insurance / yr
- $507 – $1,088
Fire risk 1/10 · Minimal
- Est. fire insurance / yr
- $717 – $1,331
Heat risk 3/10 · Minor
- Hot days now (above 101°F)
- 7 days/yr
- Hot days in 30 yrs
- 19 days/yr
Wind risk 2/10 · Minimal
- Chance of severe wind over 30 yrs
- —
Air-quality risk 4/10 · Minor
- Unhealthy air days now
- 5 days/yr
- Unhealthy air days in 30 yrs
- 7 days/yr
Risk factors via First Street. Map © Google.
Why this score? — see what drove the D grade
The composite is a weighted blend of 9 inputs, each scored 0–100. Each bar is that input's sub-score; the figure is the points it added to the 100-point composite (weight × sub-score).
- ARV discount +15.0/15.0
- Cash flow +9.9/30.0
- 1% rule +5.1/10.0
- DSCR +2.8/10.0
- Rent growth +2.7/5.0
- Livability +2.5/5.0
- Condition / age +2.5/5.0
- Schools +1.4/10.0
- Appreciation +0.0/10.0
$130,000
🖨 Deal sheet 📄 Offer letter ✓ Due diligence
Listing remarks MLS
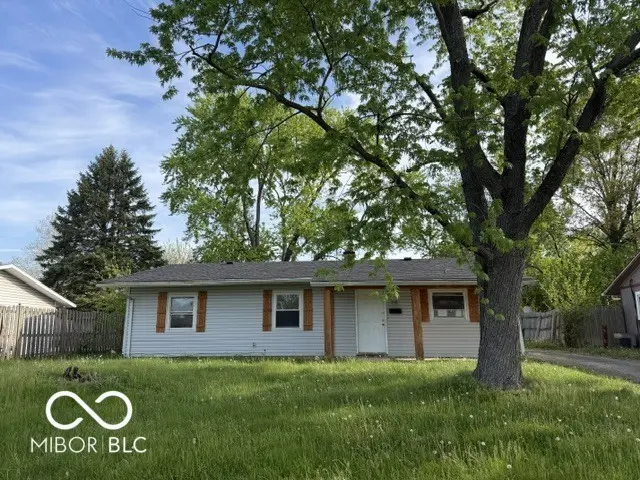
This 3-bedroom, 1.5 bath ranch home offers a great opportunity for buyers looking to add their personal touch. Featuring a spacious living room and a functional layout, the home provides a solid foundation for your next project. Outside, you'll find a detached oversized 2-car garage and a large rear yard, perfect for storage, hobbies, or outdoor entertaining. Conveniently located near shopping, dining, downtown, and multiple major highways, commuting and daily errands are simple and efficient. With plenty of potential, this property is a true blank slate ready for your vision.
Key facts
- Large rear yard
- 9,365 sq ft lot
- 2 garage spots
Tags
Neighborhood map
What this means for you Summary
Snapshot
- This is a 3-bed/1.5-bath single-family listed at $130k.
Deal economics
- At list price, monthly cash flow is $-80 ($-964/yr) — negative.
- To cash-flow at today's rent, offer at most $116k (10.9% below list).
- Meets the 1% rule at list price ($1k rent vs $130k).
- Recommended offer: $116k (10.9% below list) — sets the bar for cash-flow.
- Cap rate 5.6% vs local median 4.4% in Indianapolis city (balance) — meaningfully above typical; check what's discounted (condition, days-on-market, listing class) to confirm the premium yield is real.
Location & tenants
- Location reads: area grade D — affects rentability + tenant quality, not the cash-flow math above.
- Indianapolis Public Schools (urban): math 14% / reading 20% proficiency, ranked #286 of 301 in IN (top 95%) — low school quality limits family demand, transient renter base, plan for 1-2y turnover; 77% free/reduced lunch — lower-income household profile, screen leases tightly.
- Market conditions: Rents flat; 61 active listings in the ZIP; 28 comparable units currently listed for rent nearby; rentals at typical pace (median 24d on market — plan ~3-4 weeks tenant-placement turnaround); 1,906 units permitted in Marion County in 2024 (621 in 5+ unit buildings).
Forward outlook
- Local home prices are declining (-3.0%/yr); year-one equity from $899 of loan paydown is wiped out by about $4k of value loss. Plan a longer hold.
- Marion County population projected at +18% by 2050 — long-run rental-demand tailwind backs the buy-and-hold thesis.
Negotiation context
- It's been on market 41 days — a 3% lower offer ($126k) is reasonable based on typical stale-listing flexibility.
Risks & watch-outs
- Watch-outs: property tax is 3.5% of price; built in 1958 — expect roof / HVAC / electrical / plumbing capex.
Questions for the listing agent
- What do current leases actually rent for vs. the listed asking? Can we see a recent rent roll and the last 12 months of T-12 income?
- It's been on market 41 days. Have you received any prior offers? Is the seller open to a 11% concession, seller financing, or rate buy-down credit?
- Built in 1958 — when were the roof, HVAC, electrical panel, plumbing, and water heater last replaced?
- Property tax is high relative to price — has the assessment been appealed recently, and will the sale trigger a re-assessment?
- Is there a deadline driving the sale (1031 exchange, divorce, estate, relocation)? That informs how much negotiation room exists.
- The area grade is low — what's the realistic commute time and amenity access for the typical tenant pool here? Any planned neighborhood developments (good or bad) we should know about?
- What's the average days-on-market for RENTAL listings here right now (not sales)? A rising rental-DOM trend means longer vacancies and softer asking-rent achievability than the comps imply.
- What's the recent tenant-quality profile in this submarket — average credit score on applications, eviction rate, late-payment / NSF rate, and stable-employment percentage? A property-management company in the area should have these aggregated.
- How much new for-sale + rental construction is in the pipeline within 1–3 miles? Heavy new supply typically softens prices + rents 12–24 months out; constrained supply supports both.
Investment metrics
- 1% rule
- 1.01% ✓
- Cap rate
- 5.55%
- Cash-on-cash
- -2.65%
- DSCR
- 0.88
- GRM
- 8.2
CMA / ARV
- ARV (median comp)
- $172,366
- List price
- $130,000
- Delta
- -24.58%
- Verdict
- UNDERPRICED
- Comps
- 20 within 1.0 mi
Show comp detail 12 sales within ~0.75 mi
| Address | Dist | Beds/Ba | Sqft | Sold | Price | $/sf | Match |
|---|---|---|---|---|---|---|---|
| 3234 Chrysler St | 0.22mi | 4/1.5 (+1) | 1,125 (-3%) | 1mo | $207,000 | $184 | 79 |
| 3114 Winton Ave | 0.22mi | 4/2.0 (+1) | 1,135 (-2%) | 2mo | $230,000 | $203 | 78 |
| 5249 Falcon Ln | 0.56mi | 3/1.5 | 1,189 (+3%) | 2mo | $220,000 | $185 | 68 |
| 3520 Beeler Ave | 0.41mi | 3/1.5 | 1,073 (-7%) | 3mo | $180,000 | $168 | 66 |
| 3035 Auburn Rd | 0.33mi | 3/1.0 | 1,025 (-11%) | 0mo | $167,000 | $163 | 64 |
| 5338 Dunk Dr | 0.49mi | 3/1.0 | 1,236 (+7%) | 1mo | $180,000 | $146 | 63 |
| 3441 Minger Rd | 0.72mi | 3/2.0 | 1,145 (-1%) | 1mo | $230,000 | $201 | 62 |
| 5008 W 37th St | 0.57mi | 3/1.0 | 1,200 (+4%) | 5mo | $60,000 | $50 | 61 |
| 3148 Donald Ave | 0.35mi | 4/1.5 (+1) | 1,000 (-14%) | 2mo | $160,000 | $160 | 54 |
| 3626 Lowry Rd | 0.62mi | 3/1.0 | 1,269 (+10%) | 3mo | $98,000 | $77 | 51 |
| 4521 Hollister Dr | 0.72mi | 3/1.5 | 1,066 (-8%) | 4mo | $150,000 | $141 | 50 |
| 3466 Georgetown Rd | 0.46mi | 3/2.0 | 988 (-15%) | 4mo | $189,900 | $192 | 49 |
Match score weights: distance 35% · size 25% · config 20% · recency 20%. Top-matched comps best support the ARV.
Projected returns pro-forma
-3.0% appreciation · 0.79% rent growth · sell at horizon
- IRR
- -23.7%
- Equity multiple
- 0.21×
- Total profit
- $-28,884
- Equity at exit
- $19,383
- IRR
- -28.5%
- Equity multiple
- -0.16×
- Total profit
- $-42,331
- Equity at exit
- $11,240
Cash invested: $36,400 (down + closing). Projections, not guarantees.
Landlord ↔ Tenant lean methodology
- Overall (STATE)
- 90 Strongly Landlord-Friendly
- State Indiana
- 90 Strongly Landlord-Friendly · R+11
- County
- — inherits STATE
- City
- — inherits STATE
ZIP-level market 46224
- Rents YoY
- 0.8%
- Active inventory
- 61
- Price-to-rent
- 8.2×
Monthly cashflow live
- Estimated rent
- $1,314 high interval (Pro) →
- Mortgage (P&I)
- −$682
- Tax from tax record
- −$382 /mo · $4,589/yr
- Insurance
- −$54
- HOA
- −$0
- Vacancy / Maint / Mgmt
- −$276
- Net cashflow
- $-80
Break-even live
UW: 25.0% down · 7.5% · 30yr · 1.5% tax · 5.0% vac · 8.0% maint · 8.0% mgmt
Financing live
Cash to close
- Down payment
- $32,500
- Closing costs
- $3,900
- Reserves months
- —
- Total cash needed
- —
Loan-product check · same deal, 3 products live
Conventional
25% down · 7.5% · 30yr
- Down + closing
- —
- Monthly P&I
- —
- Monthly cashflow
- —
- DSCR
- —
- Eligible?
- —
Personal DTI + credit; lowest rate.
DSCR
20% down · 8.5% · 30yr
- Down + closing
- —
- Monthly P&I
- —
- Monthly cashflow
- —
- DSCR
- —
- Eligible?
- —
No personal income docs; deal must DSCR.
Hard money
10% down · 12.0% · 12mo
- Down + closing
- —
- Monthly P&I
- —
- Monthly cashflow
- —
- DSCR
- —
- Eligible?
- —
Short-term bridge; refi at stabilization.
Rent comps 28 comps
| Address | Beds | Baths | Sqft | Rent | $/sqft | DOM | Units | Dist |
|---|---|---|---|---|---|---|---|---|
| 3201 Watergate Rd Indianapolis, IN | 3.0 | 1.0–2.0 | 826 | $1,269 | $1.54 | 3d | 20 | 0.20mi |
| 3245 Chrysler St Indianapolis, IN | 3.0 | 1.0 | 945 | $1,345 | $1.42 | 4d | 1 | 0.24mi |
| 3338 Tara Ln Indianapolis, IN | 3.0 | 1.5 | 1242 | $1,199 | $0.97 | 43d | 1 | 0.26mi |
| 3161 Chrysler St Indianapolis, IN | 4.0 | 1.0 | 1306 | $1,095 | $0.84 | 13d | 1 | 0.30mi |
| 3138 Midvale Dr Indianapolis, IN | 3.0 | 1.0 | 900 | $1,495 | $1.66 | 43d | 1 | 0.45mi |
| 3060 Midvale Dr Indianapolis, IN | 3.0 | 1.0 | 900 | $1,200 | $1.33 | 23d | 1 | 0.52mi |
| 5505 Scarlet Dr Indianapolis, IN | 3.0 | 1.0–1.5 | 883 | $1,549 | $1.75 | 2d | 4 | 0.61mi |
| 3232 Normandy Rd Indianapolis, IN | 3.0 | 1.0 | 900 | $1,250 | $1.39 | 19d | 1 | 0.71mi |
| 4014 Alberta St Indianapolis, IN | 3.0 | 1.0 | 988 | $1,195 | $1.21 | 20d | 1 | 0.92mi |
| 5925 Sunwood Dr Indianapolis, IN | 3.0 | 1.0 | 1479 | $1,600 | $1.08 | 4d | 1 | 0.99mi |
| 5925 Sunwood Dr Indianapolis, IN | 3.0 | 1.0 | 1479 | $1,600 | $1.08 | 20d | 1 | 0.99mi |
| 3141 Danbury Rd Indianapolis, IN | 3.0 | 1.0 | 1200 | $1,295 | $1.08 | 10d | 1 | 1.01mi |
| 2 Philip Ct Indianapolis, IN | 3.0 | 1.0 | 1000 | $1,295 | $1.29 | 23d | 1 | 1.08mi |
| 5801 Westhaven Dr Indianapolis, IN | 4.0 | 1.0 | 1102 | $1,300 | $1.18 | 43d | 1 | 1.08mi |
| 5801 Westhaven Dr Indianapolis, IN | 4.0 | 1.0 | 1102 | $1,300 | $1.18 | 23d | 1 | 1.08mi |
| 2907 Corvallis Cres Indianapolis, IN | 3.0 | 1.5 | 1104 | $1,200 | $1.09 | 23d | 1 | 1.10mi |
| 2907 Corvallis Cres Indianapolis, IN | 3.0 | 1.0 | 1104 | $1,200 | $1.09 | 43d | 1 | 1.10mi |
| 6010 W 25th St Indianapolis, IN | 1.0–2.0 | 1.0–1.5 | 878 | $1,250 | $1.42 | 2d | 18 | 1.32mi |
| 6011 W 25th St Unit 4 Indianapolis, IN | 2.0 | 1.0 | 1083 | $1,050 | $0.97 | 23d | 1 | 1.36mi |
| 3636 Mission Dr Indianapolis, IN | 2.0 | 1.5 | 1100 | $1,225 | $1.11 | 43d | 1 | 1.37mi |
| 3636 Mission Dr Indianapolis, IN | 3.0 | 1.5 | 1200 | $1,415 | $1.18 | 23d | 1 | 1.37mi |
| 3269 Lupine Dr Indianapolis, IN | 2.0 | 1.0 | 986 | $995 | $1.01 | 23d | 1 | 1.43mi |
| 6474 Lupine Ter Indianapolis, IN | 2.0 | 1.0 | 847 | $950 | $1.12 | 23d | 1 | 1.43mi |
| 6436 Lupine Dr Indianapolis, IN | 2.0 | 1.0 | 966 | $950 | $0.98 | 23d | 1 | 1.44mi |
| 3279 Lupine Dr Indianapolis, IN | 2.0 | 1.0 | 827 | $1,150 | $1.39 | 43d | 1 | 1.45mi |
| 3281 Lupine Dr Indianapolis, IN | 2.0 | 1.0 | 966 | $1,300 | $1.35 | 23d | 1 | 1.45mi |
| 6536 Lupine Ter Indianapolis, IN | 2.0 | 1.0 | 906 | $1,280 | $1.41 | 23d | 1 | 1.48mi |
| 6458 Lupine Dr Indianapolis, IN | 2.0 | 1.0 | 966 | $950 | $0.98 | 23d | 1 | 1.49mi |
Listing history 6 events
-
2026-06-03status $130,000 Pending 41 DOM
-
2026-06-02days on market $130,000 Active 41 DOM
-
2026-06-01days on market $130,000 Active 40 DOM
-
2026-05-31days on market $130,000 Active 39 DOM
-
2026-04-22$130,000 Active 583-char remark
Show marketing remark (583 chars)
This 3-bedroom, 1.5 bath ranch home offers a great opportunity for buyers looking to add their personal touch. Featuring a spacious living room and a functional layout, the home provides a solid foundation for your next project. Outside, you'll find a detached oversized 2-car garage and a large rear yard, perfect for storage, hobbies, or outdoor entertaining. Conveniently located near shopping, dining, downtown, and multiple major highways, commuting and daily errands are simple and efficient. With plenty of potential, this property is a true blank slate ready for your vision.
-
2021-06-03soldstatus $450,000
ⓘ Source: listings_history table (triggers on properties + properties_extension) + one-shot
backfill from property_details.listing_events for pre-trigger history.
Tax reassessment forecast IN · Partial reset (capped growth)
- Current annual tax
- $4,589 · $382/mo
- Projected year-2 tax
- $4,589 · $382/mo
- Expected delta
- $0/yr ($0/mo · 0.0%)
ⓘ Screening estimate from a state-policy table — verify with the county assessor before closing.
Climate risk First Street
- Flood 1/10 Low FEMA zone X (unshaded) · 0% chance over 30 yrs
- Wildfire 1/10 Low
- Heat 3/10 Moderate 7 d/yr ≥101°F today · 19 d/yr by 30 yrs out
- Wind 2/10 Low
- Air quality 4/10 Moderate 5 unhealthy d/yr today · 7 by 30 yrs out
Nearby sold comps map
Loading sold comps map…
Walkable amenities ~0.75 mi
Loading nearby amenities…
Taxation est. · year 1
- Rental income
- $15,767
- − Mortgage interest
- −$7,282
- − Property taxes
- −$4,589
- − Insurance
- −$650
- − Repairs & maintenance
- −$1,261
- − Management
- −$1,261
- − Depreciation
- −$3,782
- Taxable loss
- −$3,058
- Est. tax savings @ 24.0%
- +$734
- After-tax cash flow
- $-230/yr
For passive investors: Depreciation is non-cash, so a rental often shows a tax loss while cash-flowing — sheltering income. Rental losses are passive: they offset passive income freely, and up to $25,000/yr can offset ordinary (W-2) income if you actively participate and your MAGI is under $100k (phasing out to $0 by $150k); unused losses carry forward. On sale, claimed depreciation is recaptured at up to 25%, and gains may owe capital-gains tax (a 1031 exchange can defer both). Figures are a year-1 estimate at your 24.0% rate — not tax advice; consult a CPA.
Schools (NCES district)
- District
- Indianapolis Public Schools
- NCES district ID
- 1804770
- Math proficiency
- 14% ▼ -7.00%
- Reading proficiency
- 20% ▼ -3.00%
- Median HH income
- $32,034
- Composite
- 13.69/100
- National rank
- #9499
- State rank
- #286 of 301 in IN
Livability — Indianapolis city (balance)
No livability data for this city. (Only ~50 U.S. cities are tracked.)
Census & demographics
- Census place
- Indianapolis city (balance), IN
- County
- Marion County · 998,460 people
- City population
- 881,119
- Metro
- Indianapolis-Carmel-Anderson, IN
- Population (ZIP)
- 40,228
- Household income
- $55,986
- Rent vs Own
- Severe rent burden
- 2206.0
Population outlook (Marion County) Hauer SSP2
- Today (2025)
- 1,025,572 people
- By 2030
- 1,065,727 · +3.9%
- By 2040
- 1,141,577 · +11.3%
- By 2050
- 1,208,920 · +17.9%
- By 2075
- 1,367,288 · +33.3%
- By 2100
- 1,438,201 · +40.2%
Race, ethnicity, and origin ACS 2023
- Neighborhood character
- Diverse neighborhood (Simpson 0.69)
- Race & ethnicity
- Black 39% White 33% Hispanic / Latino 23% Two or more races 7% Asian 1%
- Hispanic origin (detail)
- Mexican 14% Dominican 2%
- Common ancestry
- Hispanic 3% Arab 1% Italian 1%
- Foreign-born
- 31% · Canada, Philippines
- Languages at home
- 62% English-only · Spanish 19% French/Haitian/Cajun 5% Arabic 2%
Political lean MEDSL · Marion
- 2024 margin
- Strong D (+27.7) · D 63.0% · R 35.3% · Other 1.7%
- 2008→2024 swing
- -0.7pp no change · 2008: 28.4pp · 2024: 27.7pp
- All cycles
- 2024: D+27.7 2020: D+29.1 2016: D+22.8 2012: D+22.2 2008: D+28.4
Not yet ingested
- Civics
- —
Market trends
- HPI YoY
- ▼ -179.31%
- Current HPI
- 297.7156
- Rent YoY
- ▲ 0.79%
- Metro
- Indianapolis-Carmel-Anderson, IN
- State GDP YoY
- ▲ 2.90%
- F500 in state
- 18
Industry mix (Fortune 500 HQ in IN)
| Industry | F500 HQs | Revenue |
|---|---|---|
| Industrial Machinery | 2 | $37B |
|
||
| Healthcare | 1 | $177B |
|
||
| Pharmaceuticals | 1 | $45B |
|
||
| Metals / Steel | 1 | $18B |
|
||
| Agriculture | 1 | $17B |
|
||
| Packaging | 1 | $12B |
|
||
Price history
-71.1% since first listed2 events — show timeline
- 2026-04-22 Listed $130,000 MIBOR as Distributed by MLS Grid
- 2021-06-03 Sold (Public Records) $450,000 Public Records
Property tax history
+21.1%/yrLatest (2025): $4,589 · +27.9% YoY. Source: county tax records.
Cash-flow waterfall
monthlySold comps — $/sqft
last 12 mo · ≤1 miLoading sold comps…