1501 Timber Crk · Lindenwold, NJ
Flood risk No data
- FEMA flood zone
- —
- Chance of flooding over 30 yrs
- —
- Est. flood insurance / yr
- —
Fire risk No data
- Est. fire insurance / yr
- —
Heat risk No data
- Hot days now (above threshold)
- —
- Hot days in 30 yrs
- —
Wind risk No data
- Chance of severe wind over 30 yrs
- —
Air-quality risk No data
- Unhealthy air days now
- —
- Unhealthy air days in 30 yrs
- —
Risk factors via First Street. Map © Google.
Why this score? — see what drove the C- grade
The composite is a weighted blend of 9 inputs, each scored 0–100. Each bar is that input's sub-score; the figure is the points it added to the 100-point composite (weight × sub-score).
- Cash flow +19.6/30.0
- 1% rule +10.0/10.0
- ARV discount +7.5/15.0
- DSCR +6.2/10.0
- Livability +3.4/5.0
- Rent growth +3.3/5.0
- Condition / age +2.5/5.0
- Schools +1.3/10.0
- Appreciation +0.0/10.0
$165,000
🖨 Deal sheet 📄 Offer letter ✓ Due diligence
Listing remarks
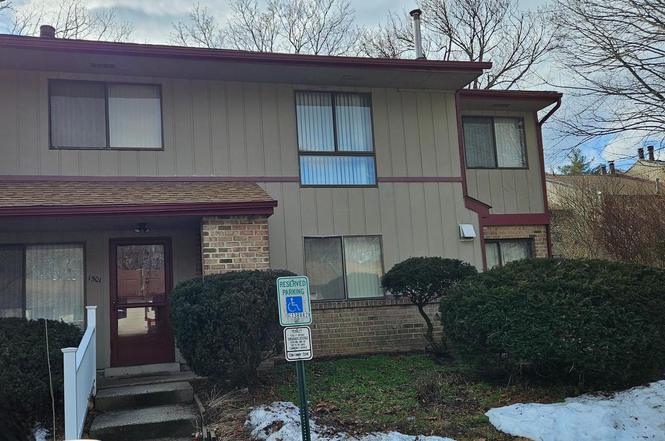
This is your chance to own a Spacious 3 bedroom 2.5 bath end-unit condo in Timber Creek. This lovingly cared for 2 story townhome features a large Living Room, ample Dining area, good-sized Kitchen, Den with walk-in closet and 1/2 bath on the 1st floor. The Entry way features a coat closet, there is a utility closet off of the kitchen and the stackable washer and dryer are located in the kitchen. The 2nd floor features a nice sized Master Bedroom with ensuite bath and 2 walk-in closets, a nice sized 2nd Bedroom with double closet and a 3rd bedroom with double closet, another Full Bath and a hallway linen closet. The A/C is newer(2018/19). The Community offers a Pool & Playground. Con
Key facts
- 2 story townhome
- End-unit condo
- $521 HOA
Tags
Neighborhood map
What this means for you Summary
Snapshot
- This is a 3-bed/2.5-bath condo listed at $165k.
Deal economics
- At list price, monthly cash flow is $191 ($2k/yr) — positive.
- The deal already cash-flows at list — no discount required.
- Meets the 1% rule at list price ($2k rent vs $165k).
- Recommended offer: $160k (3.0% below list) — sets the bar for market timing.
- Cap rate 7.7% vs local median 5.3% in Lindenwold — top-decile yield for the area; either an underpriced asset or a hidden risk that comps aren't pricing in. Stress-test before assuming the spread holds.
Location & tenants
- Location reads 68/100 on livability (#312 in NJ) — a middle-class / working-renter tenant base. Strengths: housing A+, health & safety A, cost of living B; Watch: employment C-, crime D, schools F.
- Lindenwold Public School District (suburban): math 4% / reading 25% proficiency, ranked #461 of 472 in NJ (top 98%) — low school quality limits family demand, transient renter base, plan for 1-2y turnover; 68% free/reduced lunch — lower-income household profile, screen leases tightly.
- Market conditions: Rents rising (+3.0%/yr); 237 active listings in the ZIP; 8 comparable units currently listed for rent nearby; rentals leasing fast (median 1d on market — plan ~1-2 weeks tenant-placement turnaround); 1,018 units permitted in Camden County in 2024 (509 in 5+ unit buildings).
- This rent runs 44% of the median local income ($68k/yr) — at the standard rent-burdened threshold; future hikes will face affordability resistance.
Forward outlook
- Local home prices are declining (-3.0%/yr); year-one equity from $1k of loan paydown is wiped out by about $5k of value loss. Plan a longer hold.
- Camden County population projected to shrink 8% by 2050 — rents likely to lag national; underwrite the cash flow, not the appreciation.
Negotiation context
- It's been on market 40 days — a 3% lower offer ($160k) is reasonable based on typical stale-listing flexibility.
Risks & watch-outs
- Watch-outs: HOA is 21% of rent.
Questions for the listing agent
- It's been on market 40 days. Have you received any prior offers? Is the seller open to a 3% concession, seller financing, or rate buy-down credit?
- Built in 1973 — when were the roof, HVAC, electrical panel, plumbing, and water heater last replaced?
- What does the HOA fee cover, when was the last increase, and are there any pending special assessments or reserve-fund shortfalls?
- Any open or pending special assessments — roof, HVAC, plumbing, elevator, façade? What's the per-unit balance and payoff schedule, and is the seller paying it off at close or rolling it to the buyer?
- Is there a deadline driving the sale (1031 exchange, divorce, estate, relocation)? That informs how much negotiation room exists.
- Schools are F-rated, which usually means shorter tenancies and higher turnover. Who's the typical renter profile here, and what's been the actual vacancy rate?
- Crime grade is D in this area — have there been break-ins, vandalism, or insurance claims at this property in the last 3 years? What carrier currently insures it and at what premium?
- What's the average days-on-market for RENTAL listings here right now (not sales)? A rising rental-DOM trend means longer vacancies and softer asking-rent achievability than the comps imply.
- What's the recent tenant-quality profile in this submarket — average credit score on applications, eviction rate, late-payment / NSF rate, and stable-employment percentage? A property-management company in the area should have these aggregated.
- How much new apartment / multifamily construction is in the pipeline within 1–3 miles? Heavy new supply (>2% of stock underway) typically softens rents 12–24 months out; light construction supports rent growth.
Investment metrics
- 1% rule
- 1.50% ✓
- Cap rate
- 7.68%
- Cash-on-cash
- 4.96%
- DSCR
- 1.22
- GRM
- 5.6
CMA / ARV
No comps found within radius.
Projected returns pro-forma
-3.0% appreciation · 3.02% rent growth · sell at horizon
- IRR
- -8.3%
- Equity multiple
- 0.69×
- Total profit
- $-14,106
- Equity at exit
- $24,602
- IRR
- 1.6%
- Equity multiple
- 1.11×
- Total profit
- $5,290
- Equity at exit
- $14,266
Cash invested: $46,200 (down + closing). Projections, not guarantees.
Landlord ↔ Tenant lean methodology
- Overall (STATE)
- 21 Tenant-Leaning
- State New Jersey
- 21 Tenant-Leaning · D+6
- County
- — inherits STATE
- City
- — inherits STATE
ZIP-level market 08021
- Home prices YoY
- -31.6%
- Rents YoY
- 3.0%
- Active inventory
- 237
- Price-to-rent
- 5.6×
Monthly cashflow live
- Estimated rent
- $2,476 high interval (Pro) →
- Mortgage (P&I)
- −$865
- Tax from tax record
- −$310 /mo · $3,723/yr
- Insurance
- −$69
- HOA
- −$521
- Vacancy / Maint / Mgmt
- −$520
- Net cashflow
- $191
Break-even live
UW: 25.0% down · 7.5% · 30yr · 1.5% tax · 5.0% vac · 8.0% maint · 8.0% mgmt
Financing live
Cash to close
- Down payment
- $41,250
- Closing costs
- $4,950
- Reserves months
- —
- Total cash needed
- —
Loan-product check · same deal, 3 products live
Conventional
25% down · 7.5% · 30yr
- Down + closing
- —
- Monthly P&I
- —
- Monthly cashflow
- —
- DSCR
- —
- Eligible?
- —
Personal DTI + credit; lowest rate.
DSCR
20% down · 8.5% · 30yr
- Down + closing
- —
- Monthly P&I
- —
- Monthly cashflow
- —
- DSCR
- —
- Eligible?
- —
No personal income docs; deal must DSCR.
Hard money
10% down · 12.0% · 12mo
- Down + closing
- —
- Monthly P&I
- —
- Monthly cashflow
- —
- DSCR
- —
- Eligible?
- —
Short-term bridge; refi at stabilization.
Rent comps 8 comps
| Address | Beds | Baths | Sqft | Rent | $/sqft | DOM | Units | Dist |
|---|---|---|---|---|---|---|---|---|
| 1800 Laurel Rd Lindenwold, NJ | 1.0–2.0 | 1.0–2.0 | 885 | $2,072 | $2.34 | 1d | 22 | 0.21mi |
| 51 Chiswick Dr Unit 1 Lindenwold, NJ | 3.0 | 2.0 | 1110 | $2,650 | $2.39 | 1d | 1 | 0.27mi |
| 9 Georgetown Rd Lindenwold, NJ | 3.0 | 2.5 | 1268 | $2,600 | $2.05 | 1d | 1 | 0.36mi |
| 34 Heron Pl Clementon, NJ | 3.0 | 1.5 | 1847 | $2,500 | $1.35 | 1d | 1 | 0.80mi |
| 359 Lake Blvd Lindenwold, NJ | 3.0 | 2.0 | 1196 | $2,900 | $2.42 | 1d | 1 | 0.84mi |
| 302 Hidden Dr Blackwood, NJ | 3.0 | 3.5 | 2105 | $2,750 | $1.31 | 1d | 1 | 0.95mi |
| 215 S Atlantic Ave E Stratford, NJ | 3.0 | 1.0 | 1460 | $2,445 | $1.67 | 10d | 1 | 1.41mi |
| 16 W Linden Ave Lindenwold, NJ | 4.0 | 1.0 | 1560 | $2,950 | $1.89 | 1d | 1 | 1.49mi |
HOA detail condo
- Monthly dues
- $521 · $6,252/yr
- Likely covers
- pool
- Assessments
- None detected in remarks — confirm with the listing agent.
Listing history 3 events
-
2026-04-02status Pending
-
2026-03-30historical Active Under Contract
-
2026-02-17$165,000 Active
ⓘ Source: listings_history table (triggers on properties + properties_extension) + one-shot
backfill from property_details.listing_events for pre-trigger history.
Tax reassessment forecast NJ · Partial reset (capped growth)
- Current annual tax
- $3,723 · $310/mo
- Projected year-2 tax
- $3,916 · $326/mo
- Expected delta
- +$193/yr (+$16/mo · 5.2%)
ⓘ Screening estimate from a state-policy table — verify with the county assessor before closing.
Nearby sold comps map
Loading sold comps map…
Walkable amenities ~0.75 mi
Loading nearby amenities…
Taxation est. · year 1
- Rental income
- $29,715
- − Mortgage interest
- −$9,243
- − Property taxes
- −$3,723
- − Insurance
- −$825
- − Repairs & maintenance
- −$2,377
- − Management
- −$2,377
- − HOA
- −$6,252
- − Depreciation
- −$4,800
- Taxable income
- $117
- Est. tax owed @ 24.0%
- −$28
- After-tax cash flow
- $2,263/yr
For passive investors: Depreciation is non-cash, so a rental often shows a tax loss while cash-flowing — sheltering income. Rental losses are passive: they offset passive income freely, and up to $25,000/yr can offset ordinary (W-2) income if you actively participate and your MAGI is under $100k (phasing out to $0 by $150k); unused losses carry forward. On sale, claimed depreciation is recaptured at up to 25%, and gains may owe capital-gains tax (a 1031 exchange can defer both). Figures are a year-1 estimate at your 24.0% rate — not tax advice; consult a CPA.
Schools (NCES district)
- District
- Lindenwold Public School District
- NCES district ID
- 3408640
- Math proficiency
- 4% ▼ -8.00%
- Reading proficiency
- 25% ▲ 6.00%
- Median HH income
- $42,390
- Composite
- 12.54/100
- National rank
- #9622
- State rank
- #461 of 472 in NJ
Livability — Lindenwold
- Score
- 68/100
- State rank
- #312
- US rank
- #9603
Category grades
Schools grade is shown separately in the Schools card above.
Census & demographics
- Census place
- Lindenwold, NJ
- County
- Camden County · 407,624 people
- City population
- 49,305
- Metro
- Philadelphia-Camden-Wilmington, PA-NJ-DE-MD
- Population (ZIP)
- 49,305
- Household income
- $68,044
- Rent vs Own
- Severe rent burden
- 3050.0
Population outlook (Camden County) Hauer SSP2
- Today (2025)
- 507,964 people
- By 2030
- 502,182 · -1.1%
- By 2040
- 485,602 · -4.4%
- By 2050
- 465,630 · -8.3%
- By 2075
- 419,986 · -17.3%
- By 2100
- 369,492 · -27.3%
Race, ethnicity, and origin ACS 2023
- Neighborhood character
- Diverse neighborhood (Simpson 0.69)
- Race & ethnicity
- White 44% Black 27% Hispanic / Latino 20% Two or more races 11% Asian 3%
- Hispanic origin (detail)
- Mexican 4% Puerto Rican 6% Dominican 2%
- Common ancestry
- Romanian 3% Lithuanian 1% Iranian 1%
- Foreign-born
- 12% · Canada, China, Vietnam
- Languages at home
- 81% English-only · Spanish 14% Chinese 1% Tagalog/Filipino 1%
Political lean MEDSL · Camden
- 2024 margin
- Strong D (+27.4) · D 63.0% · R 35.5% · Other 1.5%
- 2008→2024 swing
- -8.8pp toward R · 2008: 36.2pp · 2024: 27.4pp
- All cycles
- 2024: D+27.4 2020: D+33.5 2016: D+32.4 2012: D+36.6 2008: D+36.2
Not yet ingested
- Civics
- —
Market trends
- HPI YoY
- ▼ -156.73%
- Current HPI
- 338.8351
- Rent YoY
- ▲ 3.02%
- Metro
- Philadelphia-Camden-Wilmington, PA-NJ-DE-MD
- State GDP YoY
- ▲ 2.05%
- F500 in state
- 34
Industry mix (Fortune 500 HQ in NJ)
| Industry | F500 HQs | Revenue |
|---|---|---|
| Consumer Goods | 3 | $31B |
|
||
| Pharmaceuticals | 2 | $153B |
|
||
| Technology | 2 | $21B |
|
||
| Insurance | 2 | $20B |
|
||
| Healthcare | 2 | $19B |
|
||
| Financial Services | 1 | $70B |
|
||
Price history
3 events — show timeline
- 2026-04-02 Pending — BRIGHT MLS
- 2026-03-30 Contingent — BRIGHT MLS
- 2026-02-17 Listed $165,000 BRIGHT MLS
Property tax history
+0.6%/yrLatest (2025): $3,723 · +0.5% YoY. Source: county tax records.
Cash-flow waterfall
monthlySold comps — $/sqft
last 12 mo · ≤1 miLoading sold comps…