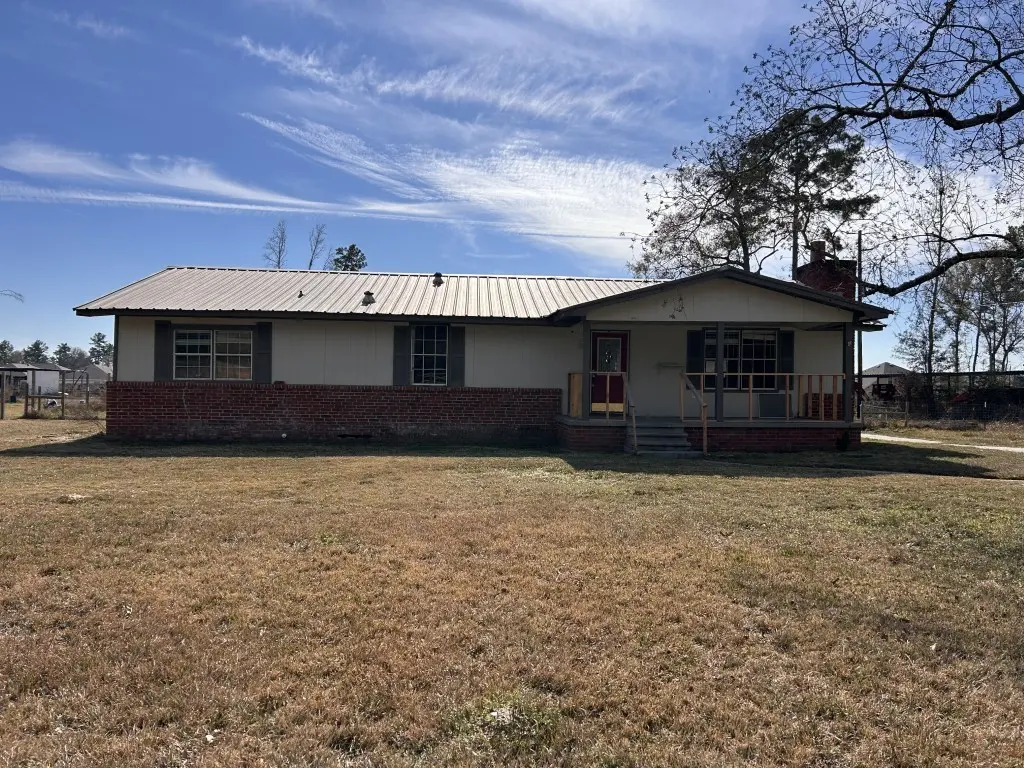
23656 Charterwood Dr · Patton Village, TX
Flood risk 1/10 · Minimal
- FEMA flood zone
- X (unshaded)
- Chance of flooding over 30 yrs
- 0.0%
- Est. flood insurance / yr
- $507 – $1,088
Fire risk 3/10 · Minor
- Est. fire insurance / yr
- $1,222 – $2,270
Heat risk 8/10 · Major
- Hot days now (above 110°F)
- 7 days/yr
- Hot days in 30 yrs
- 24 days/yr
Wind risk 8/10 · Major
- Chance of severe wind over 30 yrs
- 99.0%
Air-quality risk 2/10 · Minimal
- Unhealthy air days now
- 2 days/yr
- Unhealthy air days in 30 yrs
- 2 days/yr
Risk factors via First Street. Map © Google.
Why this score? — see what drove the D grade
The composite is a weighted blend of 9 inputs, each scored 0–100. Each bar is that input's sub-score; the figure is the points it added to the 100-point composite (weight × sub-score).
- ARV discount +15.0/15.0
- Cash flow +8.4/30.0
- 1% rule +4.4/10.0
- Livability +3.1/5.0
- Rent growth +2.5/5.0
- Schools +2.5/10.0
- Condition / age +2.5/5.0
- DSCR +2.3/10.0
- Appreciation +1.8/10.0
$195,200
🖨 Deal sheet (PDF) 📄 Offer letter ✓ Due diligence
Listing remarks MLS
HUD homes are sold “as is”. HUD Case #512-500634. 3 bedrooms, 2 baths on just over 1.5 acres. Tons of space and detached 2 car garage/wprkshop. No representation is made to information provided including taxes, sqft, schools, features, etc. Buyer must verify all information.
Key facts
- 1.55 acre lot
- 2 garage spots
- Built 1987
Neighborhood map
What this means for you Summary
Snapshot
- This is a 3-bed/1.0-bath single-family listed at $195k.
Deal economics
- At list price, monthly cash flow is $-175 ($-2k/yr) — negative.
- To cash-flow at today's rent, offer at most $164k (15.9% below list).
- To meet the 1% rule (rent ≥ 1% of price), the offer needs to be $184k (5.9% below list).
- Recommended offer: $164k (15.9% below list) — sets the bar for cash-flow.
Location & tenants
- Location reads 61/100 on livability (#977 in TX) — a middle-class / working-renter tenant base. Strengths: crime A+, cost of living A+, housing A+; Watch: amenities F, commute F, health & safety F.
- Splendora ISD (rural): math 25% / reading 31% proficiency, ranked #648 of 826 in TX (top 78%) — low school quality limits family demand, transient renter base, plan for 1-2y turnover.
- Zoned schools: Piney Woods El (math 23% / reading 28%, grade F, #2,982 of 4,322 statewide, top 70%, 534 students, 55% FRL); Splendora J H (math 28% / reading 42%, grade F, #842 of 1,662 statewide, top 51%, 774 students, 62% FRL); Splendora H S (math 18% / reading 38%, grade F, #1,170 of 1,632 statewide, top 72%, 1,344 students, 59% FRL) — zoned schools at 59% FRL track the district average.
- Market conditions: 548 active listings in the ZIP; 1 comparable units currently listed for rent nearby; solid renter incomes; 13,259 units permitted in Montgomery County in 2024 (1,402 in 5+ unit buildings).
Forward outlook
- Local home prices are declining (-3.0%/yr); year-one equity from $1k of loan paydown is wiped out by about $6k of value loss. Plan a longer hold.
- Montgomery County population projected at +65% by 2050 — long-run rental-demand tailwind backs the buy-and-hold thesis.
Negotiation context
- It's been on market 144 days — a 12% lower offer ($172k) is reasonable based on typical stale-listing flexibility.
- 5 sale attempts since 20y ago; this cycle's ask has dropped $115k (37%) from the opening price — seller is motivated, your offer sets the floor, not the list.
Risks & watch-outs
- Watch-outs: property tax is 3.2% of price.
- Climate carrying-cost: severe wind risk, 99% chance of damaging wind over 30y; extreme-heat days projected 7→24/yr by 2055 (HVAC capex compounding) — expect insurance premiums to compound above CPI over the hold.
Questions for the listing agent
- What do current leases actually rent for vs. the listed asking? Can we see a recent rent roll and the last 12 months of T-12 income?
- It's been on market 144 days. Have you received any prior offers? Is the seller open to a 16% concession, seller financing, or rate buy-down credit?
- Property tax is high relative to price — has the assessment been appealed recently, and will the sale trigger a re-assessment?
- Why hasn't it sold? Are there any deal-killer items the seller is aware of (foundation, flood, title, zoning, code violations)?
- Is there a deadline driving the sale (1031 exchange, divorce, estate, relocation)? That informs how much negotiation room exists.
- Schools are F-rated, which usually means shorter tenancies and higher turnover. Who's the typical renter profile here, and what's been the actual vacancy rate?
- The area grade is low — what's the realistic commute time and amenity access for the typical tenant pool here? Any planned neighborhood developments (good or bad) we should know about?
- What's the average days-on-market for RENTAL listings here right now (not sales)? A rising rental-DOM trend means longer vacancies and softer asking-rent achievability than the comps imply.
- What's the recent tenant-quality profile in this submarket — average credit score on applications, eviction rate, late-payment / NSF rate, and stable-employment percentage? A property-management company in the area should have these aggregated.
- How much new for-sale + rental construction is in the pipeline within 1–3 miles? Heavy new supply typically softens prices + rents 12–24 months out; constrained supply supports both.
Investment metrics
- 1% rule
- 0.94% ✗
- Cap rate
- 5.22%
- Cash-on-cash
- -3.85%
- DSCR
- 0.83
- GRM
- 8.9
CMA / ARV
- ARV (median comp)
- $276,056
- List price
- $195,200
- Delta
- -29.29%
- Verdict
- UNDERPRICED
- Comps
- 20 within 1.0 mi
Show comp detail 12 sales within ~0.75 mi
| Address | Dist | Beds/Ba | Sqft | Sold | Price | $/sf | Match |
|---|---|---|---|---|---|---|---|
| 17085 Pinewood Branch Dr | 0.12mi | 4/2.0 (+1) | 1,872 (-2%) | 3mo | $290,990 | $155 | 79 |
| 22632 Hackberry Leaf Dr | 0.30mi | 4/2.0 (+1) | 1,872 (-2%) | 1mo | $284,990 | $152 | 72 |
| 16923 Pin Cherry Leaf Dr | 0.14mi | 4/3.0 (+1) | 2,040 (+6%) | 1mo | $295,990 | $145 | 69 |
| 17081 Pinewood Branch Dr | 0.11mi | 4/2.0 (+1) | 1,732 (-10%) | 3mo | $268,990 | $155 | 67 |
| 22543 Pagoda Dogwood Branch Dr | 0.20mi | 4/2.0 (+1) | 1,732 (-10%) | 3mo | $270,990 | $156 | 63 |
| 22439 Douglas Ct | 0.34mi | 3/2.0 | 1,674 (-13%) | 1mo | $255,990 | $153 | 58 |
| 22491 Douglas Ct | 0.24mi | 4/2.0 (+1) | 1,689 (-12%) | 3mo | $250,990 | $149 | 57 |
| 22471 Douglas Ct | 0.28mi | 3/2.5 | 1,668 (-13%) | 3mo | $254,990 | $153 | 57 |
| 22455 Douglas Ct | 0.31mi | 3/2.5 | 1,668 (-13%) | 2mo | $252,990 | $152 | 56 |
| 22427 Douglas Ct | 0.37mi | 3/2.5 | 1,674 (-13%) | 2mo | $263,990 | $158 | 54 |
| 22361 Mountain Pine Dr | 0.50mi | 4/2.0 (+1) | 1,739 (-9%) | 0mo | $277,500 | $160 | 52 |
| 17202 Black Ash Ct | 0.41mi | 4/2.5 (+1) | 2,139 (+11%) | 1mo | $302,990 | $142 | 50 |
Match score weights: distance 35% · size 25% · config 20% · recency 20%. Top-matched comps best support the ARV.
Projected returns pro-forma
-3.0% appreciation · 3.0% rent growth · sell at horizon
- IRR
- -22.6%
- Equity multiple
- 0.22×
- Total profit
- $-42,589
- Equity at exit
- $29,105
- IRR
- -16.6%
- Equity multiple
- 0.07×
- Total profit
- $-50,646
- Equity at exit
- $16,877
Cash invested: $54,656 (down + closing). Projections, not guarantees.
Landlord ↔ Tenant lean methodology
- Overall (STATE)
- 87 Strongly Landlord-Friendly
- State Texas
- 87 Strongly Landlord-Friendly · R+5
- County
- — inherits STATE
- City
- — inherits STATE
ZIP-level market 77372
- Home prices YoY
- -2.1%
- Active inventory
- 548
- Price-to-rent
- 8.9×
Monthly cashflow live
- Estimated rent
- $1,837 medium interval (Pro) →
- Mortgage (P&I)
- −$1,024
- Tax from tax record
- −$521 /mo · $6,254/yr
- Insurance
- −$81
- HOA
- −$0
- Vacancy / Maint / Mgmt
- −$386
- Net cashflow
- $-175
Break-even live
Sensitivity live
| Price | -10% $-65 | -5% $-120 | +0% $-175 | +5% $-230 | +10% $-286 |
|---|---|---|---|---|---|
| Rent | -10% $-320 | -5% $-248 | +0% $-175 | +5% $-103 | +10% $-30 |
| Rate | -1.0pp $-77 | -0.5pp $-126 | base $-175 | +0.5pp $-226 | +1.0pp $-277 |
UW: 25.0% down · 7.5% · 30yr · 1.5% tax · 5.0% vac · 8.0% maint · 8.0% mgmt
Financing live
Cash to close
- Down payment
- $48,800
- Closing costs
- $5,856
- Reserves months
- —
- Total cash needed
- —
Loan-product check · same deal, 3 products live
Conventional
25% down · 7.5% · 30yr
- Down + closing
- —
- Monthly P&I
- —
- Monthly cashflow
- —
- DSCR
- —
- Eligible?
- —
Personal DTI + credit; lowest rate.
DSCR
20% down · 8.5% · 30yr
- Down + closing
- —
- Monthly P&I
- —
- Monthly cashflow
- —
- DSCR
- —
- Eligible?
- —
No personal income docs; deal must DSCR.
Hard money
10% down · 12.0% · 12mo
- Down + closing
- —
- Monthly P&I
- —
- Monthly cashflow
- —
- DSCR
- —
- Eligible?
- —
Short-term bridge; refi at stabilization.
Rent comps 1 comps
| Address | Beds | Baths | Sqft | Rent | $/sqft | DOM | Units | Dist |
|---|---|---|---|---|---|---|---|---|
| 21811 Hickory Springs Ct New Caney, TX | 4.0 | 2.0 | 1691 | $1,700 | $1.01 | 26d | 1 | 1.02mi |
Listing history 32 events
-
2026-06-21days on market $195,200 Active 144 DOM
-
2026-06-18days on market $195,200 Active 141 DOM
-
2026-06-17days on market $195,200 Active 140 DOM
-
2026-06-16days on market $195,200 Active 139 DOM
-
2026-06-15days on market $195,200 Active 138 DOM
-
2026-06-13days on market $195,200 Active 136 DOM
-
2026-06-13days on market $195,200 Active 135 DOM
-
2026-06-09days on market $195,200 Active 132 DOM
-
2026-06-08days on market $195,200 Active 131 DOM
-
2026-06-07days on market $195,200 Active 130 DOM
-
2026-06-04days on market $195,200 Active 127 DOM
-
2026-06-03days on market $195,200 Active 126 DOM
-
2026-06-02days on market $195,200 Active 125 DOM
-
2026-06-01days on market $195,200 Active 124 DOM
-
2026-05-31days on market $195,200 Active 123 DOM
-
2026-04-22price $220,000 288-char remark
Show marketing remark (288 chars)
HUD homes are sold “as is”. HUD Case #512-500634. 3 bedrooms, 2 baths on just over 1.5 acres. Tons of space and detached 2 car garage/wprkshop. No representation is made to information provided including taxes, sqft, schools, features, etc. Buyer must verify all information.
-
2026-03-18price $285,200 288-char remark
Show marketing remark (288 chars)
HUD homes are sold “as is”. HUD Case #512-500634. 3 bedrooms, 2 baths on just over 1.5 acres. Tons of space and detached 2 car garage/wprkshop. No representation is made to information provided including taxes, sqft, schools, features, etc. Buyer must verify all information.
-
2026-01-28$310,000 Active 288-char remark
Show marketing remark (288 chars)
HUD homes are sold “as is”. HUD Case #512-500634. 3 bedrooms, 2 baths on just over 1.5 acres. Tons of space and detached 2 car garage/wprkshop. No representation is made to information provided including taxes, sqft, schools, features, etc. Buyer must verify all information.
-
2023-08-16historical
-
2023-05-09$285,000 Active
-
2022-10-13soldstatus Sold
-
2022-10-13soldstatus
-
2022-09-07status Pending
-
2022-08-28status Option Pending
-
2022-08-24price $250,000
-
2022-07-25price $285,000
-
2022-07-16$299,000 Active
-
2022-07-14$299,000
-
2022-07-14historical
-
2020-12-18soldstatus
-
2006-09-26historical
-
2006-08-22$79,995
ⓘ Source: listings_history table (triggers on properties + properties_extension) + one-shot
backfill from property_details.listing_events for pre-trigger history.
Tax reassessment forecast TX · Resets to sale price
- Current annual tax
- $6,254 · $521/mo
- Projected year-2 tax
- $6,254 · $521/mo
- Expected delta
- $0/yr ($0/mo · 0.0%)
ⓘ Screening estimate from a state-policy table — verify with the county assessor before closing.
Climate risk First Street
- Flood 1/10 Low FEMA zone X (unshaded) · 0% chance over 30 yrs
- Wildfire 3/10 Moderate
- Heat 8/10 Severe 7 d/yr ≥110°F today · 24 d/yr by 30 yrs out
- Wind 8/10 Severe 99% chance of damaging wind over 30 yrs
- Air quality 2/10 Low 2 unhealthy d/yr today · 2 by 30 yrs out
Nearby sold comps map
Loading sold comps map…
Walkable amenities ~0.75 mi
Loading nearby amenities…
Taxation est. · year 1
- Rental income
- $22,040
- − Mortgage interest
- −$10,934
- − Property taxes
- −$6,254
- − Insurance
- −$976
- − Repairs & maintenance
- −$1,763
- − Management
- −$1,763
- − Depreciation
- −$5,679
- Taxable loss
- −$5,329
- Est. tax savings @ 24.0%
- +$1,279
- After-tax cash flow
- $-823/yr
For passive investors: Depreciation is non-cash, so a rental often shows a tax loss while cash-flowing — sheltering income. Rental losses are passive: they offset passive income freely, and up to $25,000/yr can offset ordinary (W-2) income if you actively participate and your MAGI is under $100k (phasing out to $0 by $150k); unused losses carry forward. On sale, claimed depreciation is recaptured at up to 25%, and gains may owe capital-gains tax (a 1031 exchange can defer both). Figures are a year-1 estimate at your 24.0% rate — not tax advice; consult a CPA.
Schools (NCES district)
- District
- Splendora ISD
- NCES district ID
- 4841070
- Math proficiency
- 25% ▼ -8.00%
- Reading proficiency
- 31% ▼ -1.00%
- Median HH income
- $54,166
- Composite
- 24.92/100
- National rank
- #7572
- State rank
- #648 of 826 in TX
Livability — Patton Village
- Score
- 61/100
- State rank
- #977
- US rank
- #17313
Category grades
Schools grade is shown separately in the Schools card above.
Census & demographics
- County
- Montgomery County · 663,713 people
- Metro
- Houston-The Woodlands-Sugar Land, TX
- Population (ZIP)
- 14,367
- Household income
- $79,085
- Rent vs Own
- Severe rent burden
- 135.0
Population outlook (Montgomery County) Hauer SSP2
- Today (2025)
- 713,896 people
- By 2030
- 805,263 · +12.8%
- By 2040
- 992,708 · +39.1%
- By 2050
- 1,179,590 · +65.2%
- By 2075
- 1,628,084 · +128.1%
- By 2100
- 1,937,880 · +171.5%
Race, ethnicity, and origin ACS 2023
- Neighborhood character
- Majority White (61%)
- Race & ethnicity
- White 61% Hispanic / Latino 36% Two or more races 9% Native American 1%
- Hispanic origin (detail)
- Mexican 32%
- Common ancestry
- Lithuanian 4% Italian 2% Slovak 1%
- Foreign-born
- 9% · Canada
- Languages at home
- 71% English-only · Spanish 28%
Political lean MEDSL · Montgomery
- 2024 margin
- Solid R (+45.5) · D 26.8% · R 72.3%
- 2008→2024 swing
- +7.2pp toward D · 2008: -52.7pp · 2024: -45.5pp
- All cycles
- 2024: R+45.5 2020: R+43.8 2016: R+51.4 2012: R+60.7 2008: R+52.7
Not yet ingested
- Civics
- —
Market trends
- HPI YoY
- ▼ -6.47%
- Current HPI
- 306.9962
- Rent YoY
- —
- Metro
- Houston-The Woodlands-Sugar Land, TX
- State GDP YoY
- ▲ 3.95%
- F500 in state
- 110
Industry mix (Fortune 500 HQ in TX)
| Industry | F500 HQs | Revenue |
|---|---|---|
| Energy | 16 | $1,198B |
|
||
| Technology | 5 | $198B |
|
||
| Engineering / Construction | 4 | $72B |
|
||
| Energy Services | 3 | $60B |
|
||
| Utilities | 3 | $41B |
|
||
| Healthcare | 2 | $330B |
|
||
Price history
+175.0% since first listed17 events — show timeline
- 2026-04-22 Price Changed $220,000 HARMLS
- 2026-03-18 Price Changed $285,200 HARMLS
- 2026-01-28 Listed $310,000 HARMLS
- 2023-08-16 Listing Removed — HARMLS
- 2023-05-09 Listed $285,000 HARMLS
- 2022-10-13 Sold (Public Records) — Public Records
- 2022-10-13 Sold (MLS) — HARMLS
- 2022-09-07 Pending — HARMLS
- 2022-08-28 Pending — HARMLS
- 2022-08-24 Price Changed $250,000 HARMLS
- 2022-07-25 Price Changed $285,000 HARMLS
- 2022-07-16 Listed $299,000 HARMLS
- 2022-07-14 Listing Removed — HARMLS
- 2022-07-14 Listed $299,000 HARMLS
- 2020-12-18 Sold (Public Records) — Public Records
- 2006-09-26 Listing Removed — HARMLS
- 2006-08-22 Listed $79,995 HARMLS
Property tax history
+13.2%/yrLatest (2025): $6,254 · +9.8% YoY. Source: county tax records.
Cash-flow waterfall
monthlySold comps — $/sqft
last 12 mo · ≤1 miLoading sold comps…