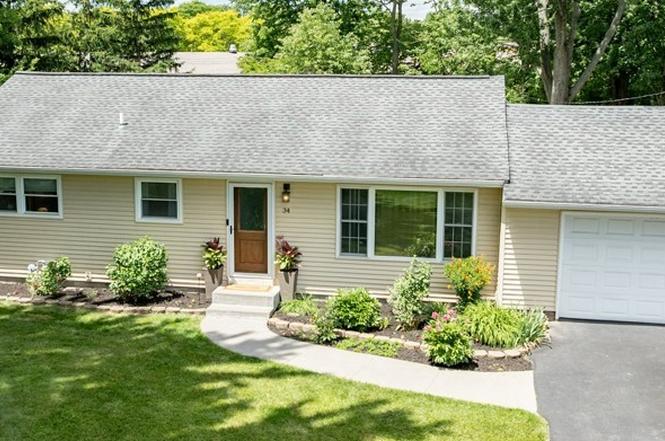
34 Faircrest Rd · Brighton, NY
Flood risk 1/10 · Minimal
- FEMA flood zone
- X (unshaded)
- Chance of flooding over 30 yrs
- 0.0%
- Est. flood insurance / yr
- $473 – $860
Fire risk 3/10 · Minor
- Est. fire insurance / yr
- $691 – $1,283
Heat risk 2/10 · Minimal
- Hot days now (above 96°F)
- 7 days/yr
- Hot days in 30 yrs
- 15 days/yr
Wind risk 1/10 · Minimal
- Chance of severe wind over 30 yrs
- —
Air-quality risk 2/10 · Minimal
- Unhealthy air days now
- 1 days/yr
- Unhealthy air days in 30 yrs
- 1 days/yr
Risk factors via First Street. Map © Google.
Why this score? — see what drove the C grade
The composite is a weighted blend of 9 inputs, each scored 0–100. Each bar is that input's sub-score; the figure is the points it added to the 100-point composite (weight × sub-score).
- Cash flow +16.5/30.0
- ARV discount +15.0/15.0
- 1% rule +5.8/10.0
- Schools +5.2/10.0
- DSCR +5.1/10.0
- Rent growth +4.0/5.0
- Livability +4.0/5.0
- Condition / age +2.5/5.0
- Appreciation +0.0/10.0
$199,900
🖨 Deal sheet 📄 Offer letter ✓ Due diligence
Listing remarks MLS
Great 3 Bedroom, 2 full bath Ranch home situated on an oversized lot & loaded with updates! Newer Kitchen with seated island is completely open to the Living Room, while the Family Room has been completely gutted & refinished with tray ceiling, recessed lights & built-in speakers! Master suite with brand new private bath & large closet area! Remodeled 2nd bath; Finished office in the basement; Central Air; 6 panel doors throughout; fully fenced back yard with private patio; attached garage. Tear-off roof in 2008, Furnace in 2013, Water Heater in 2008; Vinyl siding in 2013; Vinyl replacement windows & glass block windows; New sewer line in 2013.. . the list goes on!
Key facts
- Double wide foyer
- Tray ceiling
- Recessed lighting
Tags
Property features AI
Exterior
- Parking: Attached, heated garage with electricity, storage space; Driveway parking
- Utilities: High-speed internet available; Public water (connected); Sewer connected; Circuit breaker electrical service; Gas water heater
- Home design: Single-story home; Entry foyer
- Construction: Vinyl siding; Asphalt roof; Block foundation; Copper and PEX plumbing; Existing (resale) property
- Exterior features: Patio; Fully fenced yard; Blacktop driveway; Rectangular residential lot near public transit; City street frontage
Interior
- Kitchen: Gas oven; Gas range; Microwave; Dishwasher; Garbage disposal; Refrigerator; Eat-in kitchen with pantry
- Bedrooms: Three main-level bedrooms
- Flooring: Luxury vinyl; Tile; Varies
- Bathrooms: Two full bathrooms (both on the main level)
- Heating & cooling: Gas heat (forced air and gravity); Central air conditioning
- Interior features: Ceiling fans; Den; Entrance foyer; Eat-in kitchen; Separate/formal living room; Home office; Pantry; Primary suite; Workshop; Main-level primary bedroom; Bedroom on main level
- Laundry & utility: Washer and dryer; Laundry located in the basement
Neighborhood map
What this means for you Summary
Snapshot
- This is a 3-bed/1.0-bath single-family listed at $200k.
Deal economics
- At list price, monthly cash flow is $116 ($1k/yr) — positive.
- The deal already cash-flows at list — no discount required.
- Meets the 1% rule at list price ($2k rent vs $200k).
- Cap rate 7.0% vs local median 3.9% in Brighton — top-decile yield for the area; either an underpriced asset or a hidden risk that comps aren't pricing in. Stress-test before assuming the spread holds.
Location & tenants
- Location reads 81/100 on livability (#89 in NY, #1,379 nationally) — a professional / high-income tenant draw. Strengths: housing A+, health & safety A+, schools B+; Watch: crime D+, amenities D-.
- Rush-Henrietta Central School District (suburban): math 62% / reading 57% proficiency, ranked #237 of 590 in NY (top 40%) — acceptable for families but not a draw, mixed tenant base, ~2y average lease.
- Market conditions: Rents rising fast (+6.1%/yr); 48 active listings in the ZIP; 4 comparable units currently listed for rent nearby; rentals leasing fast (median 3d on market — plan ~1-2 weeks tenant-placement turnaround); 1,169 units permitted in Monroe County in 2024 (591 in 5+ unit buildings).
- This rent runs 40% of the median local income ($65k/yr) — at the standard rent-burdened threshold; future hikes will face affordability resistance.
Forward outlook
- Local home prices are declining (-3.0%/yr); year-one equity from $1k of loan paydown is wiped out by about $6k of value loss. Plan a longer hold.
- Monroe County population projected to shrink 6% by 2050 — rents likely to lag national; underwrite the cash flow, not the appreciation.
Negotiation context
- Only 8 days on market — expect competitive offers; lowballing is unlikely to land.
- 2 sale attempts since 10y ago with the ask held roughly flat each time — persistent listings suggest the price (not the market) is what's stuck; bring a comps-based counter.
- Current owner paid $139k; 44% above their basis — modest negotiation headroom, anchor on the comps not their cost.
Risks & watch-outs
- Watch-outs: property tax is 2.8% of price; built in 1955 — expect roof / HVAC / electrical / plumbing capex.
Questions for the listing agent
- Built in 1955 — when were the roof, HVAC, electrical panel, plumbing, and water heater last replaced?
- Property tax is high relative to price — has the assessment been appealed recently, and will the sale trigger a re-assessment?
- Is there a deadline driving the sale (1031 exchange, divorce, estate, relocation)? That informs how much negotiation room exists.
- Schools are B-rated — typically a magnet for longer-tenancy family renters. What's the average tenant stay here, and is there a school-zone premium baked into asking?
- Crime grade is D in this area — have there been break-ins, vandalism, or insurance claims at this property in the last 3 years? What carrier currently insures it and at what premium?
- What's the average days-on-market for RENTAL listings here right now (not sales)? A rising rental-DOM trend means longer vacancies and softer asking-rent achievability than the comps imply.
- What's the recent tenant-quality profile in this submarket — average credit score on applications, eviction rate, late-payment / NSF rate, and stable-employment percentage? A property-management company in the area should have these aggregated.
- How much new for-sale + rental construction is in the pipeline within 1–3 miles? Heavy new supply typically softens prices + rents 12–24 months out; constrained supply supports both.
Investment metrics
- 1% rule
- 1.08% ✓
- Cap rate
- 6.99%
- Cash-on-cash
- 2.49%
- DSCR
- 1.11
- GRM
- 7.7
CMA / ARV
- ARV (on-the-fly)
- $251,945
- Comps found
- 12
Show comp detail 12 sales within ~0.75 mi
| Address | Dist | Beds/Ba | Sqft | Sold | Price | $/sf | Match |
|---|---|---|---|---|---|---|---|
| 289 Hollybrook Rd | 0.12mi | 3/1.0 | 1,224 (-0%) | 12mo | $241,000 | $197 | 84 |
| 83 Greenbrier Ln | 0.33mi | 3/1.0 | 1,160 (-6%) | 8mo | $240,000 | $207 | 69 |
| 160 Finucane Rd | 0.38mi | 3/1.0 | 1,288 (+5%) | 8mo | $205,000 | $159 | 68 |
| 173 Hollybrook Rd | 0.34mi | 3/1.5 | 1,324 (+8%) | 6mo | $150,000 | $113 | 64 |
| 1168 Calkins Rd | 0.58mi | 3/1.5 | 1,265 (+3%) | 6mo | $250,000 | $198 | 61 |
| 199 Castle Rd | 0.41mi | 3/1.0 | 1,050 (-15%) | 2mo | $226,000 | $215 | 55 |
| 172 Hollybrook Rd | 0.34mi | 3/1.0 | 1,069 (-13%) | 9mo | $235,000 | $220 | 55 |
| 40 Birchbrook Dr | 0.60mi | 3/1.5 | 1,152 (-6%) | 9mo | $192,000 | $167 | 52 |
| 15 Palamino Dr | 0.70mi | 3/1.0 | 1,320 (+7%) | 8mo | $280,000 | $212 | 48 |
| 93 Lalanne Rd | 0.55mi | 3/2.0 | 1,386 (+13%) | 7mo | $296,000 | $214 | 43 |
| 115 Bradford Rd | 0.53mi | 3/1.5 | 1,392 (+13%) | 11mo | $285,000 | $205 | 42 |
| 36 Hartwood Dr | 0.67mi | 3/2.0 | 1,394 (+13%) | 7mo | $205,000 | $147 | 36 |
Match score weights: distance 35% · size 25% · config 20% · recency 20%. Top-matched comps best support the ARV.
Projected returns pro-forma
-3.0% appreciation · 6.06% rent growth · sell at horizon
- IRR
- -8.4%
- Equity multiple
- 0.68×
- Total profit
- $-17,953
- Equity at exit
- $29,806
- IRR
- 5.1%
- Equity multiple
- 1.44×
- Total profit
- $24,575
- Equity at exit
- $17,284
Cash invested: $55,972 (down + closing). Projections, not guarantees.
Landlord ↔ Tenant lean methodology
- Overall (STATE)
- 15 Strongly Tenant-Friendly
- State New York
- 15 Strongly Tenant-Friendly · D+10
- County
- — inherits STATE
- City
- — inherits STATE
ZIP-level market 14623
- Rents YoY
- 6.1%
- Active inventory
- 48
- Price-to-rent
- 7.7×
Monthly cashflow live
- Estimated rent
- $2,164 medium interval (Pro) →
- Mortgage (P&I)
- −$1,048
- Tax from tax record
- −$462 /mo · $5,539/yr
- Insurance
- −$83
- HOA
- −$0
- Vacancy / Maint / Mgmt
- −$454
- Net cashflow
- $116
Break-even live
UW: 25.0% down · 7.5% · 30yr · 1.5% tax · 5.0% vac · 8.0% maint · 8.0% mgmt
Financing live
Cash to close
- Down payment
- $49,975
- Closing costs
- $5,997
- Reserves months
- —
- Total cash needed
- —
Loan-product check · same deal, 3 products live
Conventional
25% down · 7.5% · 30yr
- Down + closing
- —
- Monthly P&I
- —
- Monthly cashflow
- —
- DSCR
- —
- Eligible?
- —
Personal DTI + credit; lowest rate.
DSCR
20% down · 8.5% · 30yr
- Down + closing
- —
- Monthly P&I
- —
- Monthly cashflow
- —
- DSCR
- —
- Eligible?
- —
No personal income docs; deal must DSCR.
Hard money
10% down · 12.0% · 12mo
- Down + closing
- —
- Monthly P&I
- —
- Monthly cashflow
- —
- DSCR
- —
- Eligible?
- —
Short-term bridge; refi at stabilization.
Rent comps 4 comps
| Address | Beds | Baths | Sqft | Rent | $/sqft | DOM | Units | Dist |
|---|---|---|---|---|---|---|---|---|
| 2001-2055 E Henrietta Rd Rochester, NY | 2.0 | 1.0 | 650 | $1,525 | $2.35 | 3d | 8 | 0.81mi |
| 1656 Jefferson Rd Rochester, NY | 3.0 | 2.0 | 1050 | $2,500 | $2.38 | 44d | 1 | 0.99mi |
| 168 Surrey Hill Way Rochester, NY | 2.0 | 1.5 | 1008 | $1,700 | $1.69 | 3d | 1 | 1.15mi |
| 2655 Brighton Henrietta Town Line Rd Rochester, NY | 1.0–2.0 | 1.0 | 769 | $1,870 | $2.43 | 3d | 6 | 1.33mi |
Listing history 7 events
-
2026-06-18status $199,900 Pending 8 DOM
-
2026-06-18days on market $199,900 Active 8 DOM
-
2026-06-17days on market $199,900 Active 7 DOM
-
2026-06-16days on market $199,900 Active 6 DOM
-
2026-06-15days on market $199,900 Active 5 DOM
-
2026-06-13remarks 665-char remark
-
2026-06-13$199,900 Active 3 DOM
ⓘ Source: listings_history table (triggers on properties + properties_extension) + one-shot
backfill from property_details.listing_events for pre-trigger history.
Tax reassessment forecast NY · Partial reset (capped growth)
- Current annual tax
- $5,539 · $462/mo
- Projected year-2 tax
- $5,539 · $462/mo
- Expected delta
- $0/yr ($0/mo · 0.0%)
ⓘ Screening estimate from a state-policy table — verify with the county assessor before closing.
Climate risk First Street
- Flood 1/10 Low FEMA zone X (unshaded) · 0% chance over 30 yrs
- Wildfire 3/10 Moderate
- Heat 2/10 Low 7 d/yr ≥96°F today · 15 d/yr by 30 yrs out
- Wind 1/10 Low
- Air quality 2/10 Low 1 unhealthy d/yr today · 1 by 30 yrs out
Nearby sold comps map
Loading sold comps map…
Walkable amenities ~0.75 mi
Loading nearby amenities…
Taxation est. · year 1
- Rental income
- $25,967
- − Mortgage interest
- −$11,198
- − Property taxes
- −$5,539
- − Insurance
- −$1,000
- − Repairs & maintenance
- −$2,077
- − Management
- −$2,077
- − Depreciation
- −$5,815
- Taxable loss
- −$1,739
- Est. tax savings @ 24.0%
- +$417
- After-tax cash flow
- $1,813/yr
For passive investors: Depreciation is non-cash, so a rental often shows a tax loss while cash-flowing — sheltering income. Rental losses are passive: they offset passive income freely, and up to $25,000/yr can offset ordinary (W-2) income if you actively participate and your MAGI is under $100k (phasing out to $0 by $150k); unused losses carry forward. On sale, claimed depreciation is recaptured at up to 25%, and gains may owe capital-gains tax (a 1031 exchange can defer both). Figures are a year-1 estimate at your 24.0% rate — not tax advice; consult a CPA.
Schools (NCES district)
- District
- Rush-Henrietta Central School District
- NCES district ID
- 3625170
- Math proficiency
- 62% ▼ -6.00%
- Reading proficiency
- 57% ▲ 1.00%
- Median HH income
- $58,682
- Composite
- 51.52/100
- National rank
- #1720
- State rank
- #237 of 590 in NY
Livability — Brighton
- Score
- 81/100
- State rank
- #89
- US rank
- #1379
Category grades
Schools grade is shown separately in the Schools card above.
Census & demographics
- County
- Monroe County · 674,131 people
- City population
- 38,703
- Metro
- Rochester, NY
- Population (ZIP)
- 26,032
- Household income
- $65,342
- Rent vs Own
- Severe rent burden
- 1161.0
Population outlook (Monroe County) Hauer SSP2
- Today (2025)
- 759,460 people
- By 2030
- 757,154 · -0.3%
- By 2040
- 740,644 · -2.5%
- By 2050
- 714,443 · -5.9%
- By 2075
- 645,883 · -15.0%
- By 2100
- 547,084 · -28.0%
Race, ethnicity, and origin ACS 2023
- Neighborhood character
- Predominantly White (67%)
- Race & ethnicity
- White 67% Asian 15% Black 8% Two or more races 6% Hispanic / Latino 6%
- Hispanic origin (detail)
- Puerto Rican 3%
- Common ancestry
- Romanian 4% Iranian 2% Lithuanian 2%
- Foreign-born
- 14% · China, Canada, Vietnam
- Languages at home
- 84% English-only · Chinese 4% Other Indo-European 3% Spanish 2%
Political lean MEDSL · Monroe
- 2024 margin
- D (+19.1) · D 59.5% · R 40.5%
- 2008→2024 swing
- +1.4pp toward D · 2008: 17.7pp · 2024: 19.1pp
- All cycles
- 2024: D+19.1 2020: D+21.0 2016: D+14.1 2012: D+17.4 2008: D+17.7
Not yet ingested
- Civics
- —
Market trends
- HPI YoY
- ▼ -180.68%
- Current HPI
- 262.8187
- Rent YoY
- ▲ 6.06%
- Metro
- Rochester, NY
- State GDP YoY
- ▲ 2.60%
- F500 in state
- 92
Industry mix (Fortune 500 HQ in NY)
| Industry | F500 HQs | Revenue |
|---|---|---|
| Financial Services | 10 | $950B |
|
||
| Consumer Goods | 9 | $162B |
|
||
| Insurance | 4 | $225B |
|
||
| Telecommunications | 2 | $144B |
|
||
| Pharmaceuticals | 2 | $112B |
|
||
| Media / Entertainment | 2 | $69B |
|
||
Price history
+135.2% since first listed7 events — show timeline
- 2026-06-10 Listed $199,900 UNYREIS
- 2017-01-03 Sold (Public Records) $139,000 Public Records
- 2017-01-03 Sold (MLS) $139,000 UNYREIS
- 2016-11-21 Pending — UNYREIS
- 2016-11-12 Listed $139,000 UNYREIS
- 2008-09-04 Sold (Public Records) $87,500 Public Records
- 2002-11-13 Sold (Public Records) $85,000 Public Records
Property tax history
+5.6%/yrLatest (2025): $5,539 · +24.0% YoY. Source: county tax records.
Cash-flow waterfall
monthlySold comps — $/sqft
last 12 mo · ≤1 miLoading sold comps…