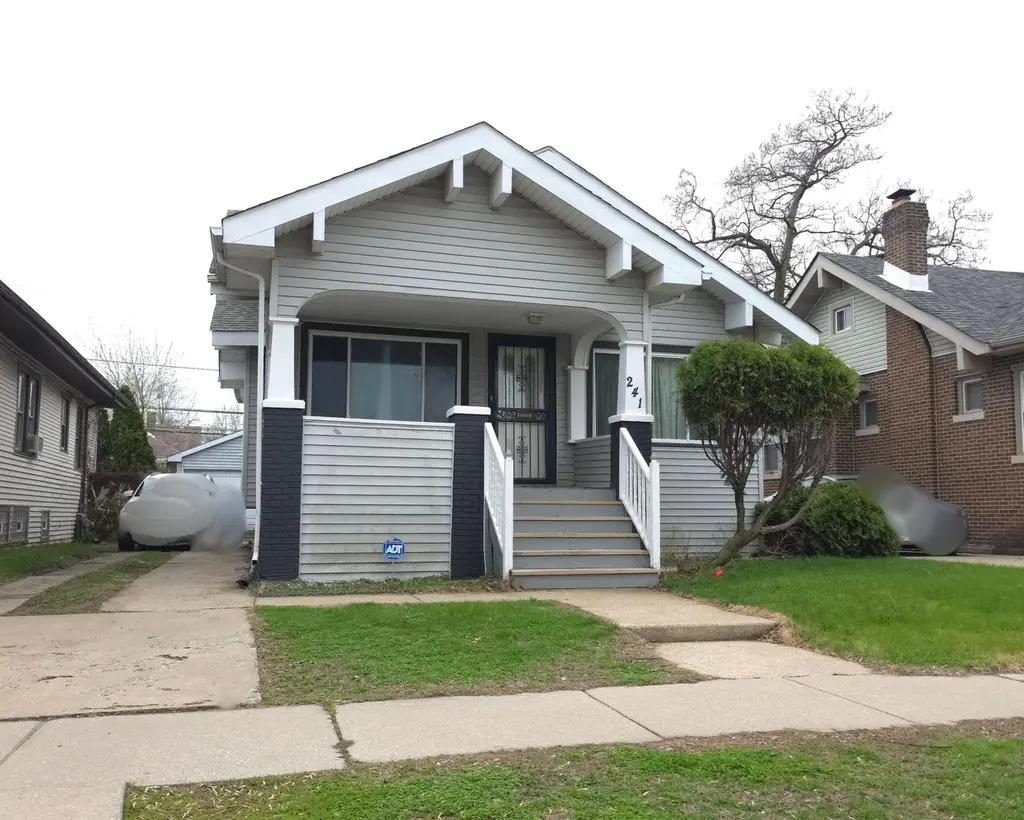
241 Webb St · Calumet City, IL
Flood risk 1/10 · Minimal
- FEMA flood zone
- X (unshaded)
- Chance of flooding over 30 yrs
- 0.0%
- Est. flood insurance / yr
- $473 – $860
Fire risk 1/10 · Minimal
- Est. fire insurance / yr
- $804 – $1,492
Heat risk 3/10 · Minor
- Hot days now (above 102°F)
- 7 days/yr
- Hot days in 30 yrs
- 15 days/yr
Wind risk 2/10 · Minimal
- Chance of severe wind over 30 yrs
- —
Air-quality risk 4/10 · Minor
- Unhealthy air days now
- 5 days/yr
- Unhealthy air days in 30 yrs
- 6 days/yr
Risk factors via First Street. Map © Google.
Why this score? — see what drove the C grade
The composite is a weighted blend of 9 inputs, each scored 0–100. Each bar is that input's sub-score; the figure is the points it added to the 100-point composite (weight × sub-score).
- Cash flow +22.2/30.0
- ARV discount +11.9/15.0
- 1% rule +7.3/10.0
- DSCR +7.1/10.0
- Rent growth +4.0/5.0
- Livability +3.6/5.0
- Condition / age +2.5/5.0
- Schools +1.0/10.0
- Appreciation +0.0/10.0
$134,900
🖨 Deal sheet (PDF) 📄 Offer letter ✓ Due diligence
Listing remarks MLS
Investor opportunity with immediate cash flow! This tenant-occupied 3 bedroom, 1.5 bath home offers a solid addition to any rental portfolio. The one story layout appeals to a wide range of tenants, while the full basement provides additional space plus a half bath. The property features a detached 2-car garage, increasing storage space and rental appeal, while a charming covered front porch add to the curb appeal. The roof and most basement windows were replaced in 2009, the water heater in 2021, and the stairs up front were new in 2023. With stable occupancy already in place, this is a turnkey investment opportunity with income from day one.
Key facts
- 4,838 sq ft lot
- 2 garage spots
- Built 1923
Property features AI
Finance
- HOA & community: No master association fee required
Exterior
- Parking: Detached garage; 2 garage spaces (2 total parking spaces)
- Utilities: Water from Lake Michigan / public water; Public sewer
- Home design: Detached single-family home; One-story; Fee simple ownership; Rehab completed in 2009; Property older than 100 years (built before 1978)
- Construction: Vinyl siding; Approximately 1,115 finished square feet
- Exterior features: Lot approximately 41 x 118; Lot less than 0.25 acre; Currently leased
Interior
- Kitchen: Kitchen on the main level (approx. 14 x 12)
- Bedrooms: 3 bedrooms (all on the main level); Master bedroom on the main level (approx. 13 x 11); Second bedroom on the main level (approx. 12 x 11); Third bedroom on the main level (approx. 10 x 10)
- Bathrooms: 1 full bathroom; 1 half bathroom; Basement has a bathroom
- Heating & cooling: Natural gas forced air heating; Central air conditioning
- Interior features: Partially finished, full basement; 6 total rooms
- Laundry & utility: Laundry room
Neighborhood map
What this means for you Summary
Snapshot
- This is a 3-bed/1.0-bath single-family listed at $135k.
Deal economics
- At list price, monthly cash flow is $221 ($3k/yr) — positive.
- The deal already cash-flows at list — no discount required.
- Meets the 1% rule at list price ($2k rent vs $135k).
- Recommended offer: $127k (6.0% below list) — sets the bar for market timing.
Location & tenants
- Location reads 71/100 on livability (#330 in IL) — a middle-class / working-renter tenant base. Strengths: commute A+, cost of living A+, housing A+; Watch: employment C-, schools F, crime D-.
- Thornton Fractional Twp Hsd 215 (suburban): math 9% / reading 13% proficiency, ranked #563 of 620 in IL (top 91%) — low school quality limits family demand, transient renter base, plan for 1-2y turnover.
- Market conditions: Rents rising fast (+6.2%/yr); 196 active listings in the ZIP; 13 comparable units currently listed for rent nearby; rentals at typical pace (median 18d on market — plan ~3-4 weeks tenant-placement turnaround); 6,272 units permitted in Cook County in 2024 (4,658 in 5+ unit buildings).
- This rent runs 36% of the median local income ($55k/yr) — at the standard rent-burdened threshold; future hikes will face affordability resistance.
Forward outlook
- Local home prices are declining (-3.0%/yr); year-one equity from $933 of loan paydown is wiped out by about $4k of value loss. Plan a longer hold.
- At projected returns (-3.0% appreciation + 6.2% rent growth), your $38k cash investment doubles in ~9 years — after that, you're playing with house money.
Negotiation context
- It's been on market 67 days — a 6% lower offer ($127k) is reasonable based on typical stale-listing flexibility.
- 4 sale attempts since 25y ago with the ask held roughly flat each time — persistent listings suggest the price (not the market) is what's stuck; bring a comps-based counter.
- Current owner paid $90k; 50% above their basis — modest negotiation headroom, anchor on the comps not their cost.
Risks & watch-outs
- Watch-outs: property tax is 2.9% of price; built in 1923 — expect roof / HVAC / electrical / plumbing capex.
Questions for the listing agent
- It's been on market 67 days. Have you received any prior offers? Is the seller open to a 6% concession, seller financing, or rate buy-down credit?
- Built in 1923 — when were the roof, HVAC, electrical panel, plumbing, and water heater last replaced?
- Property tax is high relative to price — has the assessment been appealed recently, and will the sale trigger a re-assessment?
- Why hasn't it sold? Are there any deal-killer items the seller is aware of (foundation, flood, title, zoning, code violations)?
- Is there a deadline driving the sale (1031 exchange, divorce, estate, relocation)? That informs how much negotiation room exists.
- Schools are F-rated, which usually means shorter tenancies and higher turnover. Who's the typical renter profile here, and what's been the actual vacancy rate?
- Crime grade is D in this area — have there been break-ins, vandalism, or insurance claims at this property in the last 3 years? What carrier currently insures it and at what premium?
- What's the average days-on-market for RENTAL listings here right now (not sales)? A rising rental-DOM trend means longer vacancies and softer asking-rent achievability than the comps imply.
- What's the recent tenant-quality profile in this submarket — average credit score on applications, eviction rate, late-payment / NSF rate, and stable-employment percentage? A property-management company in the area should have these aggregated.
- How much new for-sale + rental construction is in the pipeline within 1–3 miles? Heavy new supply typically softens prices + rents 12–24 months out; constrained supply supports both.
Investment metrics
- 1% rule
- 1.23% ✓
- Cap rate
- 8.25%
- Cash-on-cash
- 7.01%
- DSCR
- 1.31
- GRM
- 6.8
CMA / ARV
- ARV (on-the-fly)
- $149,600
- Comps found
- 12
Show comp detail 12 sales within ~0.75 mi
| Address | Dist | Beds/Ba | Sqft | Sold | Price | $/sf | Match |
|---|---|---|---|---|---|---|---|
| 211 Waltham St | 0.25mi | 3/2.0 | 1,101 (+0%) | 1mo | $150,000 | $136 | 84 |
| 503 Webb St | 0.30mi | 2/1.0 (-1) | 1,093 (-1%) | 1mo | $20,000 | $18 | 79 |
| 518 156th Pl | 0.36mi | 3/2.0 | 1,165 (+6%) | 3mo | $167,000 | $143 | 67 |
| 423 157th St | 0.23mi | 4/1.5 (+1) | 1,212 (+10%) | 1mo | $25,000 | $21 | 64 |
| 303 W 153rd Pl | 0.48mi | 3/1.0 | 1,188 (+8%) | 2mo | $65,000 | $55 | 63 |
| 7 Highland St | 0.47mi | 3/2.0 | 1,163 (+6%) | 3mo | $172,500 | $148 | 62 |
| 866 Greenbay Ave | 0.49mi | 3/2.0 | 1,163 (+6%) | 3mo | $200,000 | $172 | 61 |
| 302 153rd St | 0.57mi | 3/1.0 | 1,016 (-8%) | 2mo | $175,000 | $172 | 59 |
| 419 157th St | 0.22mi | 4/2.0 (+1) | 957 (-13%) | 3mo | $80,000 | $84 | 57 |
| 527 155th Pl | 0.43mi | 2/1.0 (-1) | 947 (-14%) | 3mo | $82,900 | $88 | 50 |
| 608 Forsythe Ave | 0.65mi | 2/1.0 (-1) | 984 (-10%) | 3mo | $137,500 | $140 | 45 |
| 5259 State Line Ave | 0.65mi | 3/1.0 | 1,260 (+14%) | 1mo | $77,000 | $61 | 44 |
Match score weights: distance 35% · size 25% · config 20% · recency 20%. Top-matched comps best support the ARV.
Projected returns pro-forma
-3.0% appreciation · 6.17% rent growth · sell at horizon
- IRR
- -1.5%
- Equity multiple
- 0.94×
- Total profit
- $-2,250
- Equity at exit
- $20,114
- IRR
- 11.7%
- Equity multiple
- 2.07×
- Total profit
- $40,456
- Equity at exit
- $11,664
Cash invested: $37,772 (down + closing). Projections, not guarantees.
Landlord ↔ Tenant lean methodology
- Overall (STATE)
- 43 Moderately Tenant-Leaning
- State Illinois
- 43 Moderately Tenant-Leaning · D+7
- County
- — inherits STATE
- City
- — inherits STATE
ZIP-level market 60409
- Home prices YoY
- -27.6%
- Rents YoY
- 6.2%
- Active inventory
- 196
- Price-to-rent
- 6.8×
Monthly cashflow live
- Estimated rent
- $1,654 high interval (Pro) →
- Mortgage (P&I)
- −$707
- Tax from tax record
- −$323 /mo · $3,871/yr
- Insurance
- −$56
- HOA
- −$0
- Vacancy / Maint / Mgmt
- −$347
- Net cashflow
- $221
Break-even live
Sensitivity live
| Price | -10% $297 | -5% $259 | +0% $221 | +5% $182 | +10% $144 |
|---|---|---|---|---|---|
| Rent | -10% $90 | -5% $155 | +0% $221 | +5% $286 | +10% $351 |
| Rate | -1.0pp $288 | -0.5pp $255 | base $221 | +0.5pp $186 | +1.0pp $150 |
UW: 25.0% down · 7.5% · 30yr · 1.5% tax · 5.0% vac · 8.0% maint · 8.0% mgmt
Financing live
Cash to close
- Down payment
- $33,725
- Closing costs
- $4,047
- Reserves months
- —
- Total cash needed
- —
Loan-product check · same deal, 3 products live
Conventional
25% down · 7.5% · 30yr
- Down + closing
- —
- Monthly P&I
- —
- Monthly cashflow
- —
- DSCR
- —
- Eligible?
- —
Personal DTI + credit; lowest rate.
DSCR
20% down · 8.5% · 30yr
- Down + closing
- —
- Monthly P&I
- —
- Monthly cashflow
- —
- DSCR
- —
- Eligible?
- —
No personal income docs; deal must DSCR.
Hard money
10% down · 12.0% · 12mo
- Down + closing
- —
- Monthly P&I
- —
- Monthly cashflow
- —
- DSCR
- —
- Eligible?
- —
Short-term bridge; refi at stabilization.
Rent comps 13 comps
| Address | Beds | Baths | Sqft | Rent | $/sqft | DOM | Units | Dist |
|---|---|---|---|---|---|---|---|---|
| 115 157th St Unit 3 Calumet City, IL | 3.0 | 1.0 | 800 | $1,350 | $1.69 | 26d | 1 | 0.21mi |
| 34 Elizabeth St Calumet City, IL | 3.0 | 1.0 | 1246 | $2,400 | $1.93 | 0d | 1 | 0.37mi |
| 3 Ruth St Hammond, IN | 2.0 | 1.0 | 900 | $1,250 | $1.39 | 26d | 1 | 0.38mi |
| 5 Ruth St Unit 2W Hammond, IN | 2.0 | 1.0 | 900 | $1,250 | $1.39 | 14d | 1 | 0.39mi |
| 3 Waltham St Hammond, IN | 3.0 | 1.0 | 1200 | $1,095 | $0.91 | 26d | 1 | 0.41mi |
| 323 Memorial Dr Unit 2 Calumet City, IL | 2.0 | 1.0 | 1000 | $1,600 | $1.60 | 26d | 1 | 0.69mi |
| 1312 Gordon Ave Calumet City, IL | 2.0 | 1.0 | 1134 | $1,600 | $1.41 | 8d | 1 | 0.87mi |
| 1338 Wentworth Ave Unit 1338 Calumet City, IL | 2.0 | 1.0 | 800 | $1,430 | $1.79 | 26d | 1 | 0.92mi |
| 634 Sibley Blvd Calumet City, IL | 1.0–2.0 | 1.0 | 710 | $1,450 | $2.04 | 6d | 2 | 0.97mi |
| 407 Kenwood St Hammond, IN | 2.0 | 1.0 | 920 | $1,495 | $1.62 | 18d | 1 | 0.98mi |
| 407 Kenwood St Hammond, IN | 2.0 | 1.0 | 920 | $1,495 | $1.62 | 26d | 1 | 0.98mi |
| 1539 Wentworth Ave Unit 3W Calumet City, IL | 3.0 | 1.0 | 1100 | $1,700 | $1.55 | 13d | 1 | 1.40mi |
| 671 Saginaw Ave Calumet City, IL | 3.0 | 2.0 | 1250 | $2,276 | $1.82 | 11d | 1 | 1.41mi |
Listing history 29 events
-
2026-06-21days on market $134,900 Active 67 DOM
-
2026-06-18days on market $134,900 Active 64 DOM
-
2026-06-17days on market $134,900 Active 63 DOM
-
2026-06-16days on market $134,900 Active 62 DOM
-
2026-06-15days on market $134,900 Active 61 DOM
-
2026-06-13days on market $134,900 Active 59 DOM
-
2026-06-09days on market $134,900 Active 55 DOM
-
2026-06-08days on market $134,900 Active 54 DOM
-
2026-06-07days on market $134,900 Active 53 DOM
-
2026-06-04days on market $134,900 Active 50 DOM
-
2026-06-03days on market $134,900 Active 49 DOM
-
2026-06-02days on market $134,900 Active 48 DOM
-
2026-06-01days on market $134,900 Active 47 DOM
-
2026-05-31days on market $134,900 Active 46 DOM
-
2026-04-15$134,900 Active 651-char remark
Show marketing remark (651 chars)
Investor opportunity with immediate cash flow! This tenant-occupied 3 bedroom, 1.5 bath home offers a solid addition to any rental portfolio. The one story layout appeals to a wide range of tenants, while the full basement provides additional space plus a half bath. The property features a detached 2-car garage, increasing storage space and rental appeal, while a charming covered front porch add to the curb appeal. The roof and most basement windows were replaced in 2009, the water heater in 2021, and the stairs up front were new in 2023. With stable occupancy already in place, this is a turnkey investment opportunity with income from day one.
-
2026-04-15$134,900 Active
Show marketing remark (651 chars)
Investor opportunity with immediate cash flow! This tenant-occupied 3 bedroom, 1.5 bath home offers a solid addition to any rental portfolio. The one story layout appeals to a wide range of tenants, while the full basement provides additional space plus a half bath. The property features a detached 2-car garage, increasing storage space and rental appeal, while a charming covered front porch add to the curb appeal. The roof and most basement windows were replaced in 2009, the water heater in 2021, and the stairs up front were new in 2023. With stable occupancy already in place, this is a turnkey investment opportunity with income from day one.
-
2009-03-01historical
-
2009-01-10price
-
2008-12-05price
-
2008-10-15price
-
2008-09-18price
-
2008-09-10price
-
2008-08-08price
-
2008-07-02price
-
2008-02-23
-
2001-12-20$89,900
-
2001-10-25soldstatus $90,000
-
1987-03-01soldstatus $35,000
-
1985-05-16soldstatus $50,000
ⓘ Source: listings_history table (triggers on properties + properties_extension) + one-shot
backfill from property_details.listing_events for pre-trigger history.
Tax reassessment forecast IL · Partial reset (capped growth)
- Current annual tax
- $3,871 · $323/mo
- Projected year-2 tax
- $3,871 · $323/mo
- Expected delta
- $0/yr ($0/mo · 0.0%)
ⓘ Screening estimate from a state-policy table — verify with the county assessor before closing.
Climate risk First Street
- Flood 1/10 Low FEMA zone X (unshaded) · 0% chance over 30 yrs
- Wildfire 1/10 Low
- Heat 3/10 Moderate 7 d/yr ≥102°F today · 15 d/yr by 30 yrs out
- Wind 2/10 Low
- Air quality 4/10 Moderate 5 unhealthy d/yr today · 6 by 30 yrs out
Nearby sold comps map
Loading sold comps map…
Walkable amenities ~0.75 mi
Loading nearby amenities…
Taxation est. · year 1
- Rental income
- $19,850
- − Mortgage interest
- −$7,556
- − Property taxes
- −$3,871
- − Insurance
- −$674
- − Repairs & maintenance
- −$1,588
- − Management
- −$1,588
- − Depreciation
- −$3,924
- Taxable income
- $647
- Est. tax owed @ 24.0%
- −$155
- After-tax cash flow
- $2,491/yr
For passive investors: Depreciation is non-cash, so a rental often shows a tax loss while cash-flowing — sheltering income. Rental losses are passive: they offset passive income freely, and up to $25,000/yr can offset ordinary (W-2) income if you actively participate and your MAGI is under $100k (phasing out to $0 by $150k); unused losses carry forward. On sale, claimed depreciation is recaptured at up to 25%, and gains may owe capital-gains tax (a 1031 exchange can defer both). Figures are a year-1 estimate at your 24.0% rate — not tax advice; consult a CPA.
Schools (NCES district)
- District
- Thornton Fractional Twp Hsd 215
- NCES district ID
- 1738940
- Math proficiency
- 9% ▼ -3.00%
- Reading proficiency
- 13% ▼ -3.00%
- Median HH income
- $48,207
- Composite
- 10.27/100
- National rank
- #9793
- State rank
- #563 of 620 in IL
Livability — Calumet City
- Score
- 71/100
- State rank
- #330
- US rank
- #6552
Category grades
Schools grade is shown separately in the Schools card above.
Census & demographics
- Census place
- Calumet City, IL
- County
- Cook County · 4,486,803 people
- City population
- 35,100
- Metro
- Chicago-Naperville-Elgin, IL-IN-WI
- Population (ZIP)
- 35,100
- Household income
- $55,369
- Rent vs Own
- Severe rent burden
- 2415.0
Population outlook (Cook County) Hauer SSP2
- Today (2025)
- 5,347,519 people
- By 2030
- 5,357,703 · +0.2%
- By 2040
- 5,324,924 · -0.4%
- By 2050
- 5,230,762 · -2.2%
- By 2075
- 4,785,735 · -10.5%
- By 2100
- 4,188,836 · -21.7%
Race, ethnicity, and origin ACS 2023
- Neighborhood character
- Predominantly Black (74%)
- Race & ethnicity
- Black 74% Hispanic / Latino 15% White 7% Two or more races 4%
- Hispanic origin (detail)
- Mexican 14%
- Common ancestry
- Romanian 2%
- Foreign-born
- 9% · Canada
- Languages at home
- 83% English-only · Spanish 14%
Political lean MEDSL · Cook
- 2024 margin
- Solid D (+42.0) · D 70.4% · R 28.4% · Other 1.2%
- 2008→2024 swing
- -11.4pp toward R · 2008: 53.4pp · 2024: 42.0pp
- All cycles
- 2024: D+42.0 2020: D+50.3 2016: D+53.0 2012: D+49.4 2008: D+53.4
Not yet ingested
- Civics
- —
Market trends
- HPI YoY
- ▼ -75.01%
- Current HPI
- 197.2137
- Rent YoY
- ▲ 6.17%
- Metro
- Chicago-Naperville-Elgin, IL-IN-WI
- State GDP YoY
- ▲ 1.59%
- F500 in state
- 60
Industry mix (Fortune 500 HQ in IL)
| Industry | F500 HQs | Revenue |
|---|---|---|
| Insurance | 4 | $201B |
|
||
| Consumer Goods | 4 | $87B |
|
||
| Industrial Machinery | 3 | $64B |
|
||
| Healthcare | 2 | $55B |
|
||
| Retail / Pharmacy | 1 | $148B |
|
||
| Agriculture / Food | 1 | $86B |
|
||
Price history
+169.8% since first listed15 events — show timeline
- 2026-04-15 Listed $134,900 MRED as Distributed by MLS Grid
- 2026-04-15 Listed $134,900 NIRA MLS as Distributed by MLS Grid
- 2009-03-01 Listing Removed — MRED as Distributed by MLS Grid
- 2009-01-10 Price Changed — MRED as Distributed by MLS Grid
- 2008-12-05 Price Changed — MRED as Distributed by MLS Grid
- 2008-10-15 Price Changed — MRED as Distributed by MLS Grid
- 2008-09-18 Price Changed — MRED as Distributed by MLS Grid
- 2008-09-10 Price Changed — MRED as Distributed by MLS Grid
- 2008-08-08 Price Changed — MRED as Distributed by MLS Grid
- 2008-07-02 Price Changed — MRED as Distributed by MLS Grid
- 2008-02-23 Listed — MRED as Distributed by MLS Grid
- 2001-12-20 Listed $89,900 NIRA MLS as Distributed by MLS Grid
- 2001-10-25 Sold (Public Records) $90,000 Public Records
- 1987-03-01 Sold (Public Records) $35,000 Public Records
- 1985-05-16 Sold (Public Records) $50,000 Public Records
Property tax history
+3.4%/yrLatest (2023): $3,871 · -22.4% YoY. Source: county tax records.
Cash-flow waterfall
monthlySold comps — $/sqft
last 12 mo · ≤1 miLoading sold comps…