 Multi-family
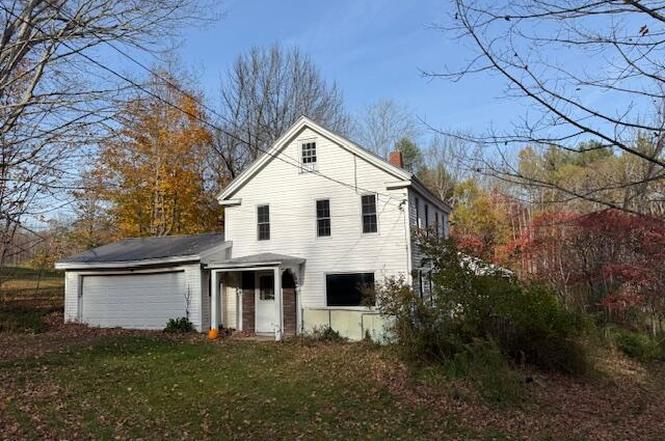
1477 Main St · Winthrop, ME
Flood risk 1/10 · Minimal
- FEMA flood zone
- X (unshaded)
- Chance of flooding over 30 yrs
- 0.0%
- Est. flood insurance / yr
- $507 – $1,088
Fire risk 3/10 · Minor
- Est. fire insurance / yr
- $669 – $1,243
Heat risk 2/10 · Minimal
- Hot days now (above 91°F)
- 7 days/yr
- Hot days in 30 yrs
- 16 days/yr
Wind risk 4/10 · Minor
- Chance of severe wind over 30 yrs
- 11.0%
Air-quality risk 2/10 · Minimal
- Unhealthy air days now
- 1 days/yr
- Unhealthy air days in 30 yrs
- 1 days/yr
Risk factors via First Street. Map © Google.
Why this score? — see what drove the B+ grade
The composite is a weighted blend of 9 inputs, each scored 0–100. Each bar is that input's sub-score; the figure is the points it added to the 100-point composite (weight × sub-score).
- Cash flow +27.1/30.0
- Appreciation +10.0/10.0
- DSCR +9.4/10.0
- Schools +7.6/10.0
- ARV discount +7.5/15.0
- 1% rule +6.7/10.0
- Livability +3.5/5.0
- Rent growth +2.5/5.0
- Condition / age +2.5/5.0
$223,000
🖨 Deal sheet 📄 Offer letter ✓ Due diligence
Multi-family units
County records classify this as Multi-Family (2-4 Unit). Listing-text estimate: 1 unit. estimate disagrees with records
Listing remarks
Three bedroom 1 bath room with laundry, accessible family room/bedroom on main level. Freshly painted throughout and move-in ready. Screened porch off kitchen to relax after a long day. Sunny living room with wood floors, formal dining room and conveniently located laundry! 3 Acres to explore! Come take a look.
Key facts
- Formal dining room
- Wood floors
- Screened porch
Tags
Neighborhood map
What this means for you Summary
Snapshot
- This is a 3-bed/1.0-bath multifamily listed at $223k.
Deal economics
- At list price, monthly cash flow is $630 ($8k/yr) — positive.
- The deal already cash-flows at list — no discount required.
- Meets the 1% rule at list price ($3k rent vs $223k).
- Recommended offer: $196k (12.0% below list) — sets the bar for market timing.
- Cap rate 9.7% vs local median 2.0% in Winthrop — top-decile yield for the area; either an underpriced asset or a hidden risk that comps aren't pricing in. Stress-test before assuming the spread holds.
Location & tenants
- Location reads 69/100 on livability (#76 in ME) — a middle-class / working-renter tenant base. Strengths: crime A+, cost of living A, housing A; Watch: health & safety C-, employment D, amenities F.
- RSU 38 (rural): math 89% / reading 89% proficiency, ranked #27 of 112 in ME (top 24%) — strong family-tenant draw, lease renewals of 3-5y typical.
- Market conditions: 13 active listings in the ZIP; 460 units permitted in Kennebec County in 2024 (0 in 5+ unit buildings).
Forward outlook
- In year one you build about $24k of equity ($2k loan paydown + $22k appreciation (10.0% local appreciation)).
- Kennebec County population projected at -17% by 2050 — secular population decline; favor cash flow + early exit over multi-decade hold.
- At projected returns (10.0% appreciation + 3.0% rent growth), your $62k cash investment doubles in ~2 years — after that, you're playing with house money.
- By year 2, paydown + projected appreciation supports a ~$38k cash-out refi (75% LTV) — recoverable capital for the next deal without selling this one.
Negotiation context
- It's been on market 133 days — a 12% lower offer ($196k) is reasonable based on typical stale-listing flexibility.
- 2 sale attempts; this cycle's ask has dropped $16k (6%) from the opening price — seller is motivated, your offer sets the floor, not the list.
Risks & watch-outs
- Watch-outs: built in 1850 — expect roof / HVAC / electrical / plumbing capex.
Questions for the listing agent
- It's been on market 133 days. Have you received any prior offers? Is the seller open to a 12% concession, seller financing, or rate buy-down credit?
- Built in 1850 — when were the roof, HVAC, electrical panel, plumbing, and water heater last replaced?
- Why hasn't it sold? Are there any deal-killer items the seller is aware of (foundation, flood, title, zoning, code violations)?
- Is there a deadline driving the sale (1031 exchange, divorce, estate, relocation)? That informs how much negotiation room exists.
- What's the average days-on-market for RENTAL listings here right now (not sales)? A rising rental-DOM trend means longer vacancies and softer asking-rent achievability than the comps imply.
- What's the recent tenant-quality profile in this submarket — average credit score on applications, eviction rate, late-payment / NSF rate, and stable-employment percentage? A property-management company in the area should have these aggregated.
- How much new apartment / multifamily construction is in the pipeline within 1–3 miles? Heavy new supply (>2% of stock underway) typically softens rents 12–24 months out; light construction supports rent growth.
Investment metrics
- 1% rule
- 1.17% ✓
- Cap rate
- 9.68%
- Cash-on-cash
- 12.11%
- DSCR
- 1.54
- GRM
- 7.1
CMA / ARV
No comps found within radius.
Projected returns pro-forma
10.0% appreciation · 3.0% rent growth · sell at horizon
- IRR
- 33.2%
- Equity multiple
- 3.59×
- Total profit
- $161,546
- Equity at exit
- $200,896
- IRR
- 28.6%
- Equity multiple
- 8.11×
- Total profit
- $444,119
- Equity at exit
- $433,240
Cash invested: $62,440 (down + closing). Projections, not guarantees.
Landlord ↔ Tenant lean methodology
- Overall (STATE)
- 41 Moderately Tenant-Leaning
- State Maine
- 41 Moderately Tenant-Leaning · D+2
- County
- — inherits STATE
- City
- — inherits STATE
ZIP-level market 04355
- Home prices YoY
- 19.1%
- Active inventory
- 13
- Price-to-rent
- 7.1×
Monthly cashflow live
- Estimated rent
- $2,610 medium interval (Pro) →
- Mortgage (P&I)
- −$1,169
- Tax from tax record
- −$169 /mo · $2,032/yr
- Insurance
- −$93
- HOA
- −$0
- Vacancy / Maint / Mgmt
- −$548
- Net cashflow
- $630
Break-even live
UW: 25.0% down · 7.5% · 30yr · 1.5% tax · 5.0% vac · 8.0% maint · 8.0% mgmt
Financing live
Cash to close
- Down payment
- $55,750
- Closing costs
- $6,690
- Reserves months
- —
- Total cash needed
- —
Loan-product check · same deal, 3 products live
Conventional
25% down · 7.5% · 30yr
- Down + closing
- —
- Monthly P&I
- —
- Monthly cashflow
- —
- DSCR
- —
- Eligible?
- —
Personal DTI + credit; lowest rate.
DSCR
20% down · 8.5% · 30yr
- Down + closing
- —
- Monthly P&I
- —
- Monthly cashflow
- —
- DSCR
- —
- Eligible?
- —
No personal income docs; deal must DSCR.
Hard money
10% down · 12.0% · 12mo
- Down + closing
- —
- Monthly P&I
- —
- Monthly cashflow
- —
- DSCR
- —
- Eligible?
- —
Short-term bridge; refi at stabilization.
Listing history 6 events
-
2026-03-02status Pending
-
2026-02-18historical Active Under Contract
-
2026-02-09price $223,000
-
2026-01-20status Active
-
2026-01-12historical Active Under Contract
-
2025-10-20$238,500 Active
ⓘ Source: listings_history table (triggers on properties + properties_extension) + one-shot
backfill from property_details.listing_events for pre-trigger history.
Tax reassessment forecast ME · Partial reset (capped growth)
- Current annual tax
- $2,032 · $169/mo
- Projected year-2 tax
- $2,532 · $211/mo
- Expected delta
- +$500/yr (+$42/mo · 24.6%)
ⓘ Screening estimate from a state-policy table — verify with the county assessor before closing.
Climate risk First Street
- Flood 1/10 Low FEMA zone X (unshaded) · 0% chance over 30 yrs
- Wildfire 3/10 Moderate
- Heat 2/10 Low 7 d/yr ≥91°F today · 16 d/yr by 30 yrs out
- Wind 4/10 Moderate 11% chance of damaging wind over 30 yrs
- Air quality 2/10 Low 1 unhealthy d/yr today · 1 by 30 yrs out
Nearby sold comps map
Loading sold comps map…
Walkable amenities ~0.75 mi
Loading nearby amenities…
Taxation est. · year 1
- Rental income
- $31,316
- − Mortgage interest
- −$12,491
- − Property taxes
- −$2,032
- − Insurance
- −$1,115
- − Repairs & maintenance
- −$2,505
- − Management
- −$2,505
- − Depreciation
- −$6,487
- Taxable income
- $4,180
- Est. tax owed @ 24.0%
- −$1,003
- After-tax cash flow
- $6,556/yr
For passive investors: Depreciation is non-cash, so a rental often shows a tax loss while cash-flowing — sheltering income. Rental losses are passive: they offset passive income freely, and up to $25,000/yr can offset ordinary (W-2) income if you actively participate and your MAGI is under $100k (phasing out to $0 by $150k); unused losses carry forward. On sale, claimed depreciation is recaptured at up to 25%, and gains may owe capital-gains tax (a 1031 exchange can defer both). Figures are a year-1 estimate at your 24.0% rate — not tax advice; consult a CPA.
Schools (NCES district)
- District
- RSU 38
- NCES district ID
- 2314788
- Math proficiency
- 89% ▲ 54.00%
- Reading proficiency
- 89% ▲ 29.00%
- Median HH income
- $63,163
- Composite
- 76.39/100
- National rank
- #107
- State rank
- #27 of 112 in ME
Livability — Winthrop
- Score
- 69/100
- State rank
- #76
- US rank
- #8395
Category grades
Schools grade is shown separately in the Schools card above.
Census & demographics
- City population
- 6,153
- Population (ZIP)
- 2,628
Population outlook (Kennebec County) Hauer SSP2
- Today (2025)
- 115,421 people
- By 2030
- 111,852 · -3.1%
- By 2040
- 103,757 · -10.1%
- By 2050
- 95,710 · -17.1%
- By 2075
- 78,172 · -32.3%
- By 2100
- 59,500 · -48.4%
Race, ethnicity, and origin ACS 2023
- Neighborhood character
- Predominantly White (97%)
- Race & ethnicity
- White 97% Two or more races 2% Hispanic / Latino 1%
- Common ancestry
- Lithuanian 8% Slovak 6% Serbian 4%
- Foreign-born
- 2% · Canada
- Languages at home
- 98% English-only · Other Indo-European 1% French/Haitian/Cajun 1%
Political lean MEDSL · Kennebec
- 2024 margin
- Toss-up / Even · D 47.5% · R 50.2% · Other 2.4%
- 2008→2024 swing
- -17.5pp toward R · 2008: 14.8pp · 2024: -2.8pp
- All cycles
- 2024: R+2.8 2020: D+0.2 2016: R+3.7 2012: D+13.5 2008: D+14.8
Not yet ingested
- Civics
- —
Market trends
- HPI YoY
- ▲ 65.62%
- Current HPI
- 408.9683
- Rent YoY
- —
- Metro
- —
- State GDP YoY
- —
- F500 in state
- 0
Price history
-6.5% since first listed6 events — show timeline
- 2026-03-02 Pending — MREIS
- 2026-02-18 Contingent — MREIS
- 2026-02-09 Price Changed $223,000 MREIS
- 2026-01-20 Relisted — MREIS
- 2026-01-12 Contingent — MREIS
- 2025-10-20 Listed $238,500 MREIS
Property tax history
+1.5%/yrLatest (2025): $2,032 · +3.7% YoY. Source: county tax records.
Cash-flow waterfall
monthlySold comps — $/sqft
last 12 mo · ≤1 miLoading sold comps…