 🏷️ Likely Rental
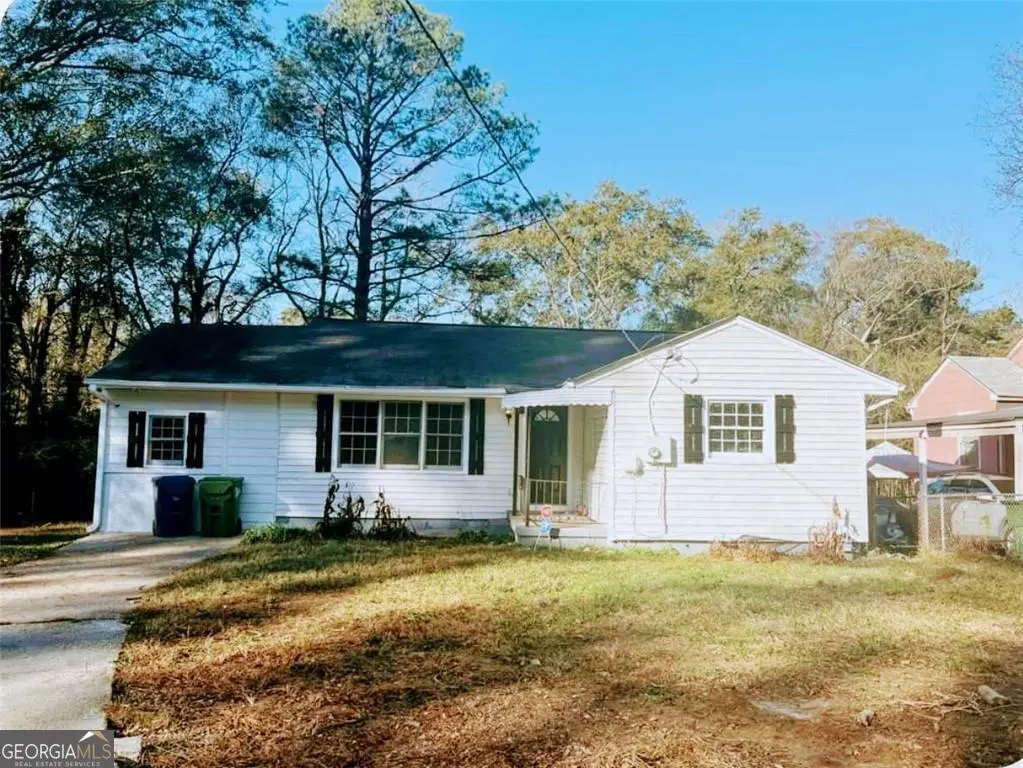
2311 Jernigan St SE · Atlanta, GA
Flood risk 1/10 · Minimal
- FEMA flood zone
- X (unshaded)
- Chance of flooding over 30 yrs
- 0.0%
- Est. flood insurance / yr
- $473 – $860
Fire risk 3/10 · Minor
- Est. fire insurance / yr
- $963 – $1,789
Heat risk 5/10 · Moderate
- Hot days now (above 104°F)
- 7 days/yr
- Hot days in 30 yrs
- 18 days/yr
Wind risk 5/10 · Moderate
- Chance of severe wind over 30 yrs
- 26.0%
Air-quality risk 4/10 · Minor
- Unhealthy air days now
- 4 days/yr
- Unhealthy air days in 30 yrs
- 6 days/yr
Risk factors via First Street. Map © Google.
Why this score? — see what drove the B grade
The composite is a weighted blend of 9 inputs, each scored 0–100. Each bar is that input's sub-score; the figure is the points it added to the 100-point composite (weight × sub-score).
- Cash flow +26.6/30.0
- ARV discount +15.0/15.0
- DSCR +9.1/10.0
- 1% rule +8.2/10.0
- Livability +4.2/5.0
- Rent growth +3.3/5.0
- Schools +2.7/10.0
- Condition / age +2.5/5.0
- Appreciation +0.0/10.0
$140,000
🖨 Deal sheet 📄 Offer letter ✓ Due diligence
Listing remarks MLS
Amazing opportunity to invest in this highly desirable area for first time homebuyers, legacy owner-occupants, and investors. Check out the comps! Atlanta Housing pays up to $2400 for a 3 BR in this census tract. Property is vacant. Interior pictures available upon request. In current condition, may not qualify for FHA, but feel free to make that assessment yourself. This is a quiet, mature neighborhood, with many legacy owners and renovated homes with new owners. We have other tenant-occupied and vacant properties available.
Key facts
- 9,234 sq ft lot
- Built 1960
- Listed 127 days
Neighborhood map
What this means for you Summary
Snapshot
- This is a 3-bed/1.0-bath single-family listed at $140k.
Deal economics
- At list price, monthly cash flow is $373 ($4k/yr) — positive.
- The deal already cash-flows at list — no discount required.
- Meets the 1% rule at list price ($2k rent vs $140k).
- Recommended offer: $123k (12.0% below list) — sets the bar for market timing.
- Cap rate 9.5% vs local median 3.1% in Atlanta — top-decile yield for the area; either an underpriced asset or a hidden risk that comps aren't pricing in. Stress-test before assuming the spread holds.
Location & tenants
- Location reads 83/100 on livability (#6 in GA, #919 nationally) — a professional / high-income tenant draw. Strengths: amenities A+, commute A+, housing A+; Watch: schools C-, cost of living C-.
- Atlanta Public Schools (urban): math 28% / reading 35% proficiency, ranked #80 of 174 in GA (top 46%) — families likely to look elsewhere, expect single-tenant / working-renter base with shorter leases; 71% free/reduced lunch — lower-income household profile, screen leases tightly.
- Market conditions: Rents rising (+3.2%/yr); 378 active listings in the ZIP; 19 comparable units currently listed for rent nearby; rentals at typical pace (median 22d on market — plan ~3-4 weeks tenant-placement turnaround); 11,565 units permitted in Fulton County in 2024 (8,159 in 5+ unit buildings).
- This rent runs 44% of the median local income ($51k/yr) — at the standard rent-burdened threshold; future hikes will face affordability resistance.
Forward outlook
- Local home prices are declining (-3.0%/yr); year-one equity from $968 of loan paydown is wiped out by about $4k of value loss. Plan a longer hold.
- Fulton County population projected at +38% by 2050 — long-run rental-demand tailwind backs the buy-and-hold thesis.
- At projected returns (-3.0% appreciation + 3.2% rent growth), your $39k cash investment doubles in ~10 years — after that, you're playing with house money.
Negotiation context
- It's been on market 127 days — a 12% lower offer ($123k) is reasonable based on typical stale-listing flexibility.
- 10 sale attempts since 10y ago; this cycle's ask has dropped $30k (18%) from the opening price — seller is motivated, your offer sets the floor, not the list.
- Current owner paid $94k; 49% above their basis — modest negotiation headroom, anchor on the comps not their cost.
Risks & watch-outs
- Watch-outs: property tax is 2.6% of price.
- Climate carrying-cost: moderate wind risk, 26% chance of damaging wind over 30y; extreme-heat days projected 7→18/yr by 2055 (HVAC capex compounding) — expect insurance premiums to compound above CPI over the hold.
Questions for the listing agent
- It's been on market 127 days. Have you received any prior offers? Is the seller open to a 12% concession, seller financing, or rate buy-down credit?
- Built in 1960 — when were the roof, HVAC, electrical panel, plumbing, and water heater last replaced?
- Property tax is high relative to price — has the assessment been appealed recently, and will the sale trigger a re-assessment?
- Why hasn't it sold? Are there any deal-killer items the seller is aware of (foundation, flood, title, zoning, code violations)?
- Is there a deadline driving the sale (1031 exchange, divorce, estate, relocation)? That informs how much negotiation room exists.
- What's the average days-on-market for RENTAL listings here right now (not sales)? A rising rental-DOM trend means longer vacancies and softer asking-rent achievability than the comps imply.
- What's the recent tenant-quality profile in this submarket — average credit score on applications, eviction rate, late-payment / NSF rate, and stable-employment percentage? A property-management company in the area should have these aggregated.
- How much new for-sale + rental construction is in the pipeline within 1–3 miles? Heavy new supply typically softens prices + rents 12–24 months out; constrained supply supports both.
Investment metrics
- 1% rule
- 1.32% ✓
- Cap rate
- 9.49%
- Cash-on-cash
- 11.41%
- DSCR
- 1.51
- GRM
- 6.3
CMA / ARV
- ARV (median comp)
- $250,903
- List price
- $140,000
- Delta
- -44.20%
- Verdict
- UNDERPRICED
- Comps
- 20 within 1.0 mi
Show comp detail 12 sales within ~0.75 mi
| Address | Dist | Beds/Ba | Sqft | Sold | Price | $/sf | Match |
|---|---|---|---|---|---|---|---|
| 2286 Carey Dr SE | 0.19mi | 3/1.0 | 1,048 (+6%) | 1mo | $102,500 | $98 | 81 |
| 305 Banberry Dr SE | 0.46mi | 3/1.0 | 1,000 (+1%) | 3mo | $135,000 | $135 | 75 |
| 445 Carey Dr SE | 0.19mi | 3/2.0 | 1,064 (+8%) | 0mo | $234,000 | $220 | 74 |
| 287 Banberry Dr | 0.48mi | 3/2.0 | 1,025 (+4%) | 0mo | $225,000 | $220 | 67 |
| 2239 Carey Dr SE | 0.20mi | 3/1.0 | 1,110 (+12%) | 4mo | $145,000 | $131 | 67 |
| 2203 Jernigan Dr SE | 0.20mi | 3/1.0 | 1,114 (+12%) | 4mo | $177,000 | $159 | 66 |
| 847 Midway St SE | 0.64mi | 3/1.0 | 1,014 (+2%) | 8mo | $110,000 | $108 | 60 |
| 233 Banberry Dr SE | 0.58mi | 3/2.0 | 1,025 (+4%) | 5mo | $185,000 | $180 | 59 |
| 172 Meador Way SE | 0.74mi | 3/2.0 | 1,000 (+1%) | 3mo | $138,900 | $139 | 57 |
| 209 Harper Rd SE | 0.64mi | 3/2.0 | 1,059 (+7%) | 2mo | $253,000 | $239 | 53 |
| 2294 Forrest Park Rd SE | 0.75mi | 3/2.0 | 1,008 (+2%) | 9mo | $175,000 | $174 | 50 |
| 2016 Conrad Ave SE | 0.74mi | 2/1.0 (-1) | 878 (-11%) | 6mo | $107,500 | $122 | 36 |
Match score weights: distance 35% · size 25% · config 20% · recency 20%. Top-matched comps best support the ARV.
Projected returns pro-forma
-3.0% appreciation · 3.23% rent growth · sell at horizon
- IRR
- 1.1%
- Equity multiple
- 1.04×
- Total profit
- $1,580
- Equity at exit
- $20,874
- IRR
- 11.0%
- Equity multiple
- 1.87×
- Total profit
- $34,131
- Equity at exit
- $12,105
Cash invested: $39,200 (down + closing). Projections, not guarantees.
Landlord ↔ Tenant lean methodology
- Overall (STATE)
- 90 Strongly Landlord-Friendly
- State Georgia
- 90 Strongly Landlord-Friendly · R+3
- County
- — inherits STATE
- City
- — inherits STATE
ZIP-level market 30315
- Rents YoY
- 3.2%
- Active inventory
- 378
- Price-to-rent
- 6.3×
Monthly cashflow live
- Estimated rent
- $1,854 high interval (Pro) →
- Mortgage (P&I)
- −$734
- Tax from tax record
- −$299 /mo · $3,590/yr
- Insurance
- −$58
- HOA
- −$0
- Vacancy / Maint / Mgmt
- −$389
- Net cashflow
- $373
Break-even live
UW: 25.0% down · 7.5% · 30yr · 1.5% tax · 5.0% vac · 8.0% maint · 8.0% mgmt
Financing live
Cash to close
- Down payment
- $35,000
- Closing costs
- $4,200
- Reserves months
- —
- Total cash needed
- —
Loan-product check · same deal, 3 products live
Conventional
25% down · 7.5% · 30yr
- Down + closing
- —
- Monthly P&I
- —
- Monthly cashflow
- —
- DSCR
- —
- Eligible?
- —
Personal DTI + credit; lowest rate.
DSCR
20% down · 8.5% · 30yr
- Down + closing
- —
- Monthly P&I
- —
- Monthly cashflow
- —
- DSCR
- —
- Eligible?
- —
No personal income docs; deal must DSCR.
Hard money
10% down · 12.0% · 12mo
- Down + closing
- —
- Monthly P&I
- —
- Monthly cashflow
- —
- DSCR
- —
- Eligible?
- —
Short-term bridge; refi at stabilization.
Rent comps 19 comps
| Address | Beds | Baths | Sqft | Rent | $/sqft | DOM | Units | Dist |
|---|---|---|---|---|---|---|---|---|
| 386 Lindsey Dr SE Atlanta, GA | 3.0 | 1.0 | 1040 | $1,808 | $1.74 | 14d | 1 | 0.33mi |
| 2087 Lakewood Trl SE Atlanta, GA | 3.0 | 2.5 | 1056 | $2,256 | $2.14 | 24d | 1 | 0.57mi |
| 76 Schell Rd SE Atlanta, GA | 3.0 | 1.0 | 1080 | $1,623 | $1.50 | 24d | 1 | 0.58mi |
| 871 Hargis St SE Atlanta, GA | 2.0 | 2.0 | 1040 | $1,800 | $1.73 | 24d | 1 | 0.73mi |
| 172 Meador Way SE Atlanta, GA | 3.0 | 2.0 | 1100 | $1,950 | $1.77 | 24d | 1 | 0.74mi |
| 340 Adelle St SE Atlanta, GA | 3.0 | 1.0 | 1122 | $1,500 | $1.34 | 3d | 1 | 0.74mi |
| 136 Hillsdale Dr SE Atlanta, GA | 3.0 | 2.0 | 1075 | $1,995 | $1.86 | 24d | 1 | 0.78mi |
| 2332 Baywood Dr SE Atlanta, GA | 3.0 | 2.0 | 1100 | $1,400 | $1.27 | 17d | 1 | 0.80mi |
| 445 Cleveland Ave SE Atlanta, GA | 2.0–3.0 | 1.0–2.0 | 1014 | $1,591 | $1.57 | 1d | 13 | 0.81mi |
| 1037 Rebel Forest Dr SE Atlanta, GA | 3.0 | 2.0 | 1075 | $1,750 | $1.63 | 24d | 1 | 0.94mi |
| 1875 Conrad Ave SE Atlanta, GA | 3.0 | 2.0 | 1088 | $1,803 | $1.66 | 22d | 1 | 0.98mi |
| 2145 Macon Dr SW Atlanta, GA | 3.0 | 1.0 | 1059 | $1,450 | $1.37 | 24d | 1 | 1.03mi |
| 73 Polar Rock Rd SW Atlanta, GA | 3.0 | 1.0 | 1098 | $1,850 | $1.68 | 10d | 1 | 1.10mi |
| 1979 Turner Rd SE Atlanta, GA | 3.0 | 1.0 | 808 | $1,595 | $1.97 | 10d | 1 | 1.18mi |
| 2268 Polar Rock Pl SW Atlanta, GA | 3.0 | 1.0 | 925 | $1,575 | $1.70 | 24d | 1 | 1.21mi |
| 2197 Polar Rock Pl SW Atlanta, GA | 3.0 | 2.5 | 1000 | $2,700 | $2.70 | 20d | 1 | 1.22mi |
| 52 Claire Dr SE Atlanta, GA | 2.0 | 2.0 | 800 | $1,750 | $2.19 | 18d | 1 | 1.25mi |
| 2786 Old Hapeville Rd SW Atlanta, GA | 2.0 | 1.5 | 1050 | $1,150 | $1.10 | 24d | 1 | 1.40mi |
| 2745 Old Hapeville Rd SW Atlanta, GA | 2.0–3.0 | 2.0 | 1007 | $1,375 | $1.36 | 15d | 1 | 1.41mi |
Listing history 50 events
-
2026-06-18days on market $140,000 Active 127 DOM
-
2026-06-17days on market $140,000 Active 126 DOM
-
2026-06-16days on market $140,000 Active 125 DOM
-
2026-06-15days on market $140,000 Active 124 DOM
-
2026-06-13days on market $140,000 Active 122 DOM
-
2026-06-13days on market $140,000 Active 121 DOM
-
2026-06-09days on market $140,000 Active 118 DOM
-
2026-06-08days on market $140,000 Active 117 DOM
-
2026-06-07days on market $140,000 Active 116 DOM
-
2026-06-04days on market $140,000 Active 113 DOM
-
2026-06-03days on market $140,000 Active 112 DOM
-
2026-06-02days on market $140,000 Active 111 DOM
-
2026-06-01days on market $140,000 Active 110 DOM
-
2026-05-31days on market $140,000 Active 109 DOM
-
2026-05-11status Back On Market 531-char remark
Show marketing remark (531 chars)
Amazing opportunity to invest in this highly desirable area for first time homebuyers, legacy owner-occupants, and investors. Check out the comps! Atlanta Housing pays up to $2400 for a 3 BR in this census tract. Property is vacant. Interior pictures available upon request. In current condition, may not qualify for FHA, but feel free to make that assessment yourself. This is a quiet, mature neighborhood, with many legacy owners and renovated homes with new owners. We have other tenant-occupied and vacant properties available.
-
2026-05-10historical 531-char remark
Show marketing remark (531 chars)
Amazing opportunity to invest in this highly desirable area for first time homebuyers, legacy owner-occupants, and investors. Check out the comps! Atlanta Housing pays up to $2400 for a 3 BR in this census tract. Property is vacant. Interior pictures available upon request. In current condition, may not qualify for FHA, but feel free to make that assessment yourself. This is a quiet, mature neighborhood, with many legacy owners and renovated homes with new owners. We have other tenant-occupied and vacant properties available.
-
2026-03-27price $140,000 531-char remark
Show marketing remark (531 chars)
Amazing opportunity to invest in this highly desirable area for first time homebuyers, legacy owner-occupants, and investors. Check out the comps! Atlanta Housing pays up to $2400 for a 3 BR in this census tract. Property is vacant. Interior pictures available upon request. In current condition, may not qualify for FHA, but feel free to make that assessment yourself. This is a quiet, mature neighborhood, with many legacy owners and renovated homes with new owners. We have other tenant-occupied and vacant properties available.
-
2026-02-24price $150,000 531-char remark
Show marketing remark (531 chars)
Amazing opportunity to invest in this highly desirable area for first time homebuyers, legacy owner-occupants, and investors. Check out the comps! Atlanta Housing pays up to $2400 for a 3 BR in this census tract. Property is vacant. Interior pictures available upon request. In current condition, may not qualify for FHA, but feel free to make that assessment yourself. This is a quiet, mature neighborhood, with many legacy owners and renovated homes with new owners. We have other tenant-occupied and vacant properties available.
-
2026-02-10$170,000 New 531-char remark
Show marketing remark (531 chars)
Amazing opportunity to invest in this highly desirable area for first time homebuyers, legacy owner-occupants, and investors. Check out the comps! Atlanta Housing pays up to $2400 for a 3 BR in this census tract. Property is vacant. Interior pictures available upon request. In current condition, may not qualify for FHA, but feel free to make that assessment yourself. This is a quiet, mature neighborhood, with many legacy owners and renovated homes with new owners. We have other tenant-occupied and vacant properties available.
-
2024-10-28historical
-
2024-07-17$169,000 Active
-
2019-04-05soldstatus $94,000
-
2019-03-29soldstatus $94,000 Closed
-
2019-03-28soldstatus $94,000 Sold
-
2019-02-06status Pending
-
2019-01-28status Pending
-
2019-01-28status Under Contract
-
2019-01-11price $105,000
-
2019-01-11price $105,000
-
2018-12-12$110,000 Active
-
2018-12-12$110,000 New
-
2017-07-11soldstatus $57,500
-
2017-06-27soldstatus $57,500 Sold
-
2017-06-27soldstatus $57,500 Sold
-
2017-06-24status Under Contract
-
2017-06-24historical Pending
-
2017-06-12status Pending Offer Approval
-
2017-06-02$64,275 Active
-
2017-06-02$64,275 New
-
2017-06-01historical
-
2017-04-25status Back on Market
-
2017-04-19status Under Contract
-
2017-02-26price $64,275
-
2016-12-19$66,775 New
-
2016-11-30historical
-
2016-09-09price $70,290
-
2016-08-10price $72,464
-
2016-07-12price $73,943
-
2016-06-21$76,230 New
-
2013-02-14soldstatus $46,100
ⓘ Source: listings_history table (triggers on properties + properties_extension) + one-shot
backfill from property_details.listing_events for pre-trigger history.
Tax reassessment forecast GA · Resets to sale price
- Current annual tax
- $3,590 · $299/mo
- Projected year-2 tax
- $3,590 · $299/mo
- Expected delta
- $0/yr ($0/mo · 0.0%)
ⓘ Screening estimate from a state-policy table — verify with the county assessor before closing.
Climate risk First Street
- Flood 1/10 Low FEMA zone X (unshaded) · 0% chance over 30 yrs
- Wildfire 3/10 Moderate
- Heat 5/10 Major 7 d/yr ≥104°F today · 18 d/yr by 30 yrs out
- Wind 5/10 Major 26% chance of damaging wind over 30 yrs
- Air quality 4/10 Moderate 4 unhealthy d/yr today · 6 by 30 yrs out
Nearby sold comps map
Loading sold comps map…
Walkable amenities ~0.75 mi
Loading nearby amenities…
Taxation est. · year 1
- Rental income
- $22,243
- − Mortgage interest
- −$7,842
- − Property taxes
- −$3,590
- − Insurance
- −$700
- − Repairs & maintenance
- −$1,779
- − Management
- −$1,779
- − Depreciation
- −$4,073
- Taxable income
- $2,479
- Est. tax owed @ 24.0%
- −$595
- After-tax cash flow
- $3,876/yr
For passive investors: Depreciation is non-cash, so a rental often shows a tax loss while cash-flowing — sheltering income. Rental losses are passive: they offset passive income freely, and up to $25,000/yr can offset ordinary (W-2) income if you actively participate and your MAGI is under $100k (phasing out to $0 by $150k); unused losses carry forward. On sale, claimed depreciation is recaptured at up to 25%, and gains may owe capital-gains tax (a 1031 exchange can defer both). Figures are a year-1 estimate at your 24.0% rate — not tax advice; consult a CPA.
Schools (NCES district)
- District
- Atlanta Public Schools
- NCES district ID
- 1300120
- Math proficiency
- 28% ▼ -6.00%
- Reading proficiency
- 35% ▼ -2.00%
- Median HH income
- $48,306
- Composite
- 27.27/100
- National rank
- #7006
- State rank
- #80 of 174 in GA
Livability — Atlanta
- Score
- 83/100
- State rank
- #6
- US rank
- #919
Category grades
Schools grade is shown separately in the Schools card above.
Census & demographics
- Census place
- Atlanta, GA
- County
- Fulton County · 1,094,430 people
- City population
- 629,525
- Metro
- Atlanta-Sandy Springs-Alpharetta, GA
- Population (ZIP)
- 34,264
- Household income
- $50,822
- Rent vs Own
- Severe rent burden
- 2962.0
Population outlook (Fulton County) Hauer SSP2
- Today (2025)
- 1,203,707 people
- By 2030
- 1,299,706 · +8.0%
- By 2040
- 1,488,256 · +23.6%
- By 2050
- 1,664,580 · +38.3%
- By 2075
- 2,036,072 · +69.2%
- By 2100
- 2,222,402 · +84.6%
Race, ethnicity, and origin ACS 2023
- Neighborhood character
- Predominantly Black (72%)
- Race & ethnicity
- Black 72% White 14% Hispanic / Latino 10% Two or more races 4%
- Hispanic origin (detail)
- Mexican 4%
- Common ancestry
- Romanian 1% Italian 1% Lithuanian 1%
- Foreign-born
- 5% · Canada
- Languages at home
- 90% English-only · Spanish 9% French/Haitian/Cajun 1%
Political lean MEDSL · Fulton
- 2024 margin
- Solid D (+44.9) · D 71.9% · R 27.0% · Other 1.1%
- 2008→2024 swing
- +9.8pp toward D · 2008: 35.0pp · 2024: 44.9pp
- All cycles
- 2024: D+44.9 2020: D+46.4 2016: D+42.1 2012: D+29.6 2008: D+35.0
Not yet ingested
- Civics
- —
Market trends
- HPI YoY
- ▼ -281.87%
- Current HPI
- 176.673
- Rent YoY
- ▲ 3.23%
- Metro
- Atlanta-Sandy Springs-Alpharetta, GA
- State GDP YoY
- ▲ 2.66%
- F500 in state
- 28
Industry mix (Fortune 500 HQ in GA)
| Industry | F500 HQs | Revenue |
|---|---|---|
| Paper / Packaging | 2 | $29B |
|
||
| Retail | 1 | $160B |
|
||
| Transportation / Logistics | 1 | $91B |
|
||
| Airlines | 1 | $62B |
|
||
| Consumer Goods | 1 | $47B |
|
||
| Utilities | 1 | $25B |
|
||
Price history
+748.5% since first listed38 events — show timeline
- 2026-05-11 Relisted — GAMLS
- 2026-05-10 Listing Removed — GAMLS
- 2026-03-27 Price Changed $140,000 GAMLS
- 2026-02-24 Price Changed $150,000 GAMLS
- 2026-02-10 Listed $170,000 GAMLS
- 2024-10-28 Listing Removed — FMLS
- 2024-07-17 Listed $169,000 FMLS
- 2019-04-05 Sold (Public Records) $94,000 Public Records
- 2019-03-29 Sold (MLS) $94,000 FMLS
- 2019-03-28 Sold (MLS) $94,000 GAMLS
- 2019-02-06 Pending — FMLS
- 2019-01-28 Pending — FMLS
- 2019-01-28 Pending — GAMLS
- 2019-01-11 Price Changed $105,000 GAMLS
- 2019-01-11 Price Changed $105,000 FMLS
- 2018-12-12 Listed $110,000 GAMLS
- 2018-12-12 Listed $110,000 FMLS
- 2017-07-11 Sold (Public Records) $57,500 Public Records
- 2017-06-27 Sold (MLS) $57,500 GAMLS
- 2017-06-27 Sold (MLS) $57,500 FMLS
- 2017-06-24 Pending — GAMLS
- 2017-06-24 Contingent — FMLS
- 2017-06-12 Pending — FMLS
- 2017-06-02 Listed $64,275 FMLS
- 2017-06-02 Listed $64,275 GAMLS
- 2017-06-01 Listing Removed — GAMLS
- 2017-04-25 Relisted — GAMLS
- 2017-04-19 Pending — GAMLS
- 2017-02-26 Price Changed $64,275 GAMLS
- 2016-12-19 Listed $66,775 GAMLS
- 2016-11-30 Listing Removed — GAMLS
- 2016-09-09 Price Changed $70,290 GAMLS
- 2016-08-10 Price Changed $72,464 GAMLS
- 2016-07-12 Price Changed $73,943 GAMLS
- 2016-06-21 Listed $76,230 GAMLS
- 2013-02-14 Sold (Public Records) $46,100 Public Records
- 2003-01-07 Sold (Public Records) $124,000 Public Records
- 1976-04-01 Sold (Public Records) $16,500 Public Records
Property tax history
+4.2%/yrLatest (2025): $3,590 · -13.4% YoY. Source: county tax records.
Cash-flow waterfall
monthlySold comps — $/sqft
last 12 mo · ≤1 miLoading sold comps…