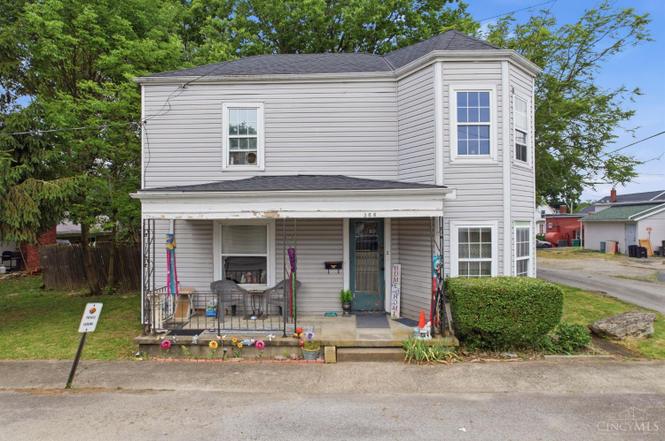
306 S Pleasant St · Georgetown, OH
Flood risk 1/10 · Minimal
- FEMA flood zone
- X (unshaded)
- Chance of flooding over 30 yrs
- 0.0%
- Est. flood insurance / yr
- $507 – $1,088
Fire risk 1/10 · Minimal
- Est. fire insurance / yr
- $713 – $1,323
Heat risk 4/10 · Minor
- Hot days now (above 101°F)
- 7 days/yr
- Hot days in 30 yrs
- 19 days/yr
Wind risk 2/10 · Minimal
- Chance of severe wind over 30 yrs
- 1.0%
Air-quality risk 2/10 · Minimal
- Unhealthy air days now
- 1 days/yr
- Unhealthy air days in 30 yrs
- 2 days/yr
Risk factors via First Street. Map © Google.
Why this score? — see what drove the B+ grade
The composite is a weighted blend of 9 inputs, each scored 0–100. Each bar is that input's sub-score; the figure is the points it added to the 100-point composite (weight × sub-score).
- Cash flow +30.0/30.0
- ARV discount +15.0/15.0
- DSCR +10.0/10.0
- 1% rule +8.3/10.0
- Schools +5.0/10.0
- Livability +3.4/5.0
- Rent growth +2.5/5.0
- Condition / age +2.5/5.0
- Appreciation +0.0/10.0
$99,900
🖨 Deal sheet (PDF) 📄 Offer letter ✓ Due diligence
Listing remarks MLS
Newly Remolded Home Close To Every Thing Would Make Nice Location For Offic E.
Key facts
- Fenced yard
- Turret-style bay
- Stunning staircase
Tags
Property features AI
Finance
- Other: Directions: Take 125 into Georgetown, turn right on South Pleasant Street. Home is on the right.
- HOA & community: No HOA
Exterior
- Utilities: Public water; Public sewer; Natural gas
- Home design: Victorian style; Single family home; Two levels
- Construction: Vinyl siding; Block foundation
- Exterior features: Metal and privacy fencing; Shingle roof; Vinyl and wood windows; Shed on the property; Less than 0.5 acre lot (approximately 66' x 99'); Residential zoning
Interior
- Kitchen: 13 x 12 kitchen; Oven/Range; Refrigerator
- Bedrooms: Three bedrooms — primary on level 1 (9 x 13), two bedrooms on level 2 (12 x 16 and 13 x 15)
- Bathrooms: One full bathroom on level 1
- Heating & cooling: Electric forced-air heating; Electric water heater
- Interior features: Seven total rooms; Crawl basement; Handyman special
Neighborhood map
What this means for you Summary
Snapshot
- This is a 4-bed/1.0-bath single-family listed at $100k.
Deal economics
- At list price, monthly cash flow is $421 ($5k/yr) — positive.
- The deal already cash-flows at list — no discount required.
- Meets the 1% rule at list price ($1k rent vs $100k).
Location & tenants
- Location reads 68/100 on livability (#585 in OH) — a middle-class / working-renter tenant base. Strengths: crime A+, cost of living A+; Watch: amenities D, commute F, employment F.
- Georgetown Exempted Village (rural): math 56% / reading 64% proficiency, ranked #307 of 656 in OH (top 47%) — acceptable for families but not a draw, mixed tenant base, ~2y average lease.
- Market conditions: 27 active listings in the ZIP; 147 units permitted in Brown County in 2024 (0 in 5+ unit buildings).
Forward outlook
- Local home prices are declining (-3.0%/yr); year-one equity from $691 of loan paydown is wiped out by about $3k of value loss. Plan a longer hold.
- Brown County population projected at -26% by 2050 — secular population decline; favor cash flow + early exit over multi-decade hold.
- At projected returns (-3.0% appreciation + 3.0% rent growth), your $28k cash investment doubles in ~7 years — after that, you're playing with house money.
Negotiation context
- Only 12 days on market — expect competitive offers; lowballing is unlikely to land.
- 2 sale attempts since 29y ago with the ask held roughly flat each time — persistent listings suggest the price (not the market) is what's stuck; bring a comps-based counter.
- Current owner paid $54k; list at $100k implies a 87% gain — meaningful room to come down on a strong offer.
Questions for the listing agent
- Is there a deadline driving the sale (1031 exchange, divorce, estate, relocation)? That informs how much negotiation room exists.
- What's the average days-on-market for RENTAL listings here right now (not sales)? A rising rental-DOM trend means longer vacancies and softer asking-rent achievability than the comps imply.
- What's the recent tenant-quality profile in this submarket — average credit score on applications, eviction rate, late-payment / NSF rate, and stable-employment percentage? A property-management company in the area should have these aggregated.
- How much new for-sale + rental construction is in the pipeline within 1–3 miles? Heavy new supply typically softens prices + rents 12–24 months out; constrained supply supports both.
Investment metrics
- 1% rule
- 1.33% ✓
- Cap rate
- 11.35%
- Cash-on-cash
- 18.04%
- DSCR
- 1.80
- GRM
- 6.3
CMA / ARV
- ARV (on-the-fly)
- $180,597
- Comps found
- 7
Show comp detail 7 sales within ~0.75 mi
| Address | Dist | Beds/Ba | Sqft | Sold | Price | $/sf | Match |
|---|---|---|---|---|---|---|---|
| 307 S Apple St | 0.12mi | 3/2.0 (-1) | 1,800 (+11%) | 15mo | $199,000 | $111 | 55 |
| 403 Elmwood Ct | 0.47mi | 3/2.5 (-1) | 1,711 (+5%) | 5mo | $260,000 | $152 | 54 |
| 404 E State St | 0.29mi | 3/1.5 (-1) | 1,783 (+10%) | 14mo | $168,000 | $94 | 51 |
| 414 N Water St | 0.41mi | 3/2.5 (-1) | 1,484 (-9%) | 8mo | $197,000 | $133 | 48 |
| 425 Lincoln Ave | 0.43mi | 3/1.0 (-1) | 1,818 (+12%) | 15mo | $195,000 | $107 | 43 |
| 521 Mount Orab Pike | 0.61mi | 4/2.5 | 1,749 (+8%) | 12mo | $220,000 | $126 | 43 |
| 57 Free Soil Rd | 0.58mi | 3/1.0 (-1) | 1,400 (-14%) | 21mo | $128,000 | $91 | 28 |
Match score weights: distance 35% · size 25% · config 20% · recency 20%. Top-matched comps best support the ARV.
Projected returns pro-forma
-3.0% appreciation · 3.0% rent growth · sell at horizon
- IRR
- 9.6%
- Equity multiple
- 1.38×
- Total profit
- $10,581
- Equity at exit
- $14,895
- IRR
- 18.7%
- Equity multiple
- 2.56×
- Total profit
- $43,632
- Equity at exit
- $8,638
Cash invested: $27,972 (down + closing). Projections, not guarantees.
Landlord ↔ Tenant lean methodology
- Overall (STATE)
- 73 Landlord-Friendly
- State Ohio
- 73 Landlord-Friendly · R+6
- County
- — inherits STATE
- City
- — inherits STATE
ZIP-level market 45121
- Home prices YoY
- -5.5%
- Active inventory
- 27
- Price-to-rent
- 6.3×
Monthly cashflow live
- Estimated rent
- $1,327 medium interval (Pro) →
- Mortgage (P&I)
- −$524
- Tax from tax record
- −$62 /mo · $744/yr
- Insurance
- −$42
- HOA
- −$0
- Vacancy / Maint / Mgmt
- −$279
- Net cashflow
- $421
Break-even live
Sensitivity live
| Price | -10% $477 | -5% $449 | +0% $421 | +5% $392 | +10% $364 |
|---|---|---|---|---|---|
| Rent | -10% $316 | -5% $368 | +0% $421 | +5% $473 | +10% $525 |
| Rate | -1.0pp $471 | -0.5pp $446 | base $421 | +0.5pp $395 | +1.0pp $368 |
UW: 25.0% down · 7.5% · 30yr · 1.5% tax · 5.0% vac · 8.0% maint · 8.0% mgmt
Financing live
Cash to close
- Down payment
- $24,975
- Closing costs
- $2,997
- Reserves months
- —
- Total cash needed
- —
Loan-product check · same deal, 3 products live
Conventional
25% down · 7.5% · 30yr
- Down + closing
- —
- Monthly P&I
- —
- Monthly cashflow
- —
- DSCR
- —
- Eligible?
- —
Personal DTI + credit; lowest rate.
DSCR
20% down · 8.5% · 30yr
- Down + closing
- —
- Monthly P&I
- —
- Monthly cashflow
- —
- DSCR
- —
- Eligible?
- —
No personal income docs; deal must DSCR.
Hard money
10% down · 12.0% · 12mo
- Down + closing
- —
- Monthly P&I
- —
- Monthly cashflow
- —
- DSCR
- —
- Eligible?
- —
Short-term bridge; refi at stabilization.
Listing history 10 events
-
2026-06-21days on market $99,900 Active 12 DOM
-
2026-06-21days on market $99,900 Active 11 DOM
-
2026-06-18days on market $99,900 Active 9 DOM
-
2026-06-17days on market $99,900 Active 8 DOM
-
2026-06-16days on market $99,900 Active 7 DOM
-
2026-06-15days on market $99,900 Active 6 DOM
-
2026-06-13days on market $99,900 Active 4 DOM
-
2026-06-12days on market $99,900 Active 3 DOM
-
2026-06-09remarks 688-char remark
-
2026-06-09$99,900 Active 1 DOM
ⓘ Source: listings_history table (triggers on properties + properties_extension) + one-shot
backfill from property_details.listing_events for pre-trigger history.
Tax reassessment forecast OH · Partial reset (capped growth)
- Current annual tax
- $744 · $62/mo
- Projected year-2 tax
- $1,151 · $96/mo
- Expected delta
- +$407/yr (+$34/mo · 54.8%)
ⓘ Screening estimate from a state-policy table — verify with the county assessor before closing.
Climate risk First Street
- Flood 1/10 Low FEMA zone X (unshaded) · 0% chance over 30 yrs
- Wildfire 1/10 Low
- Heat 4/10 Moderate 7 d/yr ≥101°F today · 19 d/yr by 30 yrs out
- Wind 2/10 Low 100% chance of damaging wind over 30 yrs
- Air quality 2/10 Low 1 unhealthy d/yr today · 2 by 30 yrs out
Nearby sold comps map
Loading sold comps map…
Walkable amenities ~0.75 mi
Loading nearby amenities…
Taxation est. · year 1
- Rental income
- $15,920
- − Mortgage interest
- −$5,596
- − Property taxes
- −$744
- − Insurance
- −$500
- − Repairs & maintenance
- −$1,274
- − Management
- −$1,274
- − Depreciation
- −$2,906
- Taxable income
- $3,628
- Est. tax owed @ 24.0%
- −$871
- After-tax cash flow
- $4,177/yr
For passive investors: Depreciation is non-cash, so a rental often shows a tax loss while cash-flowing — sheltering income. Rental losses are passive: they offset passive income freely, and up to $25,000/yr can offset ordinary (W-2) income if you actively participate and your MAGI is under $100k (phasing out to $0 by $150k); unused losses carry forward. On sale, claimed depreciation is recaptured at up to 25%, and gains may owe capital-gains tax (a 1031 exchange can defer both). Figures are a year-1 estimate at your 24.0% rate — not tax advice; consult a CPA.
Schools (NCES district)
- District
- Georgetown Exempted Village
- NCES district ID
- 3904537
- Math proficiency
- 56% ▼ -5.00%
- Reading proficiency
- 64% ▼ -5.00%
- Median HH income
- $39,226
- Composite
- 50.02/100
- National rank
- #1919
- State rank
- #307 of 656 in OH
Livability — Georgetown
- Score
- 68/100
- State rank
- #585
- US rank
- #9982
Category grades
Schools grade is shown separately in the Schools card above.
Census & demographics
- Census place
- Georgetown, OH
- County
- Brown · 38,418 people
- City population
- 8,931
- Metro
- Cincinnati, OH-KY-IN
- Population (ZIP)
- 8,931
- Household income
- $57,274
- Rent vs Own
- Severe rent burden
- 9.5
Population outlook (Brown County) Hauer SSP2
- Today (2025)
- 41,243 people
- By 2030
- 39,382 · -4.5%
- By 2040
- 35,196 · -14.7%
- By 2050
- 30,743 · -25.5%
- By 2075
- 21,870 · -47.0%
- By 2100
- 15,069 · -63.5%
Race, ethnicity, and origin ACS 2023
- Neighborhood character
- Predominantly White (96%)
- Race & ethnicity
- White 96% Black 2% Two or more races 1%
- Common ancestry
- Lithuanian 3% Italian 1% Slovak 1%
- Foreign-born
- 1% · Canada
- Languages at home
- 98% English-only · German/W. Germanic 1%
Political lean MEDSL · Brown
- 2024 margin
- Solid R (+61.5) · D 19.0% · R 80.5%
- 2008→2024 swing
- -38.2pp toward R · 2008: -23.3pp · 2024: -61.5pp
- All cycles
- 2024: R+61.5 2020: R+57.4 2016: R+52.2 2012: R+25.1 2008: R+23.3
Not yet ingested
- Civics
- —
Market trends
- HPI YoY
- ▼ -16.94%
- Current HPI
- 290.4078
- Rent YoY
- —
- Metro
- —
- State GDP YoY
- ▲ 1.98%
- F500 in state
- 48
Industry mix (Fortune 500 HQ in OH)
| Industry | F500 HQs | Revenue |
|---|---|---|
| Insurance | 3 | $145B |
|
||
| Industrial Machinery | 3 | $49B |
|
||
| Financial Services | 3 | $24B |
|
||
| Consumer Goods | 2 | $93B |
|
||
| Aerospace / Defense | 2 | $47B |
|
||
| Utilities | 2 | $33B |
|
||
Price history
+256.8% since first listed5 events — show timeline
- 2026-06-09 Listed $99,900 Cincy MLS
- 1997-08-04 Sold (Public Records) $53,500 Public Records
- 1997-07-28 Sold (MLS) $53,500 Cincy MLS
- 1997-05-12 Listed $58,000 Cincy MLS
- 1996-12-19 Sold (Public Records) $28,000 Public Records
Property tax history
-1.8%/yrLatest (2025): $744 · +0.0% YoY. Source: county tax records.
Cash-flow waterfall
monthlySold comps — $/sqft
last 12 mo · ≤1 miLoading sold comps…