 🏗️ New Construction
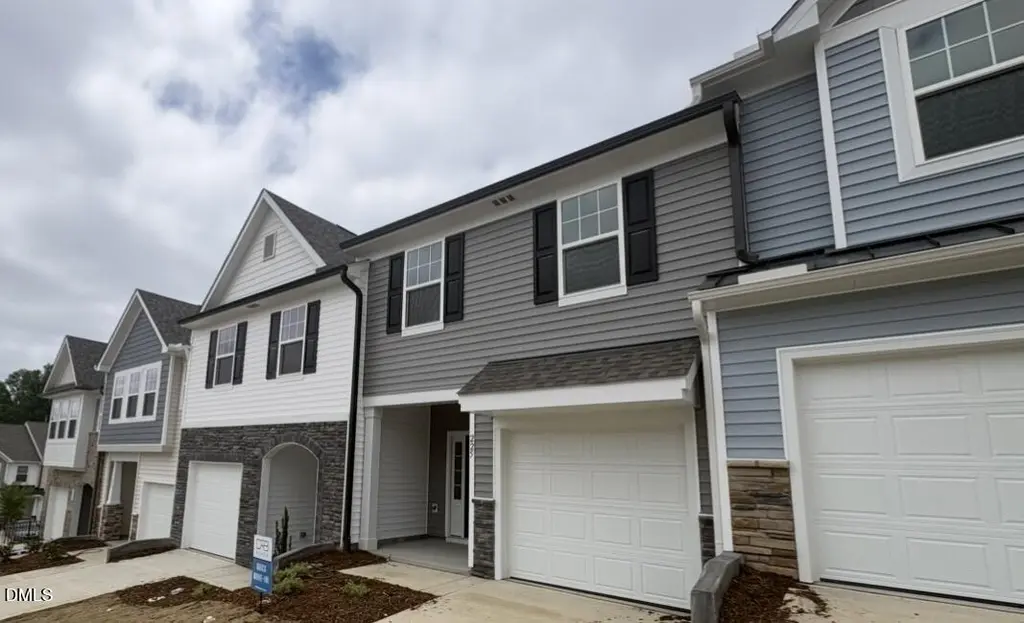
224 Alberta Dr · Franklinton, NC
Flood risk No data
- FEMA flood zone
- —
- Chance of flooding over 30 yrs
- —
- Est. flood insurance / yr
- —
Fire risk No data
- Est. fire insurance / yr
- —
Heat risk No data
- Hot days now (above threshold)
- —
- Hot days in 30 yrs
- —
Wind risk No data
- Chance of severe wind over 30 yrs
- —
Air-quality risk No data
- Unhealthy air days now
- —
- Unhealthy air days in 30 yrs
- —
Risk factors via First Street. Map © Google.
Why this score? — see what drove the D- grade
The composite is a weighted blend of 9 inputs, each scored 0–100. Each bar is that input's sub-score; the figure is the points it added to the 100-point composite (weight × sub-score).
- Appreciation +9.2/10.0
- ARV discount +7.5/15.0
- Cash flow +5.9/30.0
- Livability +3.1/5.0
- Schools +3.0/10.0
- Rent growth +2.5/5.0
- Condition / age +2.5/5.0
- 1% rule +1.3/10.0
- DSCR +0.3/10.0
$248,990
🖨 Deal sheet (PDF) 📄 Offer letter ✓ Due diligence
Listing remarks
Discover the sought-after Litchfield floorplan featuring 3 bedrooms, 2.5 baths, and 1 car garage in Prime Franklinton location. The spacious Family room w/ (9th ceilings opens to the Kitchen w/ Central Island, Upgrade cabinets, SS appliances, eat in Dining & access to Outdoor Patio, Yard & Storage. Large Primary suite w/ walk in closet, sitting area, bathroom w/ dual vanity, Quartz Countertops, & Walk In Tile Shower. LVP Entire 1st Floor, all Baths & Laundry. Located right off Capitol Blvd. and just minutes to downtown Franklinton, this home offers excellent access to shopping, dining, and major commuter routes. A fantastic opportunity in a fast-growing area! * *
Key facts
- Garage
- Built 2026
- Listed 8 days
Property features AI
Finance
- HOA & community: Pindell-Wilson association; One-time association fee of 250.00 (includes grounds maintenance and storm water maintenance)
Exterior
- Parking: Attached garage (1-car); Additional parking and overflow parking areas; Concrete driveway; Garage; Total parking for 20 vehicles
- Utilities: Public water; Public sewer; Natural gas connected; Cable available and connected; Water connected
- Home design: Townhouse; Two levels; New construction; 2+ common walls; Unit 143
- Construction: Vinyl siding; Composition shingle roof; Slab foundation; Building model: Litchfield
- Exterior features: Private yard; Patio; Rain gutters; Wrought iron fencing (back yard)
Interior
- Kitchen: Dishwasher; Electric range; Exhaust fan; Microwave
- Bedrooms: 3 bedrooms
- Flooring: Carpet; Luxury vinyl
- Bathrooms: 2 full bathrooms; 1 half bathroom
- Heating & cooling: Forced air heating; Central air conditioning
- Interior features: Double vanity; Eat-in kitchen; Entrance foyer; Granite counters; Kitchen island; Open floorplan; Pantry; Quartz counters; Smooth ceilings; Storage; Double pane windows; Insulated windows; Window screens
- Laundry & utility: Laundry on upper level
Neighborhood map
What this means for you Summary
Snapshot
- This is a 3-bed/2.5-bath townhouse listed at $249k.
Deal economics
- At list price, monthly cash flow is $-543 ($-7k/yr) — negative.
- To cash-flow at today's rent, offer at most $199k (20.2% below list).
- To meet the 1% rule (rent ≥ 1% of price), the offer needs to be $174k (30.2% below list).
- Recommended offer: $174k (30.2% below list) — sets the bar for 1% rule.
- Cap rate 3.9% vs local median 3.1% in Franklinton — meaningfully above typical; check what's discounted (condition, days-on-market, listing class) to confirm the premium yield is real.
Location & tenants
- Location reads 61/100 on livability (#491 in NC) — a middle-class / working-renter tenant base. Strengths: cost of living A+, housing A+; Watch: crime D, amenities F, commute F.
- Franklin County Schools (rural): math 34% / reading 37% proficiency, ranked #128 of 178 in NC (top 72%) — families likely to look elsewhere, expect single-tenant / working-renter base with shorter leases.
- Zoned schools: Franklinton Elementary (math 29% / reading 25%, grade F, #1,033 of 1,410 statewide, top 76%, 522 students, 81% FRL); Franklinton Middle (math 26% / reading 27%, grade F, #381 of 475 statewide, top 81%, 247 students, 78% FRL); Franklinton High (math 57% / reading 60%, grade C, #235 of 535 statewide, top 45%, 1,182 students, 48% FRL).
- Market conditions: 251 active listings in the ZIP; 948 units permitted in Franklin County in 2024 (0 in 5+ unit buildings).
Forward outlook
- In year one you build about $25k of equity ($2k loan paydown + $23k appreciation (8.4% local appreciation)).
- Franklin County population projected at +13% by 2050 — modest demand growth; plan on rents tracking national, not racing it.
- By year 2, paydown + projected appreciation supports a ~$40k cash-out refi (75% LTV) — recoverable capital for the next deal without selling this one.
Negotiation context
- Only 8 days on market — expect competitive offers; lowballing is unlikely to land.
Questions for the listing agent
- What do current leases actually rent for vs. the listed asking? Can we see a recent rent roll and the last 12 months of T-12 income?
- Is there a deadline driving the sale (1031 exchange, divorce, estate, relocation)? That informs how much negotiation room exists.
- Schools are F-rated, which usually means shorter tenancies and higher turnover. Who's the typical renter profile here, and what's been the actual vacancy rate?
- Crime grade is D in this area — have there been break-ins, vandalism, or insurance claims at this property in the last 3 years? What carrier currently insures it and at what premium?
- The area grade is low — what's the realistic commute time and amenity access for the typical tenant pool here? Any planned neighborhood developments (good or bad) we should know about?
- What's the average days-on-market for RENTAL listings here right now (not sales)? A rising rental-DOM trend means longer vacancies and softer asking-rent achievability than the comps imply.
- What's the recent tenant-quality profile in this submarket — average credit score on applications, eviction rate, late-payment / NSF rate, and stable-employment percentage? A property-management company in the area should have these aggregated.
- How much new for-sale + rental construction is in the pipeline within 1–3 miles? Heavy new supply typically softens prices + rents 12–24 months out; constrained supply supports both.
Investment metrics
- 1% rule
- 0.63% ✗
- Cap rate
- 3.94%
- Cash-on-cash
- -8.39%
- DSCR
- 0.63
- GRM
- 13.3
CMA / ARV
- ARV (on-the-fly)
- $277,319
- Comps found
- 2
Show comp detail 2 sales within ~0.75 mi
| Address | Dist | Beds/Ba | Sqft | Sold | Price | $/sf | Match |
|---|---|---|---|---|---|---|---|
| 113 Blandford St | 0.04mi | 3/2.5 | 1,561 (-3%) | 8mo | $269,900 | $173 | 87 |
| 251 Blandford St | 0.09mi | 3/2.5 | 1,696 (+6%) | 7mo | $255,000 | $150 | 80 |
Match score weights: distance 35% · size 25% · config 20% · recency 20%. Top-matched comps best support the ARV.
Projected returns pro-forma
8.42% appreciation · 3.0% rent growth · sell at horizon
- IRR
- 14.7%
- Equity multiple
- 2.12×
- Total profit
- $87,207
- Equity at exit
- $218,685
- IRR
- 14.5%
- Equity multiple
- 4.60×
- Total profit
- $279,256
- Equity at exit
- $441,945
Cash invested: $77,649 (down + closing). Projections, not guarantees.
Landlord ↔ Tenant lean methodology
- Overall (STATE)
- 85 Strongly Landlord-Friendly
- State North Carolina
- 85 Strongly Landlord-Friendly · R+3
- County
- — inherits STATE
- City
- — inherits STATE
ZIP-level market 27525
- Home prices YoY
- 3.0%
- Active inventory
- 251
- Price-to-rent
- 11.9×
Monthly cashflow live
- Estimated rent
- $1,739 medium interval (Pro) →
- Mortgage (P&I)
- −$1,454
- Tax est. 1.5%
- −$347 /mo · $4,160/yr
- Insurance
- −$116
- HOA
- −$0
- Vacancy / Maint / Mgmt
- −$365
- Net cashflow
- $-543
Break-even live
Sensitivity live
| Price | -10% $-351 | -5% $-447 | +0% $-543 | +5% $-639 | +10% $-735 |
|---|---|---|---|---|---|
| Rent | -10% $-680 | -5% $-612 | +0% $-543 | +5% $-474 | +10% $-406 |
| Rate | -1.0pp $-403 | -0.5pp $-472 | base $-543 | +0.5pp $-615 | +1.0pp $-688 |
UW: 25.0% down · 7.5% · 30yr · 1.5% tax · 5.0% vac · 8.0% maint · 8.0% mgmt
Financing live
Cash to close
- Down payment
- $69,330
- Closing costs
- $8,320
- Reserves months
- —
- Total cash needed
- —
Loan-product check · same deal, 3 products live
Conventional
25% down · 7.5% · 30yr
- Down + closing
- —
- Monthly P&I
- —
- Monthly cashflow
- —
- DSCR
- —
- Eligible?
- —
Personal DTI + credit; lowest rate.
DSCR
20% down · 8.5% · 30yr
- Down + closing
- —
- Monthly P&I
- —
- Monthly cashflow
- —
- DSCR
- —
- Eligible?
- —
No personal income docs; deal must DSCR.
Hard money
10% down · 12.0% · 12mo
- Down + closing
- —
- Monthly P&I
- —
- Monthly cashflow
- —
- DSCR
- —
- Eligible?
- —
Short-term bridge; refi at stabilization.
Listing history 9 events
-
2026-06-21days on market $248,990 Active 8 DOM
-
2026-06-21days on market $248,990 Active 7 DOM
-
2026-06-18days on market $248,990 Active 5 DOM
-
2026-06-17days on market $248,990 Active 4 DOM
-
2026-06-17price $248,990 Active 3 DOM
-
2026-06-16days on market $258,725 Active 3 DOM
-
2026-06-15days on market $258,725 Active 2 DOM
-
2026-06-14remarks 683-char remark
-
2026-06-14$258,725 Active 1 DOM
ⓘ Source: listings_history table (triggers on properties + properties_extension) + one-shot
backfill from property_details.listing_events for pre-trigger history.
Nearby sold comps map
Loading sold comps map…
Walkable amenities ~0.75 mi
Loading nearby amenities…
Taxation est. · year 1
- Rental income
- $20,865
- − Mortgage interest
- −$15,534
- − Property taxes
- −$4,160
- − Insurance
- −$1,387
- − Repairs & maintenance
- −$1,669
- − Management
- −$1,669
- − Depreciation
- −$8,067
- Taxable loss
- −$11,622
- Est. tax savings @ 24.0%
- +$2,789
- After-tax cash flow
- $-3,725/yr
For passive investors: Depreciation is non-cash, so a rental often shows a tax loss while cash-flowing — sheltering income. Rental losses are passive: they offset passive income freely, and up to $25,000/yr can offset ordinary (W-2) income if you actively participate and your MAGI is under $100k (phasing out to $0 by $150k); unused losses carry forward. On sale, claimed depreciation is recaptured at up to 25%, and gains may owe capital-gains tax (a 1031 exchange can defer both). Figures are a year-1 estimate at your 24.0% rate — not tax advice; consult a CPA.
Schools (NCES district)
- District
- Franklin County Schools
- NCES district ID
- 3701530
- Math proficiency
- 34% ▬ 0.00%
- Reading proficiency
- 37% ▼ -4.00%
- Median HH income
- $44,630
- Composite
- 30.25/100
- National rank
- #6286
- State rank
- #128 of 178 in NC
Livability — Franklinton
- Score
- 61/100
- State rank
- #491
- US rank
- #18002
Category grades
Schools grade is shown separately in the Schools card above.
Census & demographics
- Census place
- Franklinton, NC
- County
- Franklin County · 64,885 people
- City population
- 17,110
- Metro
- Raleigh-Cary, NC
- Population (ZIP)
- 17,110
- Household income
- $73,036
- Rent vs Own
- Severe rent burden
- 446.0
Population outlook (Franklin County) Hauer SSP2
- Today (2025)
- 69,848 people
- By 2030
- 72,480 · +3.8%
- By 2040
- 76,682 · +9.8%
- By 2050
- 78,993 · +13.1%
- By 2075
- 82,888 · +18.7%
- By 2100
- 80,784 · +15.7%
Race, ethnicity, and origin ACS 2023
- Neighborhood character
- Predominantly White (66%)
- Race & ethnicity
- White 66% Black 24% Hispanic / Latino 6% Two or more races 5%
- Hispanic origin (detail)
- Mexican 3% Cuban 2%
- Common ancestry
- Slovak 3% Serbian 2% Italian 2%
- Foreign-born
- 3% · Canada
- Languages at home
- 94% English-only · Spanish 3% German/W. Germanic 1%
Political lean MEDSL · Franklin
- 2024 margin
- R (+13.6) · D 42.7% · R 56.3%
- 2008→2024 swing
- -12.9pp toward R · 2008: -0.7pp · 2024: -13.6pp
- All cycles
- 2024: R+13.6 2020: R+13.4 2016: R+11.7 2012: R+4.2 2008: R+0.7
Not yet ingested
- Civics
- —
Market trends
- HPI YoY
- ▲ 8.42%
- Current HPI
- 294.1531
- Rent YoY
- —
- Metro
- Raleigh-Cary, NC
- State GDP YoY
- ▲ 3.28%
- F500 in state
- 26
Industry mix (Fortune 500 HQ in NC)
| Industry | F500 HQs | Revenue |
|---|---|---|
| Financial Services | 2 | $213B |
|
||
| Retail | 2 | $95B |
|
||
| Industrial Conglomerate | 1 | $38B |
|
||
| Metals / Steel | 1 | $35B |
|
||
| Utilities | 1 | $30B |
|
||
| Industrial Machinery | 1 | $19B |
|
||
Price history
1 event — show timeline
- 2026-06-13 Listed $258,725 TMLS
Cash-flow waterfall
monthlySold comps — $/sqft
last 12 mo · ≤1 miLoading sold comps…