 5-Plex
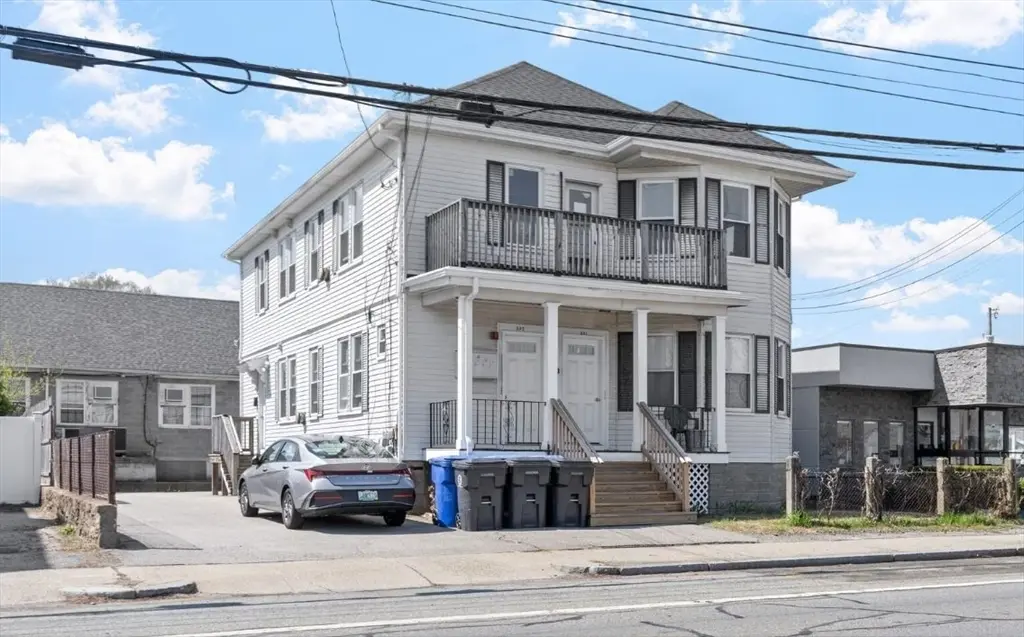
391 Waterman Ave · East Providence, RI
Flood risk No data
- FEMA flood zone
- —
- Chance of flooding over 30 yrs
- —
- Est. flood insurance / yr
- —
Fire risk No data
- Est. fire insurance / yr
- —
Heat risk No data
- Hot days now (above threshold)
- —
- Hot days in 30 yrs
- —
Wind risk No data
- Chance of severe wind over 30 yrs
- —
Air-quality risk No data
- Unhealthy air days now
- —
- Unhealthy air days in 30 yrs
- —
Risk factors via First Street. Map © Google.
Why this score? — see what drove the D+ grade
The composite is a weighted blend of 9 inputs, each scored 0–100. Each bar is that input's sub-score; the figure is the points it added to the 100-point composite (weight × sub-score).
- Cash flow +23.7/30.0
- DSCR +7.6/10.0
- 1% rule +5.3/10.0
- Livability +3.7/5.0
- Rent growth +2.5/5.0
- Condition / age +2.5/5.0
- Schools +2.2/10.0
- ARV discount +0.0/15.0
- Appreciation +0.0/10.0
$875,000
🖨 Deal sheet (PDF) 📄 Offer letter ✓ Due diligence
Multi-family units
County records classify this as Multi-Family (5+ Unit). Listing-text estimate: 5 units. confirmed
5+ unit building — per-unit beds/baths from public records are typically unavailable; the breakdown below (if shown) is an estimate from the listing text.
Listing remarks
This well-maintained 5-unit property features a unit mix of 3 studios and 2 one-bedroom apartments. It currently generates $6,200 in monthly rental income with clear upside potential through rent increases to market levels. Two out of five apartments have been renovated. The property has had key capital improvements already completed, including a new roof (2022), repaved driveway (2016), and majority of windows replaced (2025), minimizing short-term capital expenditure for a new owner. The building is serviced by a single Weil-McLain gas boiler providing heat to all units. Current ownership covers gas and electric, presenting a clear value-add opportunity to separate utilities and improve o
Key facts
- Repaved driveway
- New roof
- 4,397 sq ft lot
Tags
Property features AI
Finance
- Other: Total building area approximately 2,672 (listed as building area)
- HOA & community: Not a senior community
Exterior
- Parking: Open parking available for 7 vehicles
- Utilities: Public water; Public sewer; Common electricity
- Home design: 5-story multi-family building (5+ units up/down); Building contains multiple units with varied floor counts
- Construction: Frame construction; Concrete perimeter foundation; Built according to public records
- Exterior features: Paved driveway and off-street parking; Public sewer and public water (utilities listed under Utilities section)
Interior
- Bathrooms: 5 full bathrooms
- Interior features: 11 total rooms; Basement access via bulkhead and slab
Neighborhood map
What this means for you Summary
Snapshot
- This is a 3×?bd/1ba + 2×1bd/1ba units multifamily listed at $875k.
Deal economics
- At list price, monthly cash flow is $2k ($20k/yr) — positive. Per door: $332/mo.
- The deal already cash-flows at list — no discount required.
- Meets the 1% rule at list price ($9k rent vs $875k).
- Recommended offer: $849k (3.0% below list) — sets the bar for market timing.
- Cap rate 8.6% vs local median 3.1% in East Providence — top-decile yield for the area; either an underpriced asset or a hidden risk that comps aren't pricing in. Stress-test before assuming the spread holds.
Location & tenants
- Location reads 74/100 on livability (#12 in RI, #4,784 nationally) — a middle-class / working-renter tenant base. Strengths: crime A+, housing A+, health & safety A+; Watch: schools D-, amenities F, commute F.
- East Providence (suburban): math 18% / reading 31% proficiency, ranked #26 of 39 in RI (top 67%) — low school quality limits family demand, transient renter base, plan for 1-2y turnover.
- Market conditions: 64 active listings in the ZIP; 776 units permitted in Providence County in 2024 (229 in 5+ unit buildings).
- At $9,016/mo this rent would consume 177% of the median local household income ($61k/yr) (locally 1134% of renters already pay >50% of income on rent) — very limited rent-growth headroom before tenants either downsize or default.
Forward outlook
- Local home prices are declining (-3.0%/yr); year-one equity from $6k of loan paydown is wiped out by about $26k of value loss. Plan a longer hold.
- Providence County population projected at +5% by 2050 — modest demand growth; plan on rents tracking national, not racing it.
Negotiation context
- It's been on market 53 days — a 3% lower offer ($849k) is reasonable based on typical stale-listing flexibility.
- 3 sale attempts since 23y ago with the ask held roughly flat each time — persistent listings suggest the price (not the market) is what's stuck; bring a comps-based counter.
- Current owner paid $160k; list at $875k implies a 447% gain — meaningful room to come down on a strong offer.
Risks & watch-outs
- Watch-outs: built in 1920 — expect roof / HVAC / electrical / plumbing capex.
Questions for the listing agent
- It's been on market 53 days. Have you received any prior offers? Is the seller open to a 3% concession, seller financing, or rate buy-down credit?
- Can we see the unit-by-unit rent roll, current vacancy, and any below-market leases? What's the average tenancy length?
- What capital expenditures (roof, boiler, parking lot, exteriors) have been made in the last 5 years, and what's planned in the next 2?
- Built in 1920 — when were the roof, HVAC, electrical panel, plumbing, and water heater last replaced?
- Is there a deadline driving the sale (1031 exchange, divorce, estate, relocation)? That informs how much negotiation room exists.
- Schools are D-rated, which usually means shorter tenancies and higher turnover. Who's the typical renter profile here, and what's been the actual vacancy rate?
- The area grade is low — what's the realistic commute time and amenity access for the typical tenant pool here? Any planned neighborhood developments (good or bad) we should know about?
- What's the average days-on-market for RENTAL listings here right now (not sales)? A rising rental-DOM trend means longer vacancies and softer asking-rent achievability than the comps imply.
- What's the recent tenant-quality profile in this submarket — average credit score on applications, eviction rate, late-payment / NSF rate, and stable-employment percentage? A property-management company in the area should have these aggregated.
- How much new apartment / multifamily construction is in the pipeline within 1–3 miles? Heavy new supply (>2% of stock underway) typically softens rents 12–24 months out; light construction supports rent growth.
Investment metrics
- 1% rule
- 1.03% ✓
- Cap rate
- 8.57%
- Cash-on-cash
- 8.13%
- DSCR
- 1.36
- GRM
- 8.1
CMA / ARV
- ARV (median comp)
- $593,157
- List price
- $875,000
- Delta
- 47.52%
- Verdict
- OVERPRICED
- Comps
- 20 within 1.0 mi
Show comp detail 6 sales within ~0.75 mi
| Address | Dist | Beds/Ba | Sqft | Sold | Price | $/sf | Match |
|---|---|---|---|---|---|---|---|
| 134 136 Roma St | 0.37mi | 6/3.0 (-1) | 2,802 (+5%) | 2mo | $400,000 | $143 | 60 |
| 38 40 Vine St | 0.68mi | 7/3.0 | 2,736 (+2%) | 10mo | $657,000 | $240 | 48 |
| 43 45 Mary Ave | 0.47mi | 6/3.0 (-1) | 2,405 (-10%) | 6mo | $454,000 | $189 | 43 |
| 72 74 North County St | 0.24mi | 6/2.0 (-1) | 2,448 (-8%) | 19mo | $540,000 | $221 | 42 |
| 67 69 No Carpenter St | 0.49mi | 6/2.0 (-1) | 2,716 (+2%) | 20mo | $640,000 | $236 | 41 |
| 15 Belmont Ave | 0.73mi | 8/4.0 (+1) | 3,008 (+13%) | 12mo | $753,000 | $250 | 26 |
Match score weights: distance 35% · size 25% · config 20% · recency 20%. Top-matched comps best support the ARV.
Projected returns pro-forma
-3.0% appreciation · 3.0% rent growth · sell at horizon
- IRR
- -4.0%
- Equity multiple
- 0.85×
- Total profit
- $-36,292
- Equity at exit
- $130,465
- IRR
- 5.7%
- Equity multiple
- 1.42×
- Total profit
- $103,621
- Equity at exit
- $75,654
Cash invested: $245,000 (down + closing). Projections, not guarantees.
Landlord ↔ Tenant lean methodology
- Overall (STATE)
- 31 Tenant-Leaning
- State Rhode Island
- 31 Tenant-Leaning · D+8
- County
- — inherits STATE
- City
- — inherits STATE
ZIP-level market 02914
- Active inventory
- 64
- Price-to-rent
- 41.0×
Monthly cashflow live
- Estimated rent
- $9,016 high interval (Pro) →
- Mortgage (P&I)
- −$4,589
- Tax from tax record
- −$510 /mo · $6,115/yr
- Insurance
- −$365
- HOA
- −$0
- Vacancy / Maint / Mgmt
- −$1,893
- Net cashflow
- $1,660
Break-even live
Sensitivity live
| Price | -10% $2,155 | -5% $1,908 | +0% $1,660 | +5% $1,412 | +10% $1,165 |
|---|---|---|---|---|---|
| Rent | -10% $948 | -5% $1,304 | +0% $1,660 | +5% $2,016 | +10% $2,372 |
| Rate | -1.0pp $2,101 | -0.5pp $1,882 | base $1,660 | +0.5pp $1,433 | +1.0pp $1,202 |
5-unit breakdown (identical units grouped — click to expand)
| Units | Beds | Baths | Est. rent |
|---|---|---|---|
| 3× units | 0 | 1 | $5,343 |
| #1 | 0 | 1 | $1,781 |
| #2 | 0 | 1 | $1,781 |
| #3 | 0 | 1 | $1,781 |
| 2× units | 1 | 1 | $3,674 |
| #4 | 1 | 1 | $1,837 |
| #5 | 1 | 1 | $1,837 |
| Total (5 units) | $9,016 | ||
UW: 25.0% down · 7.5% · 30yr · 1.5% tax · 5.0% vac · 8.0% maint · 8.0% mgmt
Financing live
Cash to close
- Down payment
- $218,750
- Closing costs
- $26,250
- Reserves months
- —
- Total cash needed
- —
Loan-product check · same deal, 3 products live
Conventional
25% down · 7.5% · 30yr
- Down + closing
- —
- Monthly P&I
- —
- Monthly cashflow
- —
- DSCR
- —
- Eligible?
- —
Personal DTI + credit; lowest rate.
DSCR
20% down · 8.5% · 30yr
- Down + closing
- —
- Monthly P&I
- —
- Monthly cashflow
- —
- DSCR
- —
- Eligible?
- —
No personal income docs; deal must DSCR.
Hard money
10% down · 12.0% · 12mo
- Down + closing
- —
- Monthly P&I
- —
- Monthly cashflow
- —
- DSCR
- —
- Eligible?
- —
Short-term bridge; refi at stabilization.
Listing history 21 events
-
2026-06-21days on market $875,000 Active 53 DOM
-
2026-06-18days on market $875,000 Active 50 DOM
-
2026-06-17days on market $875,000 Active 49 DOM
-
2026-06-16days on market $875,000 Active 48 DOM
-
2026-06-15days on market $875,000 Active 47 DOM
-
2026-06-13days on market $875,000 Active 45 DOM
-
2026-06-13days on market $875,000 Active 44 DOM
-
2026-06-09days on market $875,000 Active 41 DOM
-
2026-06-08days on market $875,000 Active 40 DOM
-
2026-06-07days on market $875,000 Active 39 DOM
-
2026-06-03days on market $875,000 Active 35 DOM
-
2026-06-02days on market $875,000 Active 34 DOM
-
2026-06-01days on market $875,000 Active 33 DOM
-
2026-05-31days on market $875,000 Active 32 DOM
-
2026-04-29$875,000 New 927-char remark
-
2013-12-19price $179,000
-
2011-11-04historical
-
2011-11-04soldstatus $160,000
-
2011-06-25$189,000
-
2003-08-23historical
-
2003-06-09$255,000
ⓘ Source: listings_history table (triggers on properties + properties_extension) + one-shot
backfill from property_details.listing_events for pre-trigger history.
Tax reassessment forecast RI · Partial reset (capped growth)
- Current annual tax
- $6,115 · $510/mo
- Projected year-2 tax
- $10,189 · $849/mo
- Expected delta
- +$4,074/yr (+$339/mo · 66.6%)
ⓘ Screening estimate from a state-policy table — verify with the county assessor before closing.
Nearby sold comps map
Loading sold comps map…
Walkable amenities ~0.75 mi
Loading nearby amenities…
Taxation est. · year 1
- Rental income
- $108,192
- − Mortgage interest
- −$49,014
- − Property taxes
- −$6,115
- − Insurance
- −$4,375
- − Repairs & maintenance
- −$8,655
- − Management
- −$8,655
- − Depreciation
- −$25,455
- Taxable income
- $5,923
- Est. tax owed @ 24.0%
- −$1,422
- After-tax cash flow
- $18,497/yr
For passive investors: Depreciation is non-cash, so a rental often shows a tax loss while cash-flowing — sheltering income. Rental losses are passive: they offset passive income freely, and up to $25,000/yr can offset ordinary (W-2) income if you actively participate and your MAGI is under $100k (phasing out to $0 by $150k); unused losses carry forward. On sale, claimed depreciation is recaptured at up to 25%, and gains may owe capital-gains tax (a 1031 exchange can defer both). Figures are a year-1 estimate at your 24.0% rate — not tax advice; consult a CPA.
Schools (NCES district)
- District
- East Providence
- NCES district ID
- 4400330
- Math proficiency
- 18% ▼ -8.00%
- Reading proficiency
- 31% ▼ -5.00%
- Median HH income
- $51,011
- Composite
- 21.69/100
- National rank
- #8274
- State rank
- #26 of 39 in RI
Livability — East Providence
- Score
- 74/100
- State rank
- #12
- US rank
- #4784
Category grades
Schools grade is shown separately in the Schools card above.
Census & demographics
- Census place
- East Providence, RI
- County
- Providence County · 548,917 people
- City population
- 38,586
- Metro
- Providence-Warwick, RI-MA
- Population (ZIP)
- 21,834
- Household income
- $61,191
- Rent vs Own
- Severe rent burden
- 1134.0
Population outlook (Providence County) Hauer SSP2
- Today (2025)
- 653,469 people
- By 2030
- 660,819 · +1.1%
- By 2040
- 672,747 · +3.0%
- By 2050
- 683,741 · +4.6%
- By 2075
- 720,435 · +10.2%
- By 2100
- 741,582 · +13.5%
Race, ethnicity, and origin ACS 2023
- Neighborhood character
- Predominantly White (67%)
- Race & ethnicity
- White 67% Two or more races 12% Hispanic / Latino 12% Black 8% Asian 4% Native American 1%
- Hispanic origin (detail)
- Puerto Rican 4% Dominican 3%
- Common ancestry
- Russian 29% Lithuanian 4% Romanian 3%
- Foreign-born
- 24% · Canada, China
- Languages at home
- 67% English-only · Other Indo-European 20% Spanish 7% French/Haitian/Cajun 2%
Political lean MEDSL · Providence
- 2024 margin
- D (+14.4) · D 56.1% · R 41.7% · Other 2.2%
- 2008→2024 swing
- -20.0pp toward R · 2008: 34.4pp · 2024: 14.4pp
- All cycles
- 2024: D+14.4 2020: D+22.9 2016: D+21.2 2012: D+34.9 2008: D+34.4
Not yet ingested
- Civics
- —
Market trends
- HPI YoY
- ▼ -461.46%
- Current HPI
- 323.298
- Rent YoY
- —
- Metro
- Providence-Warwick, RI-MA
- State GDP YoY
- ▲ 2.25%
- F500 in state
- 10
Industry mix (Fortune 500 HQ in RI)
| Industry | F500 HQs | Revenue |
|---|---|---|
| Healthcare | 1 | $373B |
|
||
| Food Distribution | 1 | $31B |
|
||
| Aerospace / Defense | 1 | $14B |
|
||
| Financial Services | 1 | $8B |
|
||
| Consumer Goods | 1 | $4B |
|
||
Price history
+243.1% since first listed7 events — show timeline
- 2026-04-29 Listed $875,000 MLS PIN
- 2013-12-19 Price Changed $179,000 RIS
- 2011-11-04 Sold (Public Records) $160,000 Public Records
- 2011-11-04 Listing Removed — RIS
- 2011-06-25 Listed $189,000 RIS
- 2003-08-23 Listing Removed — RIS
- 2003-06-09 Listed $255,000 RIS
Property tax history
+2.1%/yrLatest (2025): $6,115 · +9.4% YoY. Source: county tax records.
Cash-flow waterfall
monthlySold comps — $/sqft
last 12 mo · ≤1 miLoading sold comps…