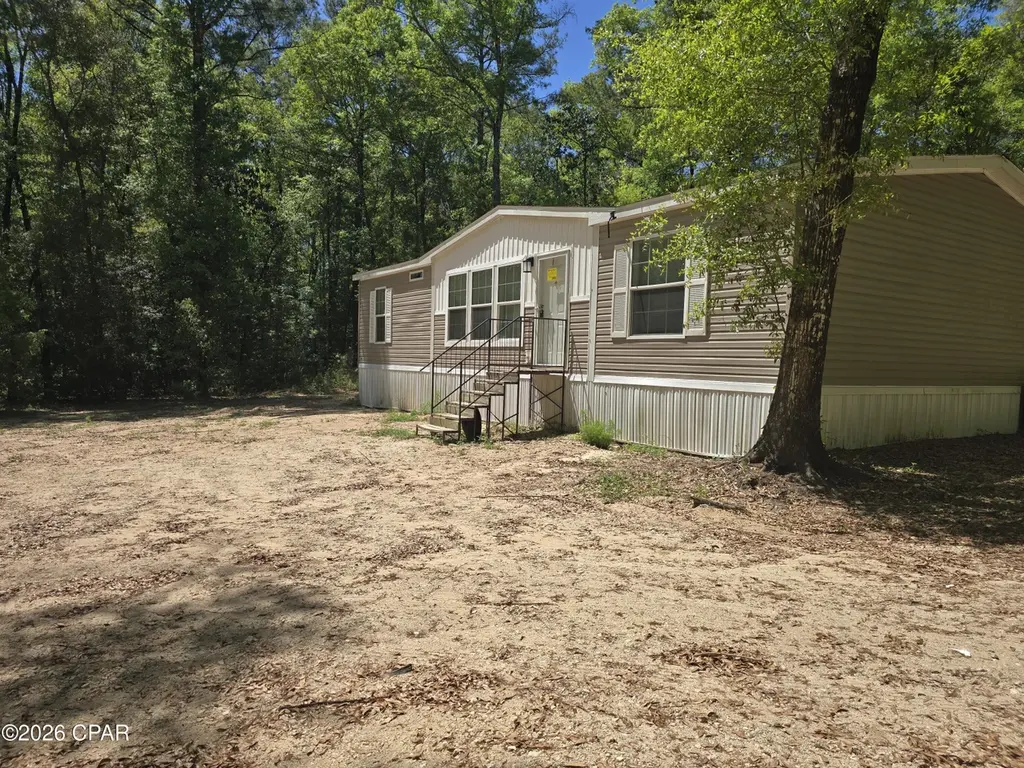
319 Clyde Brown Rd · Ponce De Leon, FL
Flood risk 1/10 · Minimal
- FEMA flood zone
- X (unshaded)
- Chance of flooding over 30 yrs
- 0.0%
- Est. flood insurance / yr
- $507 – $1,088
Fire risk 5/10 · Moderate
- Est. fire insurance / yr
- $947 – $1,759
Heat risk 9/10 · Severe
- Hot days now (above 107°F)
- 7 days/yr
- Hot days in 30 yrs
- 20 days/yr
Wind risk 9/10 · Severe
- Chance of severe wind over 30 yrs
- 99.0%
Air-quality risk 1/10 · Minimal
- Unhealthy air days now
- 0 days/yr
- Unhealthy air days in 30 yrs
- 0 days/yr
Risk factors via First Street. Map © Google.
Why this score? — see what drove the D grade
The composite is a weighted blend of 9 inputs, each scored 0–100. Each bar is that input's sub-score; the figure is the points it added to the 100-point composite (weight × sub-score).
- Appreciation +9.2/10.0
- ARV discount +7.5/15.0
- Cash flow +7.2/30.0
- Schools +5.2/10.0
- Livability +3.1/5.0
- Rent growth +2.5/5.0
- Condition / age +2.5/5.0
- 1% rule +2.0/10.0
- DSCR +1.3/10.0
$199,900
🖨 Deal sheet (PDF) 📄 Offer letter ✓ Due diligence
Listing remarks
Beautiful 3 Bedroom 2 Bath Home in Central Walton County! This home sits on a gorges 3.33+/- Acre lot that is littered with beautiful Oak Trees, and offers plenty of space between neighbors. Inside the home, is a split floorplan style. The main living area offers a large living room, kitchen with pantry and center island, and a well sized dining area. The master suite boasts a large bedroom with a big walk-in closet, and a master bathroom featuring a double vanity, soaking tub, and large walk-in shower. On the opposite end of the home, you will find the 2 guest rooms and accompanying guest bath. This home is priced very aggressively for this area, so hop on this one fast! Schedule your show
Key facts
- Split floorplan
- Large living room
- 3.33 acre lot
Tags
Property features AI
Exterior
- Parking: Unpaved parking
- Utilities: Electricity available; Electric water heater
- Home design: Double-wide mobile home; Single-story (first-floor living areas)
- Construction: Vinyl siding; Shingle roof; Pillar/post/pier foundation
- Exterior features: Lot approximately 3.33 acres; Lot dimensions approximately 210 x 667; Zoned for county, mobile home, and single-family residential
Interior
- Kitchen: Kitchen on the first floor
- Bedrooms: Multiple first-floor bedrooms (two listed at 14 x 10; others include 14 x 13 and 14 x 8)
- Bathrooms: Two full bathrooms; Full bath on the first floor (11 x 5)
- Heating & cooling: Central heating (electric); Central air conditioning; Ceiling fans
- Interior features: Total of 9 rooms; Laundry on the first floor; Dining room on the first floor; Living room on the first floor; Primary bedroom and primary bathroom
- Laundry & utility: First-floor laundry
Neighborhood map
What this means for you Summary
Snapshot
- This is a 3-bed/2.0-bath manufactured listed at $200k.
Deal economics
- At list price, monthly cash flow is $-278 ($-3k/yr) — negative.
- To cash-flow at today's rent, offer at most $160k (20.2% below list).
- To meet the 1% rule (rent ≥ 1% of price), the offer needs to be $140k (30.1% below list).
- Recommended offer: $140k (30.1% below list) — sets the bar for 1% rule.
Location & tenants
- Location reads 61/100 on livability (#795 in FL) — a middle-class / working-renter tenant base. Strengths: cost of living A+, housing A+; Watch: crime C-, amenities F, commute F.
- Walton (rural): math 62% / reading 61% proficiency, ranked #10 of 73 in FL (top 14%) — acceptable for families but not a draw, mixed tenant base, ~2y average lease.
- Zoned schools: Freeport Elementary School (math 50% / reading 57%, grade C, #949 of 2,144 statewide, top 45%, 1,123 students, 55% FRL); Emerald Coast Middle School (math 70% / reading 65%, grade A-, #77 of 571 statewide, top 14%, 868 students, 24% FRL); South Walton High School (math 61% / reading 73%, grade B, #69 of 667 statewide, top 11%, 1,235 students, 20% FRL) — zoned schools average 33% FRL vs 48% district-wide (15 pts lower); this property's tenant base skews higher-income than the district average.
- Market conditions: 67 active listings in the ZIP; 2,883 units permitted in Walton County in 2024 (1,322 in 5+ unit buildings).
Forward outlook
- In year one you build about $18k of equity ($1k loan paydown + $17k appreciation (8.4% local appreciation)).
- Walton County population projected at +46% by 2050 — long-run rental-demand tailwind backs the buy-and-hold thesis.
- By year 3, paydown + projected appreciation supports a ~$46k cash-out refi (75% LTV) — recoverable capital for the next deal without selling this one.
Negotiation context
- It's been on market 52 days — a 3% lower offer ($194k) is reasonable based on typical stale-listing flexibility.
- 2 sale attempts; this cycle's ask is 18% above the opening price — seller raised mid-cycle; expect resistance to lowballs.
Risks & watch-outs
- Climate carrying-cost: severe wind risk, 99% chance of damaging wind over 30y; moderate wildfire risk; extreme-heat days projected 7→20/yr by 2055 (HVAC capex compounding) — expect insurance premiums to compound above CPI over the hold.
Questions for the listing agent
- What do current leases actually rent for vs. the listed asking? Can we see a recent rent roll and the last 12 months of T-12 income?
- It's been on market 52 days. Have you received any prior offers? Is the seller open to a 30% concession, seller financing, or rate buy-down credit?
- Is there a deadline driving the sale (1031 exchange, divorce, estate, relocation)? That informs how much negotiation room exists.
- Schools are D-rated, which usually means shorter tenancies and higher turnover. Who's the typical renter profile here, and what's been the actual vacancy rate?
- The area grade is low — what's the realistic commute time and amenity access for the typical tenant pool here? Any planned neighborhood developments (good or bad) we should know about?
- What's the average days-on-market for RENTAL listings here right now (not sales)? A rising rental-DOM trend means longer vacancies and softer asking-rent achievability than the comps imply.
- What's the recent tenant-quality profile in this submarket — average credit score on applications, eviction rate, late-payment / NSF rate, and stable-employment percentage? A property-management company in the area should have these aggregated.
- How much new for-sale + rental construction is in the pipeline within 1–3 miles? Heavy new supply typically softens prices + rents 12–24 months out; constrained supply supports both.
Investment metrics
- 1% rule
- 0.70% ✗
- Cap rate
- 4.62%
- Cash-on-cash
- -5.97%
- DSCR
- 0.73
- GRM
- 11.9
CMA / ARV
No comps found within radius.
Projected returns pro-forma
8.45% appreciation · 3.0% rent growth · sell at horizon
- IRR
- 16.6%
- Equity multiple
- 2.26×
- Total profit
- $70,456
- Equity at exit
- $158,057
- IRR
- 15.9%
- Equity multiple
- 4.90×
- Total profit
- $218,027
- Equity at exit
- $319,835
Cash invested: $55,972 (down + closing). Projections, not guarantees.
Landlord ↔ Tenant lean methodology
- Overall (STATE)
- 87 Strongly Landlord-Friendly
- State Florida
- 87 Strongly Landlord-Friendly · R+3
- County
- — inherits STATE
- City
- — inherits STATE
ZIP-level market 32455
- Home prices YoY
- 3.6%
- Active inventory
- 67
- Price-to-rent
- 11.9×
Monthly cashflow live
- Estimated rent
- $1,396 medium interval (Pro) →
- Mortgage (P&I)
- −$1,048
- Tax est. 1.5%
- −$250 /mo · $2,998/yr
- Insurance
- −$83
- HOA
- −$0
- Vacancy / Maint / Mgmt
- −$293
- Net cashflow
- $-278
Break-even live
Sensitivity live
| Price | -10% $-140 | -5% $-209 | +0% $-278 | +5% $-347 | +10% $-417 |
|---|---|---|---|---|---|
| Rent | -10% $-389 | -5% $-334 | +0% $-278 | +5% $-223 | +10% $-168 |
| Rate | -1.0pp $-178 | -0.5pp $-228 | base $-278 | +0.5pp $-330 | +1.0pp $-383 |
UW: 25.0% down · 7.5% · 30yr · 1.5% tax · 5.0% vac · 8.0% maint · 8.0% mgmt
Financing live
Cash to close
- Down payment
- $49,975
- Closing costs
- $5,997
- Reserves months
- —
- Total cash needed
- —
Loan-product check · same deal, 3 products live
Conventional
25% down · 7.5% · 30yr
- Down + closing
- —
- Monthly P&I
- —
- Monthly cashflow
- —
- DSCR
- —
- Eligible?
- —
Personal DTI + credit; lowest rate.
DSCR
20% down · 8.5% · 30yr
- Down + closing
- —
- Monthly P&I
- —
- Monthly cashflow
- —
- DSCR
- —
- Eligible?
- —
No personal income docs; deal must DSCR.
Hard money
10% down · 12.0% · 12mo
- Down + closing
- —
- Monthly P&I
- —
- Monthly cashflow
- —
- DSCR
- —
- Eligible?
- —
Short-term bridge; refi at stabilization.
Listing history 20 events
-
2026-06-21days on market $199,900 Active 52 DOM
-
2026-06-18days on market $199,900 Active 49 DOM
-
2026-06-17days on market $199,900 Active 48 DOM
-
2026-06-16days on market $199,900 Active 47 DOM
-
2026-06-15days on market $199,900 Active 46 DOM
-
2026-06-14days on market $199,900 Active 44 DOM
-
2026-06-13days on market $199,900 Active 43 DOM
-
2026-06-10days on market $199,900 Active 41 DOM
-
2026-06-09days on market $199,900 Active 40 DOM
-
2026-06-08days on market $199,900 Active 39 DOM
-
2026-06-07days on market $199,900 Active 38 DOM
-
2026-06-05days on market $199,900 Active 35 DOM
-
2026-06-03days on market $199,900 Active 34 DOM
-
2026-06-03days on market $199,900 Active 33 DOM
-
2026-06-01days on market $199,900 Active 32 DOM
-
2026-05-31days on market $199,900 Active 31 DOM
-
2026-05-30days on market $199,900 Active 30 DOM
-
2026-05-04status Active
-
2026-05-04price $199,900
-
2026-04-23$169,900 Active
ⓘ Source: listings_history table (triggers on properties + properties_extension) + one-shot
backfill from property_details.listing_events for pre-trigger history.
Climate risk First Street
- Flood 1/10 Low FEMA zone X (unshaded) · 0% chance over 30 yrs
- Wildfire 5/10 Major
- Heat 9/10 Extreme 7 d/yr ≥107°F today · 20 d/yr by 30 yrs out
- Wind 9/10 Extreme 99% chance of damaging wind over 30 yrs
- Air quality 1/10 Low 0 unhealthy d/yr today · 0 by 30 yrs out
Nearby sold comps map
Loading sold comps map…
Walkable amenities ~0.75 mi
Loading nearby amenities…
Taxation est. · year 1
- Rental income
- $16,756
- − Mortgage interest
- −$11,198
- − Property taxes
- −$2,998
- − Insurance
- −$1,000
- − Repairs & maintenance
- −$1,340
- − Management
- −$1,340
- − Depreciation
- −$5,815
- Taxable loss
- −$6,936
- Est. tax savings @ 24.0%
- +$1,665
- After-tax cash flow
- $-1,676/yr
For passive investors: Depreciation is non-cash, so a rental often shows a tax loss while cash-flowing — sheltering income. Rental losses are passive: they offset passive income freely, and up to $25,000/yr can offset ordinary (W-2) income if you actively participate and your MAGI is under $100k (phasing out to $0 by $150k); unused losses carry forward. On sale, claimed depreciation is recaptured at up to 25%, and gains may owe capital-gains tax (a 1031 exchange can defer both). Figures are a year-1 estimate at your 24.0% rate — not tax advice; consult a CPA.
Schools (NCES district)
- District
- Walton
- NCES district ID
- 1201980
- Math proficiency
- 62% ▼ -4.00%
- Reading proficiency
- 61% ▼ -2.00%
- Median HH income
- $46,794
- Composite
- 52.03/100
- National rank
- #1634
- State rank
- #10 of 73 in FL
Livability — Ponce De Leon
- Score
- 61/100
- State rank
- #795
- US rank
- #18236
Category grades
Schools grade is shown separately in the Schools card above.
Census & demographics
- Population (ZIP)
- 3,903
Population outlook (Walton County) Hauer SSP2
- Today (2025)
- 80,014 people
- By 2030
- 88,120 · +10.1%
- By 2040
- 103,537 · +29.4%
- By 2050
- 117,034 · +46.3%
- By 2075
- 143,901 · +79.8%
- By 2100
- 155,138 · +93.9%
Race, ethnicity, and origin ACS 2023
- Neighborhood character
- Predominantly White (91%)
- Race & ethnicity
- White 91% Two or more races 4% Native American 4% Hispanic / Latino 3%
- Common ancestry
- Serbian 2% Italian 1% Lithuanian 1%
- Foreign-born
- 1% · Canada
- Languages at home
- 97% English-only · Spanish 3%
Political lean MEDSL · Walton
- 2024 margin
- Solid R (+57.8) · D 20.7% · R 78.6%
- 2008→2024 swing
- -12.0pp toward R · 2008: -45.8pp · 2024: -57.8pp
- All cycles
- 2024: R+57.8 2020: R+51.7 2016: R+56.1 2012: R+52.0 2008: R+45.8
Not yet ingested
- Civics
- —
Market trends
- HPI YoY
- ▲ 8.45%
- Current HPI
- 244.4649
- Rent YoY
- —
- Metro
- —
- State GDP YoY
- ▲ 3.28%
- F500 in state
- 36
Industry mix (Fortune 500 HQ in FL)
| Industry | F500 HQs | Revenue |
|---|---|---|
| Industrial Technology | 2 | $29B |
|
||
| Insurance | 2 | $17B |
|
||
| Retail | 1 | $60B |
|
||
| Technology Distribution | 1 | $58B |
|
||
| Homebuilding | 1 | $35B |
|
||
| Technology Manufacturing | 1 | $35B |
|
||
Price history
+17.7% since first listed3 events — show timeline
- 2026-05-04 Relisted — CPARMLS
- 2026-05-04 Price Changed $199,900 CPARMLS
- 2026-04-23 Listed $169,900 CPARMLS
Cash-flow waterfall
monthlySold comps — $/sqft
last 12 mo · ≤1 miLoading sold comps…