 Fourplex
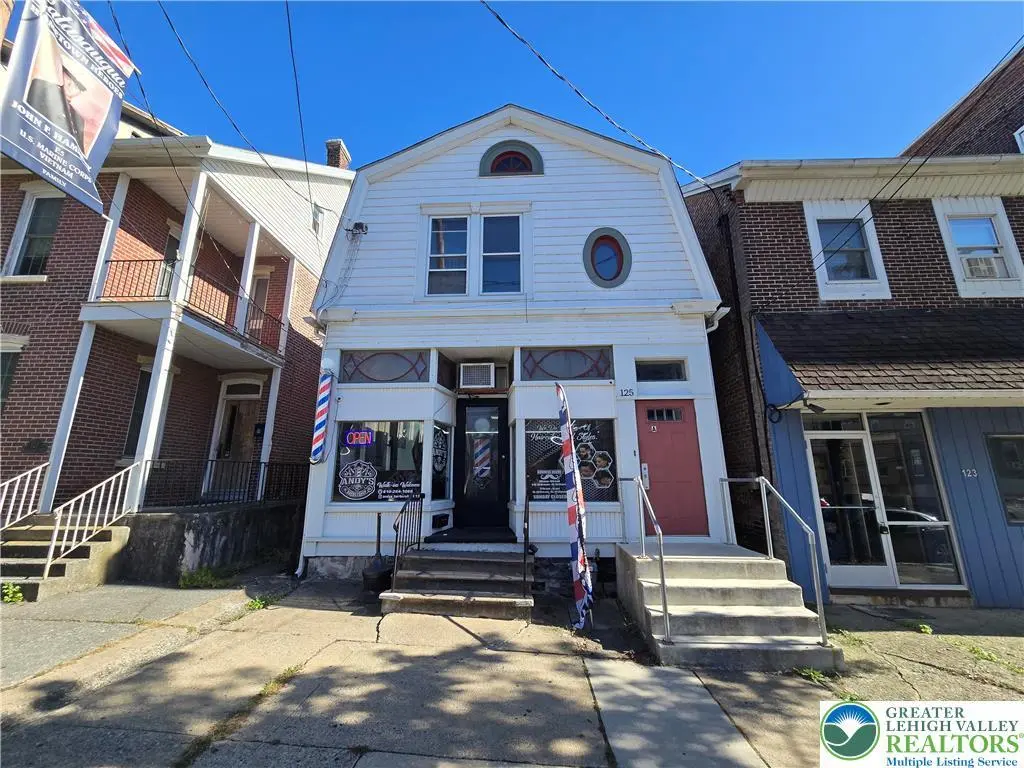
125 Bridge St · Catasauqua, PA
Flood risk No data
- FEMA flood zone
- —
- Chance of flooding over 30 yrs
- —
- Est. flood insurance / yr
- —
Fire risk No data
- Est. fire insurance / yr
- —
Heat risk No data
- Hot days now (above threshold)
- —
- Hot days in 30 yrs
- —
Wind risk No data
- Chance of severe wind over 30 yrs
- —
Air-quality risk No data
- Unhealthy air days now
- —
- Unhealthy air days in 30 yrs
- —
Risk factors via First Street. Map © Google.
Why this score? — see what drove the C+ grade
The composite is a weighted blend of 9 inputs, each scored 0–100. Each bar is that input's sub-score; the figure is the points it added to the 100-point composite (weight × sub-score).
- Cash flow +30.0/30.0
- 1% rule +10.0/10.0
- DSCR +10.0/10.0
- Livability +3.8/5.0
- Schools +2.8/10.0
- Rent growth +2.5/5.0
- Condition / age +2.5/5.0
- ARV discount +0.0/15.0
- Appreciation +0.0/10.0
$465,000
🖨 Deal sheet (PDF) 📄 Offer letter ✓ Due diligence
Multi-family units
County records classify this as Multi-Family (2-4 Unit). Listing-text estimate: 4 units. confirmed
Listing remarks MLS
Excellent investment opportunity in the heart of Catasauqua! This 4-unit property includes one commercial space with one commercial unit and three residential apartments offering steady rental income. The commercial unit and 1 residential unit are vacant offering a blank canvas for your imagination. A detached two level garage provides additional storage which is currently rented for $200 per month. Conveniently located near major routes, shopping, and local amenities, this mixed-use property combines strong income potential with long-term value. Perfect for investors or owner-occupants looking to generate passive income in a growing area.
Key facts
- Commercial space
- Steady rental income
- Detached garage
Tags
Neighborhood map
What this means for you Summary
Snapshot
- This is a 4 × 3-bed/3.5-bath units multifamily listed at $465k.
Deal economics
- At list price, monthly cash flow is $3k ($36k/yr) — positive. Per door: $740/mo.
- The deal already cash-flows at list — no discount required.
- Meets the 1% rule at list price ($8k rent vs $465k).
- Recommended offer: $437k (6.0% below list) — sets the bar for market timing.
- Cap rate 13.9% vs local median 4.9% in Catasauqua — top-decile yield for the area; either an underpriced asset or a hidden risk that comps aren't pricing in. Stress-test before assuming the spread holds.
Location & tenants
- Location reads 75/100 on livability (#443 in PA, #4,039 nationally) — a middle-class / working-renter tenant base. Strengths: cost of living A+, housing A+, health & safety A+; Watch: schools C-, amenities F, commute F.
- Catasauqua Area SD (suburban): math 23% / reading 41% proficiency, ranked #431 of 539 in PA (top 80%) — families likely to look elsewhere, expect single-tenant / working-renter base with shorter leases.
- Market conditions: 49 active listings in the ZIP; solid renter incomes; 765 units permitted in Lehigh County in 2024 (286 in 5+ unit buildings).
- At $7,815/mo this rent would consume 116% of the median local household income ($81k/yr) (locally 221% of renters already pay >50% of income on rent) — very limited rent-growth headroom before tenants either downsize or default.
Forward outlook
- Local home prices are declining (-3.0%/yr); year-one equity from $3k of loan paydown is wiped out by about $14k of value loss. Plan a longer hold.
- Lehigh County population projected at +21% by 2050 — long-run rental-demand tailwind backs the buy-and-hold thesis.
- At projected returns (-3.0% appreciation + 3.0% rent growth), your $130k cash investment doubles in ~5 years — after that, you're playing with house money.
Negotiation context
- It's been on market 82 days — a 6% lower offer ($437k) is reasonable based on typical stale-listing flexibility.
- 3 sale attempts since 8y ago with the ask held roughly flat each time — persistent listings suggest the price (not the market) is what's stuck; bring a comps-based counter.
- Current owner paid $195k; list at $465k implies a 138% gain — meaningful room to come down on a strong offer.
Risks & watch-outs
- Watch-outs: built in 1903 — expect roof / HVAC / electrical / plumbing capex.
Questions for the listing agent
- It's been on market 82 days. Have you received any prior offers? Is the seller open to a 6% concession, seller financing, or rate buy-down credit?
- Can we see the unit-by-unit rent roll, current vacancy, and any below-market leases? What's the average tenancy length?
- What capital expenditures (roof, boiler, parking lot, exteriors) have been made in the last 5 years, and what's planned in the next 2?
- Built in 1903 — when were the roof, HVAC, electrical panel, plumbing, and water heater last replaced?
- Why hasn't it sold? Are there any deal-killer items the seller is aware of (foundation, flood, title, zoning, code violations)?
- Is there a deadline driving the sale (1031 exchange, divorce, estate, relocation)? That informs how much negotiation room exists.
- What's the average days-on-market for RENTAL listings here right now (not sales)? A rising rental-DOM trend means longer vacancies and softer asking-rent achievability than the comps imply.
- What's the recent tenant-quality profile in this submarket — average credit score on applications, eviction rate, late-payment / NSF rate, and stable-employment percentage? A property-management company in the area should have these aggregated.
- How much new apartment / multifamily construction is in the pipeline within 1–3 miles? Heavy new supply (>2% of stock underway) typically softens rents 12–24 months out; light construction supports rent growth.
Investment metrics
- 1% rule
- 1.68% ✓
- Cap rate
- 13.93%
- Cash-on-cash
- 27.28%
- DSCR
- 2.21
- GRM
- 5.0
CMA / ARV
- ARV (median comp)
- $381,460
- List price
- $465,000
- Delta
- 21.90%
- Verdict
- OVERPRICED
- Comps
- 20 within 1.0 mi
Projected returns pro-forma
-3.0% appreciation · 3.0% rent growth · sell at horizon
- IRR
- 21.3%
- Equity multiple
- 1.87×
- Total profit
- $113,314
- Equity at exit
- $69,333
- IRR
- 29.4%
- Equity multiple
- 3.63×
- Total profit
- $341,933
- Equity at exit
- $40,205
Cash invested: $130,200 (down + closing). Projections, not guarantees.
Landlord ↔ Tenant lean methodology
- Overall (STATE)
- 62 Landlord-Friendly
- State Pennsylvania
- 62 Landlord-Friendly · EVEN
- County
- — inherits STATE
- City
- — inherits STATE
ZIP-level market 18032
- Home prices YoY
- -34.7%
- Active inventory
- 49
- Price-to-rent
- 19.8×
Monthly cashflow live
- Estimated rent
- $7,815 high interval (Pro) →
- Mortgage (P&I)
- −$2,439
- Tax est. 1.5%
- −$581 /mo · $6,975/yr
- Insurance
- −$194
- HOA
- −$0
- Vacancy / Maint / Mgmt
- −$1,641
- Net cashflow
- $2,960
Break-even live
Sensitivity live
| Price | -10% $3,282 | -5% $3,121 | +0% $2,960 | +5% $2,800 | +10% $2,639 |
|---|---|---|---|---|---|
| Rent | -10% $2,343 | -5% $2,652 | +0% $2,960 | +5% $3,269 | +10% $3,578 |
| Rate | -1.0pp $3,195 | -0.5pp $3,079 | base $2,960 | +0.5pp $2,840 | +1.0pp $2,717 |
4-unit breakdown (identical units grouped — click to expand)
| Units | Beds | Baths | Est. rent |
|---|---|---|---|
| 4× units | 3 | 3.5 | $7,816 |
| #1 | 3 | 3.5 | $1,954 |
| #2 | 3 | 3.5 | $1,954 |
| #3 | 3 | 3.5 | $1,954 |
| #4 | 3 | 3.5 | $1,954 |
| Total (4 units) | $7,815 | ||
UW: 25.0% down · 7.5% · 30yr · 1.5% tax · 5.0% vac · 8.0% maint · 8.0% mgmt
Financing live
Cash to close
- Down payment
- $116,250
- Closing costs
- $13,950
- Reserves months
- —
- Total cash needed
- —
Loan-product check · same deal, 3 products live
Conventional
25% down · 7.5% · 30yr
- Down + closing
- —
- Monthly P&I
- —
- Monthly cashflow
- —
- DSCR
- —
- Eligible?
- —
Personal DTI + credit; lowest rate.
DSCR
20% down · 8.5% · 30yr
- Down + closing
- —
- Monthly P&I
- —
- Monthly cashflow
- —
- DSCR
- —
- Eligible?
- —
No personal income docs; deal must DSCR.
Hard money
10% down · 12.0% · 12mo
- Down + closing
- —
- Monthly P&I
- —
- Monthly cashflow
- —
- DSCR
- —
- Eligible?
- —
Short-term bridge; refi at stabilization.
Listing history 11 events
-
2026-04-17price $465,000 647-char remark
Show marketing remark (647 chars)
Excellent investment opportunity in the heart of Catasauqua! This 4-unit property includes one commercial space with one commercial unit and three residential apartments offering steady rental income. The commercial unit and 1 residential unit are vacant offering a blank canvas for your imagination. A detached two level garage provides additional storage which is currently rented for $200 per month. Conveniently located near major routes, shopping, and local amenities, this mixed-use property combines strong income potential with long-term value. Perfect for investors or owner-occupants looking to generate passive income in a growing area.
-
2026-04-08price $470,000 647-char remark
Show marketing remark (647 chars)
Excellent investment opportunity in the heart of Catasauqua! This 4-unit property includes one commercial space with one commercial unit and three residential apartments offering steady rental income. The commercial unit and 1 residential unit are vacant offering a blank canvas for your imagination. A detached two level garage provides additional storage which is currently rented for $200 per month. Conveniently located near major routes, shopping, and local amenities, this mixed-use property combines strong income potential with long-term value. Perfect for investors or owner-occupants looking to generate passive income in a growing area.
-
2026-03-06$475,000 Active 647-char remark
Show marketing remark (647 chars)
Excellent investment opportunity in the heart of Catasauqua! This 4-unit property includes one commercial space with one commercial unit and three residential apartments offering steady rental income. The commercial unit and 1 residential unit are vacant offering a blank canvas for your imagination. A detached two level garage provides additional storage which is currently rented for $200 per month. Conveniently located near major routes, shopping, and local amenities, this mixed-use property combines strong income potential with long-term value. Perfect for investors or owner-occupants looking to generate passive income in a growing area.
-
2026-01-15historical
-
2025-12-30price $485,000
-
2025-11-09price $490,000
-
2025-10-28price $495,000
-
2025-10-15$500,000 Active
-
2018-06-18soldstatus $195,000 Sold
-
2018-05-19status Pending
-
2018-04-15$230,000 Active
ⓘ Source: listings_history table (triggers on properties + properties_extension) + one-shot
backfill from property_details.listing_events for pre-trigger history.
Nearby sold comps map
Loading sold comps map…
Walkable amenities ~0.75 mi
Loading nearby amenities…
Taxation est. · year 1
- Rental income
- $93,780
- − Mortgage interest
- −$26,047
- − Property taxes
- −$6,975
- − Insurance
- −$2,325
- − Repairs & maintenance
- −$7,502
- − Management
- −$7,502
- − Depreciation
- −$13,527
- Taxable income
- $29,901
- Est. tax owed @ 24.0%
- −$7,176
- After-tax cash flow
- $28,348/yr
For passive investors: Depreciation is non-cash, so a rental often shows a tax loss while cash-flowing — sheltering income. Rental losses are passive: they offset passive income freely, and up to $25,000/yr can offset ordinary (W-2) income if you actively participate and your MAGI is under $100k (phasing out to $0 by $150k); unused losses carry forward. On sale, claimed depreciation is recaptured at up to 25%, and gains may owe capital-gains tax (a 1031 exchange can defer both). Figures are a year-1 estimate at your 24.0% rate — not tax advice; consult a CPA.
Schools (NCES district)
- District
- Catasauqua Area SD
- NCES district ID
- 4205160
- Math proficiency
- 23% ▼ -15.00%
- Reading proficiency
- 41% ▼ -21.00%
- Median HH income
- $53,073
- Composite
- 28.09/100
- National rank
- #6832
- State rank
- #431 of 539 in PA
Livability — Catasauqua
- Score
- 75/100
- State rank
- #443
- US rank
- #4039
Category grades
Schools grade is shown separately in the Schools card above.
Census & demographics
- Census place
- Catasauqua, PA
- County
- Lehigh County · 333,019 people
- City population
- 9,555
- Metro
- Allentown-Bethlehem-Easton, PA-NJ
- Population (ZIP)
- 9,555
- Household income
- $81,098
- Rent vs Own
- Severe rent burden
- 221.0
Population outlook (Lehigh County) Hauer SSP2
- Today (2025)
- 392,957 people
- By 2030
- 408,319 · +3.9%
- By 2040
- 440,007 · +12.0%
- By 2050
- 475,940 · +21.1%
- By 2075
- 590,448 · +50.3%
- By 2100
- 690,314 · +75.7%
Race, ethnicity, and origin ACS 2023
- Neighborhood character
- Predominantly White (79%)
- Race & ethnicity
- White 79% Hispanic / Latino 15% Two or more races 12% Black 3%
- Hispanic origin (detail)
- Puerto Rican 10% Dominican 1%
- Common ancestry
- Danish 4% Polish 3% Romanian 2%
- Foreign-born
- 4% · Canada
- Languages at home
- 91% English-only · Spanish 8%
Political lean MEDSL · Lehigh
- 2024 margin
- Toss-up / Even · D 50.7% · R 48.0% · Other 1.2%
- 2008→2024 swing
- -12.9pp toward R · 2008: 15.6pp · 2024: 2.7pp
- All cycles
- 2024: D+2.7 2020: D+7.6 2016: D+4.4 2012: D+7.5 2008: D+15.6
Not yet ingested
- Civics
- —
Market trends
- HPI YoY
- ▼ -159.00%
- Current HPI
- 299.4376
- Rent YoY
- —
- Metro
- Allentown-Bethlehem-Easton, PA-NJ
- State GDP YoY
- ▲ 1.68%
- F500 in state
- 34
Industry mix (Fortune 500 HQ in PA)
| Industry | F500 HQs | Revenue |
|---|---|---|
| Healthcare | 2 | $309B |
|
||
| Insurance | 2 | $27B |
|
||
| Telecommunications / Media | 1 | $124B |
|
||
| Industrial Distribution | 1 | $22B |
|
||
| Financial Services | 1 | $20B |
|
||
| Chemicals / Materials | 1 | $18B |
|
||
Price history
+102.2% since first listed11 events — show timeline
- 2026-04-17 Price Changed $465,000 GLVRMLS
- 2026-04-08 Price Changed $470,000 GLVRMLS
- 2026-03-06 Listed $475,000 GLVRMLS
- 2026-01-15 Listing Removed — GLVRMLS
- 2025-12-30 Price Changed $485,000 GLVRMLS
- 2025-11-09 Price Changed $490,000 GLVRMLS
- 2025-10-28 Price Changed $495,000 GLVRMLS
- 2025-10-15 Listed $500,000 GLVRMLS
- 2018-06-18 Sold (MLS) $195,000 GLVRMLS
- 2018-05-19 Pending — GLVRMLS
- 2018-04-15 Listed $230,000 GLVRMLS
Cash-flow waterfall
monthlySold comps — $/sqft
last 12 mo · ≤1 miLoading sold comps…