3 Meadow Cir · Bradenton, FL
Flood risk 3/10 · Minor
- FEMA flood zone
- X (unshaded)
- Chance of flooding over 30 yrs
- 0.13%
- Est. flood insurance / yr
- $507 – $1,088
Fire risk 1/10 · Minimal
- Est. fire insurance / yr
- $947 – $1,759
Heat risk 10/10 · Severe
- Hot days now (above 107°F)
- 7 days/yr
- Hot days in 30 yrs
- 30 days/yr
Wind risk 10/10 · Severe
- Chance of severe wind over 30 yrs
- 99.0%
Air-quality risk 3/10 · Minor
- Unhealthy air days now
- 3 days/yr
- Unhealthy air days in 30 yrs
- 3 days/yr
Risk factors via First Street. Map © Google.
Why this score? — see what drove the D grade
The composite is a weighted blend of 9 inputs, each scored 0–100. Each bar is that input's sub-score; the figure is the points it added to the 100-point composite (weight × sub-score).
- Cash flow +17.8/30.0
- DSCR +5.6/10.0
- 1% rule +5.3/10.0
- Schools +4.4/10.0
- Livability +4.0/5.0
- Rent growth +2.5/5.0
- Condition / age +2.5/5.0
- ARV discount +1.4/15.0
- Appreciation +0.0/10.0
$199,000
🖨 Deal sheet (PDF) 📄 Offer letter ✓ Due diligence
Listing remarks
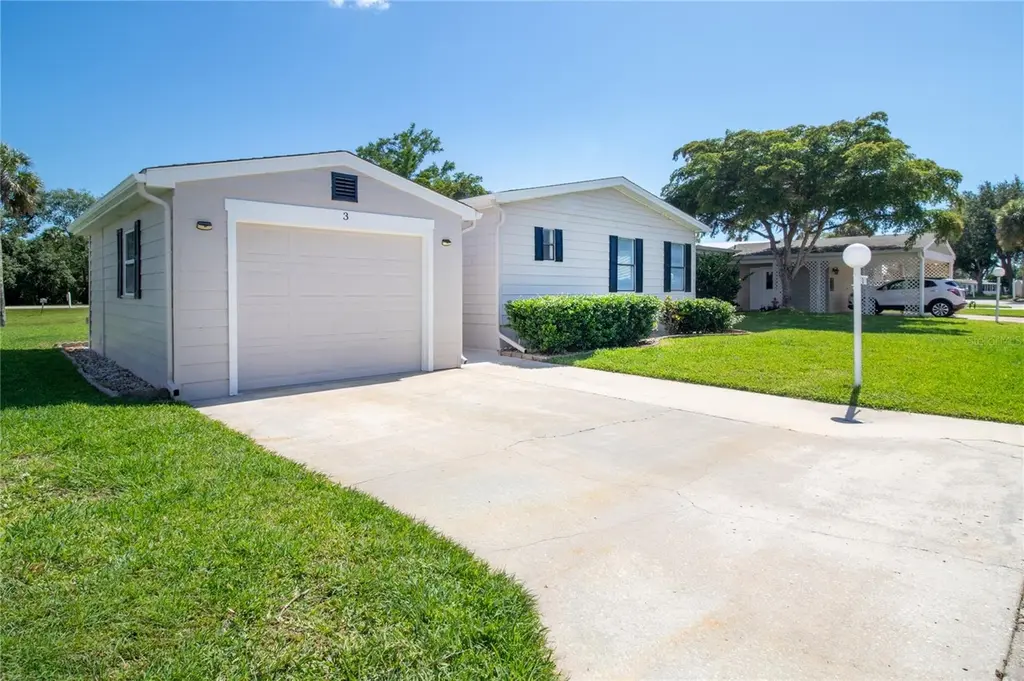
Land Owned! This beautiful, remodeled home is ready for you. The homes exterior has been painted and a new porch & deck have been added. The deck overlooks water and is a great place for relaxing and enjoying your morning coffee. A spacious garage is set back from the street, so there is room for additional vehicles. Inside the home, an open concept with a beautiful kitchen, stone counter tops, new soft-close cabinets, stainless appliances and a new dishwasher. All new laminate flooring throughout, new ceiling fans and lighting in all rooms. Both bathrooms have custom showers, new fixtures and cabinets. A generous size walk-in closet in the master bedroom provides lots of space and e
Key facts
- Open concept
- New porch
- New deck
Tags
Property features AI
Finance
- Other: Senior community; Association fee includes guard (24-hour), common area taxes, grounds maintenance, pool, private road, security, trash
- Financial info: Lease restrictions apply
- HOA & community: Has HOA (required approval); Monthly HOA about $34.67; quarterly association fee $104; Association amenities: clubhouse, pool, spa/hot tub, tennis courts, pickleball courts, shuffleboard, recreation facilities, gated, security; Community features: clubhouse, pool, tennis courts, irrigation with reclaimed water, golf carts allowed; Pets allowed with restrictions (cats and dogs OK, breed restrictions, number limit; max pet weight ~25 lbs)
Exterior
- Parking: 1-car garage (24 x 12)
- Security: Gated community (community security listed)
- Utilities: Public water; Public sewer; Electricity connected; Water connected; Sewer connected; Cable available; Underground utilities
- Home design: Residential manufactured home; Double wide; One story; North-facing
- Construction: Vinyl siding; Shingle roof; Crawlspace foundation; Built as manufactured home
- Exterior features: Rain gutters; Concrete road access
Interior
- Kitchen: Dishwasher; Range; Range hood; Refrigerator; Electric water heater
- Bedrooms: 2 bedrooms
- Flooring: Linoleum
- Bathrooms: 2 full bathrooms
- Heating & cooling: Electric heating; Central air; Humidity control; Mini-split unit(s)
- Interior features: Ceiling fans; Open floor plan
- Laundry & utility: Washer hookup; Electric dryer hookup; Laundry in garage
Neighborhood map
What this means for you Summary
Snapshot
- This is a 2-bed/1.0-bath manufactured listed at $199k.
Deal economics
- At list price, monthly cash flow is $163 ($2k/yr) — positive.
- The deal already cash-flows at list — no discount required.
- Meets the 1% rule at list price ($2k rent vs $199k).
- Cap rate 7.3% vs local median 3.6% in Bradenton — top-decile yield for the area; either an underpriced asset or a hidden risk that comps aren't pricing in. Stress-test before assuming the spread holds.
Location & tenants
- Location reads 81/100 on livability (#101 in FL, #1,528 nationally) — a professional / high-income tenant draw. Strengths: commute A+, cost of living A+, housing A+; Watch: employment D+, crime D, amenities F.
- Manatee (suburban): math 54% / reading 50% proficiency, ranked #26 of 73 in FL (top 36%) — acceptable for families but not a draw, mixed tenant base, ~2y average lease.
- Zoned schools: Blackburn Elementary School (math 62% / reading 42%, grade C-, #990 of 2,144 statewide, top 48%, 551 students, 78% FRL); Palmetto High School (math 22% / reading 36%, grade F, #456 of 667 statewide, top 68%, 2,100 students, 61% FRL) — zoned schools average 70% FRL vs 51% district-wide (19 pts higher); higher-poverty schools than district average — tighter screening recommended.
- Market conditions: 185 active listings in the ZIP; 12 comparable units currently listed for rent nearby; rentals leasing fast (median 5d on market — plan ~1-2 weeks tenant-placement turnaround); 7,472 units permitted in Manatee County in 2024 (1,782 in 5+ unit buildings).
- This rent runs 38% of the median local income ($64k/yr) — at the standard rent-burdened threshold; future hikes will face affordability resistance.
Forward outlook
- Local home prices are declining (-3.0%/yr); year-one equity from $1k of loan paydown is wiped out by about $6k of value loss. Plan a longer hold.
- Manatee County population projected at +43% by 2050 — long-run rental-demand tailwind backs the buy-and-hold thesis.
Negotiation context
- Only 6 days on market — expect competitive offers; lowballing is unlikely to land.
- 12 sale attempts since 18y ago with the ask held roughly flat each time — persistent listings suggest the price (not the market) is what's stuck; bring a comps-based counter.
- Current owner paid $75k; list at $199k implies a 165% gain — meaningful room to come down on a strong offer.
Risks & watch-outs
- Climate carrying-cost: severe wind risk, 99% chance of damaging wind over 30y; extreme-heat days projected 7→30/yr by 2055 (HVAC capex compounding) — expect insurance premiums to compound above CPI over the hold.
Questions for the listing agent
- What does the HOA fee cover, when was the last increase, and are there any pending special assessments or reserve-fund shortfalls?
- Is there a deadline driving the sale (1031 exchange, divorce, estate, relocation)? That informs how much negotiation room exists.
- Crime grade is D in this area — have there been break-ins, vandalism, or insurance claims at this property in the last 3 years? What carrier currently insures it and at what premium?
- The area grade is low — what's the realistic commute time and amenity access for the typical tenant pool here? Any planned neighborhood developments (good or bad) we should know about?
- What's the average days-on-market for RENTAL listings here right now (not sales)? A rising rental-DOM trend means longer vacancies and softer asking-rent achievability than the comps imply.
- What's the recent tenant-quality profile in this submarket — average credit score on applications, eviction rate, late-payment / NSF rate, and stable-employment percentage? A property-management company in the area should have these aggregated.
- How much new for-sale + rental construction is in the pipeline within 1–3 miles? Heavy new supply typically softens prices + rents 12–24 months out; constrained supply supports both.
Investment metrics
- 1% rule
- 1.03% ✓
- Cap rate
- 7.28%
- Cash-on-cash
- 3.51%
- DSCR
- 1.16
- GRM
- 8.1
CMA / ARV
- ARV (on-the-fly)
- $175,392
- Comps found
- 10
Show comp detail 10 sales within ~0.75 mi
| Address | Dist | Beds/Ba | Sqft | Sold | Price | $/sf | Match |
|---|---|---|---|---|---|---|---|
| 121 Mockingbird Ln | 0.17mi | 2/2.0 | 1,012 (+0%) | 3mo | $120,000 | $119 | 85 |
| 64 Spoonbill Ln | 0.08mi | 2/2.0 | 1,000 (-1%) | 9mo | $212,100 | $212 | 84 |
| 45 Wood Owl Ave | 0.08mi | 2/2.0 | 1,000 (-1%) | 13mo | $175,000 | $175 | 80 |
| 112 Eagle Cir | 0.17mi | 2/2.0 | 1,027 (+2%) | 6mo | $179,000 | $174 | 80 |
| 24 Meadowlark Cir | 0.19mi | 2/2.0 | 1,008 (0%) | 10mo | $155,000 | $154 | 79 |
| 36 Wood Owl Ave | 0.16mi | 2/2.0 | 900 (-11%) | 3mo | $209,900 | $233 | 68 |
| 7 Meadow Cir | 0.05mi | 2/2.0 | 864 (-14%) | 8mo | $159,000 | $184 | 63 |
| 141 Osprey Cir | 0.30mi | 2/2.0 | 1,100 (+9%) | 12mo | $133,000 | $121 | 57 |
| 83 Spoonbill Ln | 0.11mi | 2/2.0 | 1,152 (+14%) | 19mo | $165,000 | $143 | 51 |
| 3104 Bessie Ln | 0.72mi | 2/1.5 | 950 (-6%) | 10mo | $39,000 | $41 | 47 |
Match score weights: distance 35% · size 25% · config 20% · recency 20%. Top-matched comps best support the ARV.
Projected returns pro-forma
-3.0% appreciation · 3.0% rent growth · sell at horizon
- IRR
- -10.7%
- Equity multiple
- 0.61×
- Total profit
- $-21,796
- Equity at exit
- $29,672
- IRR
- -1.4%
- Equity multiple
- 0.90×
- Total profit
- $-5,307
- Equity at exit
- $17,206
Cash invested: $55,720 (down + closing). Projections, not guarantees.
Landlord ↔ Tenant lean methodology
- Overall (STATE)
- 87 Strongly Landlord-Friendly
- State Florida
- 87 Strongly Landlord-Friendly · R+3
- County
- — inherits STATE
- City
- — inherits STATE
ZIP-level market 34222
- Home prices YoY
- -26.9%
- Active inventory
- 185
- Price-to-rent
- 8.1×
Monthly cashflow live
- Estimated rent
- $2,044 high interval (Pro) →
- Mortgage (P&I)
- −$1,044
- Tax from tax record
- −$117 /mo · $1,408/yr
- Insurance
- −$83
- HOA
- −$208
- Vacancy / Maint / Mgmt
- −$429
- Net cashflow
- $163
Break-even live
Sensitivity live
| Price | -10% $276 | -5% $219 | +0% $163 | +5% $107 | +10% $50 |
|---|---|---|---|---|---|
| Rent | -10% $1 | -5% $82 | +0% $163 | +5% $244 | +10% $324 |
| Rate | -1.0pp $263 | -0.5pp $213 | base $163 | +0.5pp $111 | +1.0pp $59 |
UW: 25.0% down · 7.5% · 30yr · 1.5% tax · 5.0% vac · 8.0% maint · 8.0% mgmt
Financing live
Cash to close
- Down payment
- $49,750
- Closing costs
- $5,970
- Reserves months
- —
- Total cash needed
- —
Loan-product check · same deal, 3 products live
Conventional
25% down · 7.5% · 30yr
- Down + closing
- —
- Monthly P&I
- —
- Monthly cashflow
- —
- DSCR
- —
- Eligible?
- —
Personal DTI + credit; lowest rate.
DSCR
20% down · 8.5% · 30yr
- Down + closing
- —
- Monthly P&I
- —
- Monthly cashflow
- —
- DSCR
- —
- Eligible?
- —
No personal income docs; deal must DSCR.
Hard money
10% down · 12.0% · 12mo
- Down + closing
- —
- Monthly P&I
- —
- Monthly cashflow
- —
- DSCR
- —
- Eligible?
- —
Short-term bridge; refi at stabilization.
Rent comps 12 comps
| Address | Beds | Baths | Sqft | Rent | $/sqft | DOM | Units | Dist |
|---|---|---|---|---|---|---|---|---|
| 2710 59th Dr E Ellenton, FL | 1.0–3.0 | 1.0–2.0 | 1149 | $2,234 | $1.94 | 4d | 37 | 0.57mi |
| 5942 Factory Shops Blvd Ellenton, FL | 1.0–3.0 | 1.0–2.0 | 953 | $2,362 | $2.48 | 3d | 67 | 0.58mi |
| 482 Outer Dr Unit NA Ellenton, FL | 3.0 | 2.0 | 1400 | $1,600 | $1.14 | 5d | 1 | 0.68mi |
| 2711 80th Ave E Ellenton, FL | 3.0 | 2.0 | 1000 | $1,836 | $1.84 | 5d | 1 | 0.75mi |
| 3931 Day Bridge Pl Ellenton, FL | 3.0 | 2.0 | 1250 | $2,295 | $1.84 | 5d | 1 | 0.89mi |
| 3808 Sunset Dr Ellenton, FL | 3.0 | 2.0 | 1441 | $1,699 | $1.18 | 23d | 1 | 0.96mi |
| 7711 Desoto Dr Ellenton, FL | 2.0 | 2.5 | 1356 | $1,599 | $1.18 | 16d | 1 | 1.01mi |
| 8314 Nancy Ln Ellenton, FL | 2.0 | 2.0 | 1404 | $1,895 | $1.35 | 25d | 1 | 1.14mi |
| 4180 Yardly Dr Palmetto, FL | 1.0–3.0 | 1.0–2.0 | 1021 | $2,498 | $2.45 | 5d | 15 | 1.25mi |
| 3908 Lemonwood Dr N Ellenton, FL | 2.0 | 2.0 | 1400 | $1,750 | $1.25 | 25d | 1 | 1.29mi |
| 5021 US Highway 301 N Ellenton, FL | 3.0 | 2.5 | 861 | $3,900 | $4.53 | 5d | 1 | 1.31mi |
| 4212 Long Lake Way Ellenton, FL | 2.0 | 2.0 | 1000 | $1,900 | $1.90 | 25d | 1 | 1.32mi |
HOA detail
- Monthly dues
- $208 · $2,496/yr
- Likely covers
- water
Listing history 32 events
-
2026-05-22status Pending
-
2026-05-16$199,000 Active
-
2026-04-09historical $1,800
-
2026-03-25$1,800
-
2026-03-14historical $1,800
-
2026-03-02soldstatus $75,000
-
2026-01-01$1,800
-
2025-12-21historical $1,800
-
2025-12-18$1,800
-
2025-11-29historical $1,800
-
2025-11-12$1,800
-
2024-04-08historical
-
2024-03-16price $179,900
-
2024-01-15$209,900 Active
-
2024-01-12historical $2,200
-
2023-12-12$2,200
-
2021-01-13historical
-
2020-10-05$129,900 Active
-
2020-09-16historical
-
2020-09-16soldstatus $1,600 Closed
-
2020-08-02$120,000 Active
-
2014-08-28soldstatus $62,700
-
2014-08-27soldstatus $62,700 Sold
-
2014-08-22status Pending
-
2014-07-11status Active
-
2014-06-16status Pending
-
2014-06-14status Active
-
2014-04-04historical
-
2008-11-07$69,900 Active
-
2000-09-06soldstatus $46,000
-
1986-04-01soldstatus $58,700
-
1984-04-01soldstatus $601,300
ⓘ Source: listings_history table (triggers on properties + properties_extension) + one-shot
backfill from property_details.listing_events for pre-trigger history.
Tax reassessment forecast FL · Resets to sale price
- Current annual tax
- $1,408 · $117/mo
- Projected year-2 tax
- $1,652 · $138/mo
- Expected delta
- +$244/yr (+$20/mo · 17.3%)
ⓘ Screening estimate from a state-policy table — verify with the county assessor before closing.
Climate risk First Street
- Flood 3/10 Moderate FEMA zone X (unshaded) · 13% chance over 30 yrs
- Wildfire 1/10 Low
- Heat 10/10 Extreme 7 d/yr ≥107°F today · 30 d/yr by 30 yrs out
- Wind 10/10 Extreme 99% chance of damaging wind over 30 yrs
- Air quality 3/10 Moderate 3 unhealthy d/yr today · 3 by 30 yrs out
Nearby sold comps map
Loading sold comps map…
Walkable amenities ~0.75 mi
Loading nearby amenities…
Taxation est. · year 1
- Rental income
- $24,527
- − Mortgage interest
- −$11,147
- − Property taxes
- −$1,408
- − Insurance
- −$995
- − Repairs & maintenance
- −$1,962
- − Management
- −$1,962
- − HOA
- −$2,496
- − Depreciation
- −$5,789
- Taxable loss
- −$1,233
- Est. tax savings @ 24.0%
- +$296
- After-tax cash flow
- $2,250/yr
For passive investors: Depreciation is non-cash, so a rental often shows a tax loss while cash-flowing — sheltering income. Rental losses are passive: they offset passive income freely, and up to $25,000/yr can offset ordinary (W-2) income if you actively participate and your MAGI is under $100k (phasing out to $0 by $150k); unused losses carry forward. On sale, claimed depreciation is recaptured at up to 25%, and gains may owe capital-gains tax (a 1031 exchange can defer both). Figures are a year-1 estimate at your 24.0% rate — not tax advice; consult a CPA.
Schools (NCES district)
- District
- Manatee
- NCES district ID
- 1201230
- Math proficiency
- 54% ▼ -6.00%
- Reading proficiency
- 50% ▼ -2.00%
- Median HH income
- $49,607
- Composite
- 44.43/100
- National rank
- #2806
- State rank
- #26 of 73 in FL
Livability — Bradenton
- Score
- 81/100
- State rank
- #101
- US rank
- #1528
Category grades
Schools grade is shown separately in the Schools card above.
Census & demographics
- County
- Manatee County · 416,364 people
- City population
- 227,091
- Metro
- North Port-Sarasota-Bradenton, FL
- Population (ZIP)
- 14,819
- Household income
- $64,355
- Rent vs Own
- Severe rent burden
- 313.0
Population outlook (Manatee County) Hauer SSP2
- Today (2025)
- 447,342 people
- By 2030
- 488,911 · +9.3%
- By 2040
- 567,934 · +27.0%
- By 2050
- 637,995 · +42.6%
- By 2075
- 781,970 · +74.8%
- By 2100
- 848,272 · +89.6%
Race, ethnicity, and origin ACS 2023
- Neighborhood character
- Predominantly White (70%)
- Race & ethnicity
- White 70% Hispanic / Latino 17% Two or more races 13% Black 7% Native American 2% Asian 1%
- Hispanic origin (detail)
- Mexican 8% Puerto Rican 2%
- Common ancestry
- Romanian 3% Slovak 2% Lithuanian 2%
- Foreign-born
- 8% · Canada, Jamaica, Vietnam
- Languages at home
- 88% English-only · Spanish 10% Other Indo-European 1% Vietnamese 1%
Political lean MEDSL · Manatee
- 2024 margin
- Strong R (+23.5) · D 37.9% · R 61.4%
- 2008→2024 swing
- -16.5pp toward R · 2008: -7.0pp · 2024: -23.5pp
- All cycles
- 2024: R+23.5 2020: R+16.1 2016: R+17.1 2012: R+12.5 2008: R+7.0
Not yet ingested
- Civics
- —
Market trends
- HPI YoY
- ▼ -107.75%
- Current HPI
- 293.2597
- Rent YoY
- —
- Metro
- North Port-Sarasota-Bradenton, FL
- State GDP YoY
- ▲ 3.28%
- F500 in state
- 36
Industry mix (Fortune 500 HQ in FL)
| Industry | F500 HQs | Revenue |
|---|---|---|
| Industrial Technology | 2 | $29B |
|
||
| Insurance | 2 | $17B |
|
||
| Retail | 1 | $60B |
|
||
| Technology Distribution | 1 | $58B |
|
||
| Homebuilding | 1 | $35B |
|
||
| Technology Manufacturing | 1 | $35B |
|
||
Price history
-66.9% since first listed32 events — show timeline
- 2026-05-22 Pending — Stellar MLS as Distributed by MLS Grid
- 2026-05-16 Listed $199,000 Stellar MLS as Distributed by MLS Grid
- 2026-04-09 Rental Removed $1,800 STELLARMLS
- 2026-03-25 Listed for Rent $1,800 STELLARMLS
- 2026-03-14 Rental Removed $1,800 STELLARMLS
- 2026-03-02 Sold (Public Records) $75,000 Public Records
- 2026-01-01 Listed for Rent $1,800 STELLARMLS
- 2025-12-21 Rental Removed $1,800 STELLARMLS
- 2025-12-18 Listed for Rent $1,800 STELLARMLS
- 2025-11-29 Rental Removed $1,800 STELLARMLS
- 2025-11-12 Listed for Rent $1,800 STELLARMLS
- 2024-04-08 Listing Removed — Stellar MLS as Distributed by MLS Grid
- 2024-03-16 Price Changed $179,900 Stellar MLS as Distributed by MLS Grid
- 2024-01-15 Listed $209,900 Stellar MLS as Distributed by MLS Grid
- 2024-01-12 Rental Removed $2,200 STELLARMLS
- 2023-12-12 Listed for Rent $2,200 STELLARMLS
- 2021-01-13 Listing Removed — Stellar MLS as Distributed by MLS Grid
- 2020-10-05 Listed $129,900 Stellar MLS as Distributed by MLS Grid
- 2020-09-16 Listing Removed — Stellar MLS as Distributed by MLS Grid
- 2020-09-16 Sold (MLS) $1,600 Stellar MLS as Distributed by MLS Grid
- 2020-08-02 Listed $120,000 Stellar MLS as Distributed by MLS Grid
- 2014-08-28 Sold (Public Records) $62,700 Public Records
- 2014-08-27 Sold (MLS) $62,700 Stellar MLS as Distributed by MLS Grid
- 2014-08-22 Pending — Stellar MLS as Distributed by MLS Grid
- 2014-07-11 Relisted — Stellar MLS as Distributed by MLS Grid
- 2014-06-16 Pending — Stellar MLS as Distributed by MLS Grid
- 2014-06-14 Relisted — Stellar MLS as Distributed by MLS Grid
- 2014-04-04 Listing Removed — Stellar MLS as Distributed by MLS Grid
- 2008-11-07 Listed $69,900 Stellar MLS as Distributed by MLS Grid
- 2000-09-06 Sold (Public Records) $46,000 Public Records
- 1986-04-01 Sold (Public Records) $58,700 Public Records
- 1984-04-01 Sold (Public Records) $601,300 Public Records
Property tax history
+2.3%/yrLatest (2025): $1,408 · -0.5% YoY. Source: county tax records.
Cash-flow waterfall
monthlySold comps — $/sqft
last 12 mo · ≤1 miLoading sold comps…