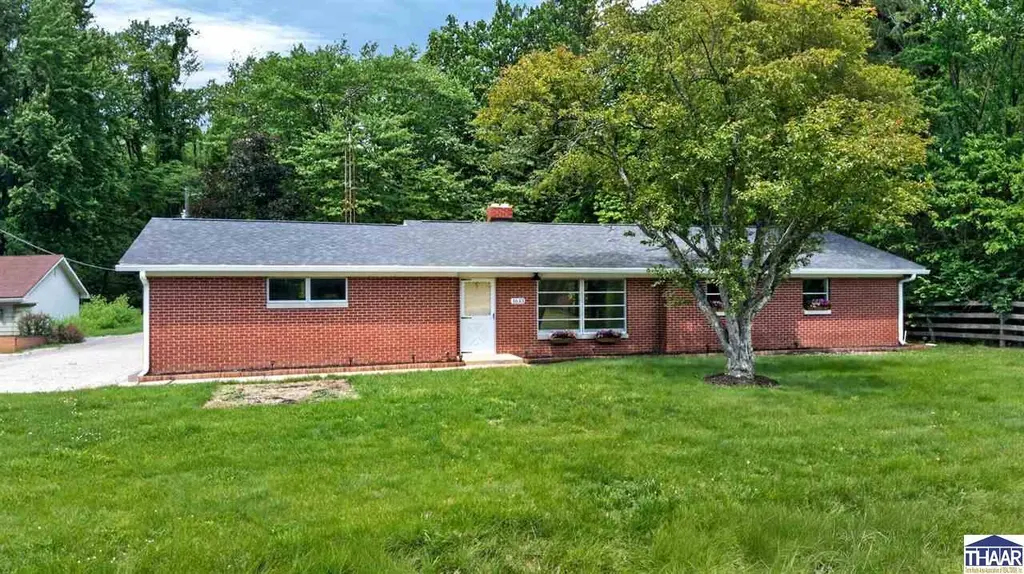
1633 S ST RD 46 · Terre Haute, IN
Flood risk 1/10 · Minimal
- FEMA flood zone
- X (unshaded)
- Chance of flooding over 30 yrs
- 0.0%
- Est. flood insurance / yr
- $507 – $1,088
Fire risk 1/10 · Minimal
- Est. fire insurance / yr
- $717 – $1,331
Heat risk 4/10 · Minor
- Hot days now (above 103°F)
- 7 days/yr
- Hot days in 30 yrs
- 19 days/yr
Wind risk 2/10 · Minimal
- Chance of severe wind over 30 yrs
- 1.0%
Air-quality risk 3/10 · Minor
- Unhealthy air days now
- 1 days/yr
- Unhealthy air days in 30 yrs
- 3 days/yr
Risk factors via First Street. Map © Google.
Why this score? — see what drove the D grade
The composite is a weighted blend of 9 inputs, each scored 0–100. Each bar is that input's sub-score; the figure is the points it added to the 100-point composite (weight × sub-score).
- Cash flow +15.0/30.0
- ARV discount +7.5/15.0
- DSCR +4.6/10.0
- Livability +3.8/5.0
- 1% rule +3.7/10.0
- Rent growth +3.5/5.0
- Schools +2.9/10.0
- Condition / age +2.5/5.0
- Appreciation +0.0/10.0
$212,500
🖨 Deal sheet (PDF) 📄 Offer letter ✓ Due diligence
Listing remarks
* Some Photos have been Virtually Staged to show potential utilization. * Completely refinished and move-in ready, this bright and airy all-brick ranch on Terre Haute’s desirable east side is the perfect blend of timeless mid-century modern inspiration and today’s modern updates. Situated on over a half-acre lot with a large yard and storage shed, this home offers space, style, and convenience in one attractive package. Inside, you’ll find new flooring, fresh paint, updated finishes, quartz countertops, and a clean modern aesthetic throughout, creating the ideal backdrop for a mid-century modern design style. The open kitchen with open dining space flows beautifully, and
Key facts
- Move-in ready
- All-brick ranch
- New flooring
Tags
Property features AI
Exterior
- Parking: Attached garage; 2 garage spaces; Concrete and gravel driveway/parking
- Security: Smoke detector(s)
- Utilities: Septic tank
- Home design: Single-family residence; Single story
- Construction: Brick construction; Shingle roof
- Exterior features: Covered patio/porch; Shed(s)
Interior
- Kitchen: Dishwasher; Electric range; Electric oven; Refrigerator
- Flooring: Vinyl
- Bathrooms: 1 full bathroom
- Heating & cooling: Heat pump; Electric heating; Forced air
- Interior features: Dishwasher; Dryer; Electric range; Electric oven; Refrigerator; Washer; Vinyl flooring
- Laundry & utility: Washer and dryer
Neighborhood map
What this means for you Summary
Snapshot
- This is a 3-bed/1.0-bath single-family listed at $212k.
Deal economics
- At list price, monthly cash flow is $67 ($804/yr) — positive.
- The deal already cash-flows at list — no discount required.
- To meet the 1% rule (rent ≥ 1% of price), the offer needs to be $185k (13.0% below list).
- Recommended offer: $185k (13.0% below list) — sets the bar for 1% rule.
- Cap rate 6.7% vs local median 4.6% in Terre Haute — top-decile yield for the area; either an underpriced asset or a hidden risk that comps aren't pricing in. Stress-test before assuming the spread holds.
Location & tenants
- Location reads 75/100 on livability (#63 in IN, #4,186 nationally) — a middle-class / working-renter tenant base. Strengths: cost of living A+, housing A+, health & safety A+; Watch: crime F, employment F.
- Vigo County School Corporation (urban): math 32% / reading 37% proficiency, ranked #202 of 301 in IN (top 67%) — families likely to look elsewhere, expect single-tenant / working-renter base with shorter leases.
- Zoned schools: Sugar Grove Elementary School (math 42% / reading 32%, grade F, #550 of 994 statewide, top 57%, 369 students, 76% FRL); Honey Creek Middle School (math 34% / reading 44%, grade F, #128 of 330 statewide, top 40%, 664 students, 39% FRL); Terre Haute South Vigo High School (math 37% / reading 72%, grade C-, #79 of 369 statewide, top 26%, 1,610 students, 51% FRL).
- Market conditions: Rents rising fast (+4.1%/yr); 177 active listings in the ZIP; 2 comparable units currently listed for rent nearby; 60 units permitted in Vigo County in 2024 (0 in 5+ unit buildings).
- This rent runs 37% of the median local income ($61k/yr) — at the standard rent-burdened threshold; future hikes will face affordability resistance.
Forward outlook
- Local home prices are declining (-3.0%/yr); year-one equity from $1k of loan paydown is wiped out by about $6k of value loss. Plan a longer hold.
- Vigo County population projected to shrink 5% by 2050 — rents likely to lag national; underwrite the cash flow, not the appreciation.
Negotiation context
- It's been on market 29 days — a 2% lower offer ($209k) is reasonable based on typical stale-listing flexibility.
- 4 sale attempts since 2y ago with the ask held roughly flat each time — persistent listings suggest the price (not the market) is what's stuck; bring a comps-based counter.
Risks & watch-outs
- Watch-outs: built in 1959 — expect roof / HVAC / electrical / plumbing capex.
Questions for the listing agent
- Built in 1959 — when were the roof, HVAC, electrical panel, plumbing, and water heater last replaced?
- Is there a deadline driving the sale (1031 exchange, divorce, estate, relocation)? That informs how much negotiation room exists.
- Schools are D-rated, which usually means shorter tenancies and higher turnover. Who's the typical renter profile here, and what's been the actual vacancy rate?
- Crime grade is F in this area — have there been break-ins, vandalism, or insurance claims at this property in the last 3 years? What carrier currently insures it and at what premium?
- The area grade is low — what's the realistic commute time and amenity access for the typical tenant pool here? Any planned neighborhood developments (good or bad) we should know about?
- What's the average days-on-market for RENTAL listings here right now (not sales)? A rising rental-DOM trend means longer vacancies and softer asking-rent achievability than the comps imply.
- What's the recent tenant-quality profile in this submarket — average credit score on applications, eviction rate, late-payment / NSF rate, and stable-employment percentage? A property-management company in the area should have these aggregated.
- How much new for-sale + rental construction is in the pipeline within 1–3 miles? Heavy new supply typically softens prices + rents 12–24 months out; constrained supply supports both.
Investment metrics
- 1% rule
- 0.87% ✗
- Cap rate
- 6.67%
- Cash-on-cash
- 1.35%
- DSCR
- 1.06
- GRM
- 9.6
CMA / ARV
No comps found within radius.
Projected returns pro-forma
-3.0% appreciation · 4.09% rent growth · sell at horizon
- IRR
- -13.0%
- Equity multiple
- 0.53×
- Total profit
- $-28,135
- Equity at exit
- $31,684
- IRR
- -2.5%
- Equity multiple
- 0.82×
- Total profit
- $-10,475
- Equity at exit
- $18,373
Cash invested: $59,500 (down + closing). Projections, not guarantees.
Landlord ↔ Tenant lean methodology
- Overall (STATE)
- 90 Strongly Landlord-Friendly
- State Indiana
- 90 Strongly Landlord-Friendly · R+11
- County
- — inherits STATE
- City
- — inherits STATE
ZIP-level market 47803
- Home prices YoY
- -28.6%
- Rents YoY
- 4.1%
- Active inventory
- 177
- Price-to-rent
- 9.6×
Monthly cashflow live
- Estimated rent
- $1,850 medium interval (Pro) →
- Mortgage (P&I)
- −$1,114
- Tax from tax record
- −$191 /mo · $2,296/yr
- Insurance
- −$89
- HOA
- −$0
- Vacancy / Maint / Mgmt
- −$388
- Net cashflow
- $67
Break-even live
Sensitivity live
| Price | -10% $187 | -5% $127 | +0% $67 | +5% $7 | +10% $-53 |
|---|---|---|---|---|---|
| Rent | -10% $-79 | -5% $-6 | +0% $67 | +5% $140 | +10% $213 |
| Rate | -1.0pp $174 | -0.5pp $121 | base $67 | +0.5pp $12 | +1.0pp $-44 |
UW: 25.0% down · 7.5% · 30yr · 1.5% tax · 5.0% vac · 8.0% maint · 8.0% mgmt
Financing live
Cash to close
- Down payment
- $53,125
- Closing costs
- $6,375
- Reserves months
- —
- Total cash needed
- —
Loan-product check · same deal, 3 products live
Conventional
25% down · 7.5% · 30yr
- Down + closing
- —
- Monthly P&I
- —
- Monthly cashflow
- —
- DSCR
- —
- Eligible?
- —
Personal DTI + credit; lowest rate.
DSCR
20% down · 8.5% · 30yr
- Down + closing
- —
- Monthly P&I
- —
- Monthly cashflow
- —
- DSCR
- —
- Eligible?
- —
No personal income docs; deal must DSCR.
Hard money
10% down · 12.0% · 12mo
- Down + closing
- —
- Monthly P&I
- —
- Monthly cashflow
- —
- DSCR
- —
- Eligible?
- —
Short-term bridge; refi at stabilization.
Rent comps 2 comps
| Address | Beds | Baths | Sqft | Rent | $/sqft | DOM | Units | Dist |
|---|---|---|---|---|---|---|---|---|
| 100 Antioch Cir E Terre Haute, IN | 1.0–3.0 | 1.0–2.0 | 1246 | $2,147 | $1.72 | 45d | 23 | 0.45mi |
| 100 Village Dr Terre Haute, IN | 1.0–2.0 | 1.0–1.5 | 725 | $1,160 | $1.60 | 45d | 10 | 0.76mi |
Listing history 26 events
-
2026-06-21days on market $212,500 Active 29 DOM
-
2026-06-19days on market $212,500 Active 27 DOM
-
2026-06-18days on market $212,500 Active 26 DOM
-
2026-06-17days on market $212,500 Active 25 DOM
-
2026-06-16days on market $212,500 Active 24 DOM
-
2026-06-15days on market $212,500 Active 23 DOM
-
2026-06-14days on market $212,500 Active 21 DOM
-
2026-06-13days on market $212,500 Active 20 DOM
-
2026-06-10days on market $212,500 Active 18 DOM
-
2026-06-09days on market $212,500 Active 17 DOM
-
2026-06-08days on market $212,500 Active 16 DOM
-
2026-06-07days on market $212,500 Active 15 DOM
-
2026-06-05days on market $212,500 Active 12 DOM
-
2026-06-02days on market $212,500 Active 10 DOM
-
2026-06-01days on market $212,500 Active 9 DOM
-
2026-05-31days on market $212,500 Active 8 DOM
-
2026-05-30days on market $212,500 Active 7 DOM
-
2026-05-23$212,500 Active
-
2025-07-02status Pending
-
2025-05-20status Active
-
2025-05-12status Pending
-
2025-05-08$149,900 Active
-
2025-04-28price $139,900
-
2025-03-10price $149,900
-
2024-11-16price $155,000
-
2024-11-07$159,900 Active
ⓘ Source: listings_history table (triggers on properties + properties_extension) + one-shot
backfill from property_details.listing_events for pre-trigger history.
Tax reassessment forecast IN · Partial reset (capped growth)
- Current annual tax
- $2,296 · $191/mo
- Projected year-2 tax
- $2,296 · $191/mo
- Expected delta
- $0/yr ($0/mo · 0.0%)
ⓘ Screening estimate from a state-policy table — verify with the county assessor before closing.
Climate risk First Street
- Flood 1/10 Low FEMA zone X (unshaded) · 0% chance over 30 yrs
- Wildfire 1/10 Low
- Heat 4/10 Moderate 7 d/yr ≥103°F today · 19 d/yr by 30 yrs out
- Wind 2/10 Low 100% chance of damaging wind over 30 yrs
- Air quality 3/10 Moderate 1 unhealthy d/yr today · 3 by 30 yrs out
Nearby sold comps map
Loading sold comps map…
Walkable amenities ~0.75 mi
Loading nearby amenities…
Taxation est. · year 1
- Rental income
- $22,196
- − Mortgage interest
- −$11,903
- − Property taxes
- −$2,296
- − Insurance
- −$1,062
- − Repairs & maintenance
- −$1,776
- − Management
- −$1,776
- − Depreciation
- −$6,182
- Taxable loss
- −$2,799
- Est. tax savings @ 24.0%
- +$672
- After-tax cash flow
- $1,476/yr
For passive investors: Depreciation is non-cash, so a rental often shows a tax loss while cash-flowing — sheltering income. Rental losses are passive: they offset passive income freely, and up to $25,000/yr can offset ordinary (W-2) income if you actively participate and your MAGI is under $100k (phasing out to $0 by $150k); unused losses carry forward. On sale, claimed depreciation is recaptured at up to 25%, and gains may owe capital-gains tax (a 1031 exchange can defer both). Figures are a year-1 estimate at your 24.0% rate — not tax advice; consult a CPA.
Schools (NCES district)
- District
- Vigo County School Corporation
- NCES district ID
- 1812090
- Math proficiency
- 32% ▼ -10.00%
- Reading proficiency
- 37% ▼ -8.00%
- Median HH income
- $40,100
- Composite
- 28.97/100
- National rank
- #6625
- State rank
- #202 of 301 in IN
Livability — Terre Haute
- Score
- 75/100
- State rank
- #63
- US rank
- #4186
Category grades
Schools grade is shown separately in the Schools card above.
Census & demographics
- Census place
- Terre Haute, IN
- County
- Vigo County · 91,193 people
- City population
- 91,193
- Metro
- Terre Haute, IN
- Population (ZIP)
- 21,746
- Household income
- $60,565
- Rent vs Own
- Severe rent burden
- 571.0
Population outlook (Vigo County) Hauer SSP2
- Today (2025)
- 106,366 people
- By 2030
- 105,674 · -0.7%
- By 2040
- 103,731 · -2.5%
- By 2050
- 101,200 · -4.9%
- By 2075
- 95,674 · -10.1%
- By 2100
- 85,910 · -19.2%
Race, ethnicity, and origin ACS 2023
- Neighborhood character
- Predominantly White (86%)
- Race & ethnicity
- White 86% Asian 5% Two or more races 4% Black 3% Hispanic / Latino 3%
- Common ancestry
- Slovak 2% Lithuanian 2% Italian 1%
- Foreign-born
- 5% · China, Canada
- Languages at home
- 94% English-only · Chinese 2% Spanish 1% Other Asian/Pacific 1%
Political lean MEDSL · Vigo
- 2024 margin
- R (+18.1) · D 40.0% · R 58.1% · Other 2.0%
- 2008→2024 swing
- -33.9pp toward R · 2008: 15.8pp · 2024: -18.1pp
- All cycles
- 2024: R+18.1 2020: R+14.7 2016: R+15.2 2012: D+0.8 2008: D+15.8
Not yet ingested
- Civics
- —
Market trends
- HPI YoY
- ▼ -69.70%
- Current HPI
- 173.6547
- Rent YoY
- ▲ 4.09%
- Metro
- Terre Haute, IN
- State GDP YoY
- ▲ 2.90%
- F500 in state
- 18
Industry mix (Fortune 500 HQ in IN)
| Industry | F500 HQs | Revenue |
|---|---|---|
| Industrial Machinery | 2 | $37B |
|
||
| Healthcare | 1 | $177B |
|
||
| Pharmaceuticals | 1 | $45B |
|
||
| Metals / Steel | 1 | $18B |
|
||
| Agriculture | 1 | $17B |
|
||
| Packaging | 1 | $12B |
|
||
Price history
+32.9% since first listed9 events — show timeline
- 2026-05-23 Listed $212,500 THAAR
- 2025-07-02 Pending — THAAR
- 2025-05-20 Relisted — THAAR
- 2025-05-12 Pending — THAAR
- 2025-05-08 Listed $149,900 THAAR
- 2025-04-28 Price Changed $139,900 THAAR
- 2025-03-10 Price Changed $149,900 THAAR
- 2024-11-16 Price Changed $155,000 THAAR
- 2024-11-07 Listed $159,900 THAAR
Property tax history
+21.4%/yrLatest (2024): $2,296 · +3.7% YoY. Source: county tax records.
Cash-flow waterfall
monthlySold comps — $/sqft
last 12 mo · ≤1 miLoading sold comps…