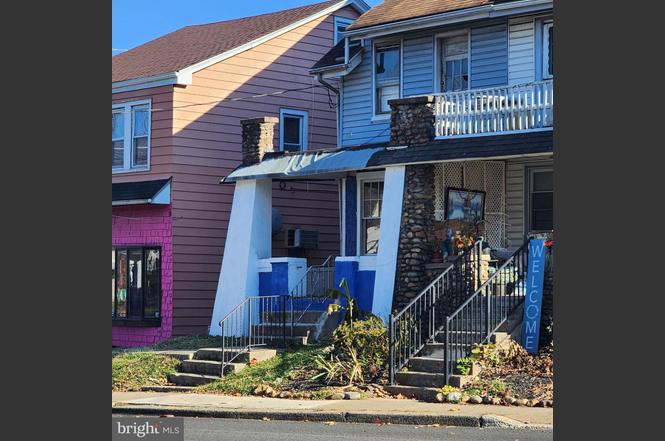
1410 Pennington Rd · Trenton, NJ
Flood risk 1/10 · Minimal
- FEMA flood zone
- X (unshaded)
- Chance of flooding over 30 yrs
- 0.0%
- Est. flood insurance / yr
- $507 – $1,088
Fire risk 1/10 · Minimal
- Est. fire insurance / yr
- $526 – $976
Heat risk 6/10 · Moderate
- Hot days now (above 102°F)
- 7 days/yr
- Hot days in 30 yrs
- 15 days/yr
Wind risk 6/10 · Moderate
- Chance of severe wind over 30 yrs
- 27.0%
Air-quality risk 5/10 · Moderate
- Unhealthy air days now
- 6 days/yr
- Unhealthy air days in 30 yrs
- 8 days/yr
Risk factors via First Street. Map © Google.
Why this score? — see what drove the B grade
The composite is a weighted blend of 9 inputs, each scored 0–100. Each bar is that input's sub-score; the figure is the points it added to the 100-point composite (weight × sub-score).
- Cash flow +26.7/30.0
- ARV discount +15.0/15.0
- DSCR +9.2/10.0
- 1% rule +7.8/10.0
- Livability +3.8/5.0
- Rent growth +3.2/5.0
- Schools +2.5/10.0
- Condition / age +2.5/5.0
- Appreciation +0.0/10.0
$235,000
🖨 Deal sheet (PDF) 📄 Offer letter ✓ Due diligence
Listing remarks MLS
This home is selling totally AS-IS. It needs a total rehab. It has 5 bedrooms 1 bath. No driveway, just on street parking.
Key facts
- Built 1910
- Listed 116 days
Property features AI
Finance
- Other: Energy-efficient HVAC
Exterior
- Parking: On-street parking
- Utilities: Natural gas heating and hot water; Public water; Private sewer
- Home design: Fee simple ownership
- Construction: Estimated year built; Other foundation
- Exterior features: Semi-detached; No tidal water on property; Above-grade other structures
Interior
- Kitchen: Stove; Refrigerator
- Bedrooms: Five main-level bedrooms
- Bathrooms: One full bathroom; One half bathroom
- Heating & cooling: Forced air heating
- Interior features: Fully finished basement; One fireplace
- Laundry & utility: Washer and dryer in basement
Neighborhood map
What this means for you Summary
Snapshot
- This is a 5-bed/1.5-bath single-family listed at $235k.
Deal economics
- At list price, monthly cash flow is $635 ($8k/yr) — positive.
- The deal already cash-flows at list — no discount required.
- Meets the 1% rule at list price ($3k rent vs $235k).
- Recommended offer: $214k (9.0% below list) — sets the bar for market timing.
- Cap rate 9.5% vs local median 6.3% in Trenton — top-decile yield for the area; either an underpriced asset or a hidden risk that comps aren't pricing in. Stress-test before assuming the spread holds.
Location & tenants
- Location reads 76/100 on livability (#133 in NJ, #3,533 nationally) — a middle-class / working-renter tenant base. Strengths: amenities A+, commute A+, health & safety A+; Watch: schools F, crime F, employment F.
- Ewing Township School District (suburban): math 16% / reading 37% proficiency, ranked #358 of 472 in NJ (top 76%) — low school quality limits family demand, transient renter base, plan for 1-2y turnover.
- Market conditions: Rents rising (+2.6%/yr); 144 active listings in the ZIP; 17 comparable units currently listed for rent nearby; rentals at typical pace (median 15d on market — plan ~3-4 weeks tenant-placement turnaround); 2,256 units permitted in Mercer County in 2024 (1,303 in 5+ unit buildings).
- At $3,009/mo this rent would consume 72% of the median local household income ($50k/yr) (locally 2116% of renters already pay >50% of income on rent) — very limited rent-growth headroom before tenants either downsize or default.
Forward outlook
- Local home prices are declining (-3.0%/yr); year-one equity from $2k of loan paydown is wiped out by about $7k of value loss. Plan a longer hold.
- Mercer County population projected at +4% by 2050 — modest demand growth; plan on rents tracking national, not racing it.
- At projected returns (-3.0% appreciation + 2.6% rent growth), your $66k cash investment doubles in ~10 years — after that, you're playing with house money.
Negotiation context
- It's been on market 117 days — a 9% lower offer ($214k) is reasonable based on typical stale-listing flexibility.
- 3 sale attempts since 10y ago with the ask held roughly flat each time — persistent listings suggest the price (not the market) is what's stuck; bring a comps-based counter.
- Current owner paid $159k; 48% above their basis — modest negotiation headroom, anchor on the comps not their cost.
Risks & watch-outs
- Watch-outs: built in 1910 — expect roof / HVAC / electrical / plumbing capex.
- Climate carrying-cost: major wind risk, 27% chance of damaging wind over 30y; extreme-heat days projected 7→15/yr by 2055 (HVAC capex compounding) — expect insurance premiums to compound above CPI over the hold.
Questions for the listing agent
- It's been on market 117 days. Have you received any prior offers? Is the seller open to a 9% concession, seller financing, or rate buy-down credit?
- Built in 1910 — when were the roof, HVAC, electrical panel, plumbing, and water heater last replaced?
- Why hasn't it sold? Are there any deal-killer items the seller is aware of (foundation, flood, title, zoning, code violations)?
- Is there a deadline driving the sale (1031 exchange, divorce, estate, relocation)? That informs how much negotiation room exists.
- Schools are F-rated, which usually means shorter tenancies and higher turnover. Who's the typical renter profile here, and what's been the actual vacancy rate?
- Crime grade is F in this area — have there been break-ins, vandalism, or insurance claims at this property in the last 3 years? What carrier currently insures it and at what premium?
- What's the average days-on-market for RENTAL listings here right now (not sales)? A rising rental-DOM trend means longer vacancies and softer asking-rent achievability than the comps imply.
- What's the recent tenant-quality profile in this submarket — average credit score on applications, eviction rate, late-payment / NSF rate, and stable-employment percentage? A property-management company in the area should have these aggregated.
- How much new for-sale + rental construction is in the pipeline within 1–3 miles? Heavy new supply typically softens prices + rents 12–24 months out; constrained supply supports both.
Investment metrics
- 1% rule
- 1.28% ✓
- Cap rate
- 9.54%
- Cash-on-cash
- 11.59%
- DSCR
- 1.52
- GRM
- 6.5
CMA / ARV
- ARV (on-the-fly)
- $422,170
- Comps found
- 12
Show comp detail 12 sales within ~0.75 mi
| Address | Dist | Beds/Ba | Sqft | Sold | Price | $/sf | Match |
|---|---|---|---|---|---|---|---|
| 42 Hazelhurst Ave | 0.13mi | 4/2.0 (-1) | 1,560 (-4%) | 3mo | $430,000 | $276 | 78 |
| 4 New Hillcrest Ave | 0.04mi | 4/2.0 (-1) | 1,521 (-7%) | 3mo | $385,000 | $253 | 77 |
| 35 Rosedale Ave | 0.17mi | 4/2.0 (-1) | 1,521 (-7%) | 2mo | $425,000 | $279 | 72 |
| 37 Hazelhurst Ave | 0.11mi | 4/2.0 (-1) | 1,521 (-7%) | 7mo | $415,000 | $273 | 71 |
| 1011 Parkside Ave | 0.28mi | 5/2.0 | 1,714 (+5%) | 8mo | $415,000 | $242 | 70 |
| 111 Huff Ave | 0.43mi | 4/2.0 (-1) | 1,592 (-2%) | 1mo | $335,000 | $210 | 68 |
| 221 Hazelhurst Ave | 0.39mi | 5/2.0 | 1,500 (-8%) | 7mo | $410,000 | $273 | 60 |
| 323 Concord Ave | 0.60mi | 4/2.0 (-1) | 1,593 (-2%) | 3mo | $258,100 | $162 | 59 |
| 605 Concord Ave | 0.43mi | 4/2.0 (-1) | 1,736 (+6%) | 7mo | $450,000 | $259 | 57 |
| 224 Hazelhurst Ave | 0.41mi | 4/2.0 (-1) | 1,530 (-6%) | 11mo | $410,000 | $268 | 55 |
| 11 Kern Ave | 0.50mi | 4/2.0 (-1) | 1,464 (-10%) | 14mo | $309,900 | $212 | 41 |
| 118 Hazel | 0.66mi | 4/1.0 (-1) | 1,399 (-14%) | 8mo | $340,000 | $243 | 32 |
Match score weights: distance 35% · size 25% · config 20% · recency 20%. Top-matched comps best support the ARV.
Projected returns pro-forma
-3.0% appreciation · 2.6% rent growth · sell at horizon
- IRR
- 0.5%
- Equity multiple
- 1.02×
- Total profit
- $1,301
- Equity at exit
- $35,039
- IRR
- 9.8%
- Equity multiple
- 1.74×
- Total profit
- $48,813
- Equity at exit
- $20,319
Cash invested: $65,800 (down + closing). Projections, not guarantees.
Landlord ↔ Tenant lean methodology
- Overall (STATE)
- 21 Tenant-Leaning
- State New Jersey
- 21 Tenant-Leaning · D+6
- County
- — inherits STATE
- City
- — inherits STATE
ZIP-level market 08618
- Rents YoY
- 2.6%
- Active inventory
- 144
- Price-to-rent
- 6.5×
Monthly cashflow live
- Estimated rent
- $3,009 high interval (Pro) →
- Mortgage (P&I)
- −$1,232
- Tax from tax record
- −$412 /mo · $4,938/yr
- Insurance
- −$98
- HOA
- −$0
- Vacancy / Maint / Mgmt
- −$632
- Net cashflow
- $635
Break-even live
Sensitivity live
| Price | -10% $768 | -5% $702 | +0% $635 | +5% $569 | +10% $502 |
|---|---|---|---|---|---|
| Rent | -10% $398 | -5% $517 | +0% $635 | +5% $754 | +10% $873 |
| Rate | -1.0pp $754 | -0.5pp $695 | base $635 | +0.5pp $575 | +1.0pp $513 |
UW: 25.0% down · 7.5% · 30yr · 1.5% tax · 5.0% vac · 8.0% maint · 8.0% mgmt
Financing live
Cash to close
- Down payment
- $58,750
- Closing costs
- $7,050
- Reserves months
- —
- Total cash needed
- —
Loan-product check · same deal, 3 products live
Conventional
25% down · 7.5% · 30yr
- Down + closing
- —
- Monthly P&I
- —
- Monthly cashflow
- —
- DSCR
- —
- Eligible?
- —
Personal DTI + credit; lowest rate.
DSCR
20% down · 8.5% · 30yr
- Down + closing
- —
- Monthly P&I
- —
- Monthly cashflow
- —
- DSCR
- —
- Eligible?
- —
No personal income docs; deal must DSCR.
Hard money
10% down · 12.0% · 12mo
- Down + closing
- —
- Monthly P&I
- —
- Monthly cashflow
- —
- DSCR
- —
- Eligible?
- —
Short-term bridge; refi at stabilization.
Rent comps 17 comps
| Address | Beds | Baths | Sqft | Rent | $/sqft | DOM | Units | Dist |
|---|---|---|---|---|---|---|---|---|
| 92 Pennwood Dr Ewing, NJ | 4.0 | 3.0 | 1702 | $3,850 | $2.26 | 14d | 1 | 0.37mi |
| 73 Oak Ln #2 Trenton, NJ | 4.0 | 1.0 | 1886 | $2,300 | $1.22 | 14d | 1 | 0.61mi |
| 510 N Hermitage Ave Trenton, NJ | 5.0 | 1.5 | 1316 | $2,500 | $1.90 | 13d | 1 | 0.83mi |
| 1656 Pennington Rd Ewing, NJ | 6.0 | 2.0 | 1704 | $3,900 | $2.29 | 14d | 1 | 0.86mi |
| 130 W Ingham Ave Trenton, NJ | 4.0 | 1.0 | 1126 | $2,000 | $1.78 | 14d | 1 | 1.07mi |
| 319 Rutherford Ave Trenton, NJ | 4.0 | 2.0 | 1100 | $2,200 | $2.00 | 22d | 1 | 1.10mi |
| 117 Browning Ave Ewing, NJ | 5.0 | 2.0 | 1584 | $3,500 | $2.21 | 22d | 1 | 1.12mi |
| 1314 Princeton Ave Trenton, NJ | 4.0 | 1.0 | 1092 | $2,400 | $2.20 | 14d | 1 | 1.19mi |
| 649 W State St Trenton, NJ | 5.0 | 2.0 | 1870 | $2,900 | $1.55 | 13d | 1 | 1.25mi |
| 117 Rutledge Ave Ewing, NJ | 4.0 | 1.0 | 1260 | $2,800 | $2.22 | 22d | 1 | 1.31mi |
| 1008 Terrace Blvd Ewing, NJ | 4.0 | 1.0 | 1116 | $2,850 | $2.55 | 14d | 1 | 1.32mi |
| 1442 W State St Trenton, NJ | 5.0 | 2.5 | 1956 | $3,000 | $1.53 | 13d | 1 | 1.35mi |
| 73 Bellevue Ave Trenton, NJ | 4.0 | 2.0 | 1950 | $2,400 | $1.23 | 14d | 1 | 1.37mi |
| 311 Calhoun St Trenton, NJ | 4.0 | 1.0 | 1516 | $2,400 | $1.58 | 44d | 1 | 1.37mi |
| 510 W Hanover St Trenton, NJ | 5.0 | 1.0 | 1200 | $2,200 | $1.83 | 14d | 1 | 1.39mi |
| 223 Spring St Trenton, NJ | 6.0 | 2.0 | 1490 | $2,700 | $1.81 | 5d | 1 | 1.39mi |
| 134 Old Rose St Trenton, NJ | 4.0 | 2.0 | 1212 | $2,300 | $1.90 | 22d | 1 | 1.44mi |
Listing history 8 events
-
2026-01-30$235,000 Active
-
2025-02-10soldstatus $159,000
-
2025-02-07soldstatus $159,000 Closed 122-char remark
Show marketing remark (122 chars)
This home is selling totally AS-IS. It needs a total rehab. It has 5 bedrooms 1 bath. No driveway, just on street parking.
-
2024-12-31historical Active Under Contract 122-char remark
Show marketing remark (122 chars)
This home is selling totally AS-IS. It needs a total rehab. It has 5 bedrooms 1 bath. No driveway, just on street parking.
-
2024-12-08$159,000 Active 122-char remark
Show marketing remark (122 chars)
This home is selling totally AS-IS. It needs a total rehab. It has 5 bedrooms 1 bath. No driveway, just on street parking.
-
2017-07-25historical
-
2016-08-08$45,000
-
1987-04-30soldstatus $64,000
ⓘ Source: listings_history table (triggers on properties + properties_extension) + one-shot
backfill from property_details.listing_events for pre-trigger history.
Tax reassessment forecast NJ · Partial reset (capped growth)
- Current annual tax
- $4,938 · $412/mo
- Projected year-2 tax
- $5,395 · $450/mo
- Expected delta
- +$457/yr (+$38/mo · 9.2%)
ⓘ Screening estimate from a state-policy table — verify with the county assessor before closing.
Climate risk First Street
- Flood 1/10 Low FEMA zone X (unshaded) · 0% chance over 30 yrs
- Wildfire 1/10 Low
- Heat 6/10 Major 7 d/yr ≥102°F today · 15 d/yr by 30 yrs out
- Wind 6/10 Major 27% chance of damaging wind over 30 yrs
- Air quality 5/10 Major 6 unhealthy d/yr today · 8 by 30 yrs out
Nearby sold comps map
Loading sold comps map…
Walkable amenities ~0.75 mi
Loading nearby amenities…
Taxation est. · year 1
- Rental income
- $36,110
- − Mortgage interest
- −$13,164
- − Property taxes
- −$4,938
- − Insurance
- −$1,175
- − Repairs & maintenance
- −$2,889
- − Management
- −$2,889
- − Depreciation
- −$6,836
- Taxable income
- $4,219
- Est. tax owed @ 24.0%
- −$1,013
- After-tax cash flow
- $6,612/yr
For passive investors: Depreciation is non-cash, so a rental often shows a tax loss while cash-flowing — sheltering income. Rental losses are passive: they offset passive income freely, and up to $25,000/yr can offset ordinary (W-2) income if you actively participate and your MAGI is under $100k (phasing out to $0 by $150k); unused losses carry forward. On sale, claimed depreciation is recaptured at up to 25%, and gains may owe capital-gains tax (a 1031 exchange can defer both). Figures are a year-1 estimate at your 24.0% rate — not tax advice; consult a CPA.
Schools (NCES district)
- District
- Ewing Township School District
- NCES district ID
- 3404920
- Math proficiency
- 16% ▼ -17.00%
- Reading proficiency
- 37% ▼ -4.00%
- Median HH income
- $73,684
- Composite
- 25.48/100
- National rank
- #7443
- State rank
- #358 of 472 in NJ
Livability — Trenton
- Score
- 76/100
- State rank
- #133
- US rank
- #3533
Category grades
Schools grade is shown separately in the Schools card above.
Census & demographics
- County
- Mercer County · 327,655 people
- City population
- 177,819
- Metro
- Trenton-Princeton, NJ
- Population (ZIP)
- 35,634
- Household income
- $50,390
- Rent vs Own
- Severe rent burden
- 2116.0
Population outlook (Mercer County) Hauer SSP2
- Today (2025)
- 381,395 people
- By 2030
- 384,640 · +0.9%
- By 2040
- 391,431 · +2.6%
- By 2050
- 397,845 · +4.3%
- By 2075
- 417,281 · +9.4%
- By 2100
- 420,327 · +10.2%
Race, ethnicity, and origin ACS 2023
- Neighborhood character
- Diverse neighborhood (Simpson 0.59)
- Race & ethnicity
- Black 59% White 19% Hispanic / Latino 16% Two or more races 7% Asian 3%
- Hispanic origin (detail)
- Mexican 1% Puerto Rican 6% Dominican 3%
- Common ancestry
- Romanian 2% Hispanic 1% Scotch-Irish 1%
- Foreign-born
- 14% · Canada, China, South Korea
- Languages at home
- 80% English-only · Spanish 10% Other Indo-European 3% Arabic 1%
Political lean MEDSL · Mercer
- 2024 margin
- Solid D (+33.9) · D 65.9% · R 32.0% · Other 2.1%
- 2008→2024 swing
- -2.2pp toward R · 2008: 36.1pp · 2024: 33.9pp
- All cycles
- 2024: D+33.9 2020: D+40.0 2016: D+36.2 2012: D+36.8 2008: D+36.1
Not yet ingested
- Civics
- —
Market trends
- HPI YoY
- ▼ -309.54%
- Current HPI
- 288.6841
- Rent YoY
- ▲ 2.60%
- Metro
- Trenton-Princeton, NJ
- State GDP YoY
- ▲ 2.05%
- F500 in state
- 34
Industry mix (Fortune 500 HQ in NJ)
| Industry | F500 HQs | Revenue |
|---|---|---|
| Consumer Goods | 3 | $31B |
|
||
| Pharmaceuticals | 2 | $153B |
|
||
| Technology | 2 | $21B |
|
||
| Insurance | 2 | $20B |
|
||
| Healthcare | 2 | $19B |
|
||
| Financial Services | 1 | $70B |
|
||
Price history
+267.2% since first listed8 events — show timeline
- 2026-01-30 Listed $235,000 BRIGHT MLS
- 2025-02-10 Sold (Public Records) $159,000 Public Records
- 2025-02-07 Sold (MLS) $159,000 BRIGHT MLS
- 2024-12-31 Contingent — BRIGHT MLS
- 2024-12-08 Listed $159,000 BRIGHT MLS
- 2017-07-25 Listing Removed — BRIGHT MLS
- 2016-08-08 Listed $45,000 BRIGHT MLS
- 1987-04-30 Sold (Public Records) $64,000 Public Records
Property tax history
+1.9%/yrLatest (2025): $4,938 · +3.0% YoY. Source: county tax records.
Cash-flow waterfall
monthlySold comps — $/sqft
last 12 mo · ≤1 miLoading sold comps…