 Triplex
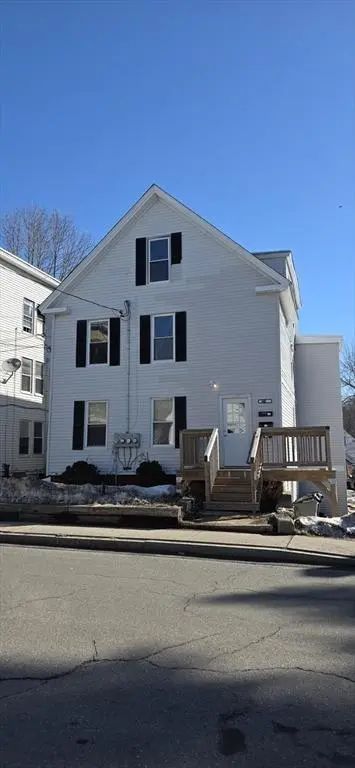
274 Pleasant St · Gardner, MA
Flood risk 1/10 · Minimal
- FEMA flood zone
- —
- Chance of flooding over 30 yrs
- 0.0%
- Est. flood insurance / yr
- —
Fire risk 2/10 · Minimal
- Est. fire insurance / yr
- $915 – $1,699
Heat risk 3/10 · Minor
- Hot days now (above 92°F)
- 7 days/yr
- Hot days in 30 yrs
- 17 days/yr
Wind risk 5/10 · Moderate
- Chance of severe wind over 30 yrs
- 26.0%
Air-quality risk 2/10 · Minimal
- Unhealthy air days now
- 1 days/yr
- Unhealthy air days in 30 yrs
- 1 days/yr
Risk factors via First Street. Map © Google.
Why this score? — see what drove the B- grade
The composite is a weighted blend of 9 inputs, each scored 0–100. Each bar is that input's sub-score; the figure is the points it added to the 100-point composite (weight × sub-score).
- Cash flow +26.8/30.0
- ARV discount +14.2/15.0
- DSCR +9.2/10.0
- 1% rule +6.6/10.0
- Rent growth +3.8/5.0
- Livability +3.8/5.0
- Condition / age +2.5/5.0
- Schools +2.0/10.0
- Appreciation +0.0/10.0
$450,000
🖨 Deal sheet (PDF) 📄 Offer letter ✓ Due diligence
Multi-family units
County records classify this as Multi-Family (2-4 Unit). Listing-text estimate: 3 units. confirmed
Listing remarks MLS
Three family currently occupied,plenty of off street parking,subject to short sale approval by lender.
Key facts
- 0.24 acre lot
- 5 parking spots
- Community pool
Property features AI
Finance
- HOA & community: Community amenities nearby: public transportation, shopping, pool, park, walk/jog trails, golf, medical facility, laundromat, bike path, conservation area, highway access, house of worship, public school
Exterior
- Parking: 5 off-street/open parking spaces; Shared driveway
- Utilities: Public water; Public sewer; Electricity individually metered
- Home design: 3-family (3 units up/down); 3 stories; Total building area approximately 3,914
- Construction: Frame construction; Concrete perimeter, stone and brick/mortar foundation; Shingle roof; Originally built (year per public records)
- Exterior features: Gentle sloping lot; Paved public road frontage with public maintenance
Interior
- Kitchen: Range; Refrigerator
- Flooring: Varies
- Bathrooms: 3 full bathrooms
- Heating & cooling: Baseboard heating; Natural gas heating; Electric heating
- Interior features: 15 total rooms; Full unfinished walk-out basement with concrete floor; Varied flooring
Neighborhood map
What this means for you Summary
Snapshot
- This is a 1×3bd/1ba + 1×2bd/1ba + 1×1bd/1ba units multifamily listed at $450k.
Deal economics
- At list price, monthly cash flow is $1k ($15k/yr) — positive. Per door: $411/mo.
- The deal already cash-flows at list — no discount required.
- Meets the 1% rule at list price ($5k rent vs $450k).
- Recommended offer: $436k (3.0% below list) — sets the bar for market timing.
- Cap rate 9.6% vs local median 3.6% in Gardner — top-decile yield for the area; either an underpriced asset or a hidden risk that comps aren't pricing in. Stress-test before assuming the spread holds.
Location & tenants
- Location reads 76/100 on livability (#61 in MA, #3,394 nationally) — a middle-class / working-renter tenant base. Strengths: housing A+, health & safety A+, commute A-; Watch: employment C-, amenities F.
- Gardner (suburban): math 16% / reading 29% proficiency, ranked #284 of 302 in MA (top 94%) — low school quality limits family demand, transient renter base, plan for 1-2y turnover.
- Zoned schools: Gardner Elementary School (math 18% / reading 38%, grade F, #689 of 938 statewide, top 74%, 986 students, 0% FRL); Gardner Middle School (math 16% / reading 27%, grade F, #249 of 305 statewide, top 82%, 489 students, 0% FRL); Gardner High (math 15% / reading 27%, grade F, #305 of 343 statewide, top 89%, 804 students, 0% FRL) — zoned schools average 0% FRL vs 47% district-wide (47 pts lower); this property's tenant base skews higher-income than the district average.
- Market conditions: Rents rising fast (+5.2%/yr); 34 active listings in the ZIP; 2,293 units permitted in Worcester County in 2024 (1,205 in 5+ unit buildings).
- At $5,200/mo this rent would consume 93% of the median local household income ($67k/yr) (locally 975% of renters already pay >50% of income on rent) — very limited rent-growth headroom before tenants either downsize or default.
Forward outlook
- Local home prices are declining (-3.0%/yr); year-one equity from $3k of loan paydown is wiped out by about $14k of value loss. Plan a longer hold.
- At projected returns (-3.0% appreciation + 5.2% rent growth), your $126k cash investment doubles in ~8 years — after that, you're playing with house money.
Negotiation context
- It's been on market 52 days — a 3% lower offer ($436k) is reasonable based on typical stale-listing flexibility.
- 5 sale attempts since 21y ago with the ask held roughly flat each time — persistent listings suggest the price (not the market) is what's stuck; bring a comps-based counter.
- Current owner paid $75k; list at $450k implies a 500% gain — meaningful room to come down on a strong offer.
Risks & watch-outs
- Watch-outs: built in 1900 — expect roof / HVAC / electrical / plumbing capex.
- Climate carrying-cost: moderate wind risk, 26% chance of damaging wind over 30y — expect insurance premiums to compound above CPI over the hold.
Questions for the listing agent
- It's been on market 52 days. Have you received any prior offers? Is the seller open to a 3% concession, seller financing, or rate buy-down credit?
- Can we see the unit-by-unit rent roll, current vacancy, and any below-market leases? What's the average tenancy length?
- What capital expenditures (roof, boiler, parking lot, exteriors) have been made in the last 5 years, and what's planned in the next 2?
- Built in 1900 — when were the roof, HVAC, electrical panel, plumbing, and water heater last replaced?
- Is there a deadline driving the sale (1031 exchange, divorce, estate, relocation)? That informs how much negotiation room exists.
- Schools are D-rated, which usually means shorter tenancies and higher turnover. Who's the typical renter profile here, and what's been the actual vacancy rate?
- What's the average days-on-market for RENTAL listings here right now (not sales)? A rising rental-DOM trend means longer vacancies and softer asking-rent achievability than the comps imply.
- What's the recent tenant-quality profile in this submarket — average credit score on applications, eviction rate, late-payment / NSF rate, and stable-employment percentage? A property-management company in the area should have these aggregated.
- How much new apartment / multifamily construction is in the pipeline within 1–3 miles? Heavy new supply (>2% of stock underway) typically softens rents 12–24 months out; light construction supports rent growth.
Investment metrics
- 1% rule
- 1.16% ✓
- Cap rate
- 9.58%
- Cash-on-cash
- 11.74%
- DSCR
- 1.52
- GRM
- 7.2
CMA / ARV
- ARV (median comp)
- $528,050
- List price
- $450,000
- Delta
- -14.78%
- Verdict
- UNDERPRICED
- Comps
- 20 within 1.0 mi
Show comp detail 11 sales within ~0.75 mi
| Address | Dist | Beds/Ba | Sqft | Sold | Price | $/sf | Match |
|---|---|---|---|---|---|---|---|
| 46 Wright St | 0.11mi | 8/2.0 (+1) | 2,286 (-5%) | 16mo | $399,000 | $175 | 64 |
| 105 Conant St | 0.53mi | 6/2.0 (-1) | 2,400 (-0%) | 4mo | $450,000 | $188 | 62 |
| 24 Greenwood St | 0.33mi | 7/2.0 | 2,204 (-8%) | 6mo | $300,000 | $136 | 62 |
| 56 Baker St | 0.12mi | 6/3.5 (-1) | 2,600 (+8%) | 16mo | $445,000 | $171 | 61 |
| 183 Connors St | 0.13mi | 6/4.0 (-1) | 2,586 (+8%) | 14mo | $580,000 | $224 | 60 |
| 65 School St | 0.56mi | 6/2.0 (-1) | 2,424 (+1%) | 6mo | $455,000 | $188 | 58 |
| 38 Baker St | 0.10mi | 6/4.0 (-1) | 2,670 (+11%) | 12mo | $510,000 | $191 | 58 |
| 149 Cross St | 0.46mi | 6/3.0 (-1) | 2,648 (+10%) | 1mo | $512,500 | $194 | 56 |
| 220 Pine St | 0.20mi | 6/2.0 (-1) | 2,176 (-9%) | 18mo | $475,000 | $218 | 51 |
| 91 Regan St | 0.29mi | 7/4.0 | 2,128 (-11%) | 18mo | $510,000 | $240 | 49 |
| 29 Osgood St | 0.50mi | 6/4.0 (-1) | 2,306 (-4%) | 24mo | $436,000 | $189 | 41 |
Match score weights: distance 35% · size 25% · config 20% · recency 20%. Top-matched comps best support the ARV.
Projected returns pro-forma
-3.0% appreciation · 5.15% rent growth · sell at horizon
- IRR
- 3.4%
- Equity multiple
- 1.14×
- Total profit
- $17,023
- Equity at exit
- $67,096
- IRR
- 14.8%
- Equity multiple
- 2.31×
- Total profit
- $164,932
- Equity at exit
- $38,908
Cash invested: $126,000 (down + closing). Projections, not guarantees.
Landlord ↔ Tenant lean methodology
- Overall (STATE)
- 20 Strongly Tenant-Friendly
- State Massachusetts
- 20 Strongly Tenant-Friendly · D+15
- County
- — inherits STATE
- City
- — inherits STATE
ZIP-level market 01440
- Home prices YoY
- -25.8%
- Rents YoY
- 5.2%
- Active inventory
- 34
- Price-to-rent
- 20.4×
Monthly cashflow live
- Estimated rent
- $5,200 high interval (Pro) →
- Mortgage (P&I)
- −$2,360
- Tax from tax record
- −$328 /mo · $3,934/yr
- Insurance
- −$188
- HOA
- −$0
- Vacancy / Maint / Mgmt
- −$1,092
- Net cashflow
- $1,233
Break-even live
Sensitivity live
| Price | -10% $1,488 | -5% $1,360 | +0% $1,233 | +5% $1,105 | +10% $978 |
|---|---|---|---|---|---|
| Rent | -10% $822 | -5% $1,027 | +0% $1,233 | +5% $1,438 | +10% $1,644 |
| Rate | -1.0pp $1,459 | -0.5pp $1,347 | base $1,233 | +0.5pp $1,116 | +1.0pp $998 |
3-unit breakdown (identical units grouped — click to expand)
| Units | Beds | Baths | Est. rent |
|---|---|---|---|
| 1× unit | 3 | 1 | $1,836 |
| 1× unit | 2 | 1 | $1,738 |
| 1× unit | 1 | 1 | $1,626 |
| Total (3 units) | $5,200 | ||
UW: 25.0% down · 7.5% · 30yr · 1.5% tax · 5.0% vac · 8.0% maint · 8.0% mgmt
Financing live
Cash to close
- Down payment
- $112,500
- Closing costs
- $13,500
- Reserves months
- —
- Total cash needed
- —
Loan-product check · same deal, 3 products live
Conventional
25% down · 7.5% · 30yr
- Down + closing
- —
- Monthly P&I
- —
- Monthly cashflow
- —
- DSCR
- —
- Eligible?
- —
Personal DTI + credit; lowest rate.
DSCR
20% down · 8.5% · 30yr
- Down + closing
- —
- Monthly P&I
- —
- Monthly cashflow
- —
- DSCR
- —
- Eligible?
- —
No personal income docs; deal must DSCR.
Hard money
10% down · 12.0% · 12mo
- Down + closing
- —
- Monthly P&I
- —
- Monthly cashflow
- —
- DSCR
- —
- Eligible?
- —
Short-term bridge; refi at stabilization.
Listing history 34 events
-
2026-06-21days on market $450,000 Active 52 DOM
-
2026-06-18days on market $450,000 Active 49 DOM
-
2026-06-17days on market $450,000 Active 48 DOM
-
2026-06-16days on market $450,000 Active 47 DOM
-
2026-06-15days on market $450,000 Active 46 DOM
-
2026-06-14days on market $450,000 Active 44 DOM
-
2026-06-13days on market $450,000 Active 43 DOM
-
2026-06-10days on market $450,000 Active 41 DOM
-
2026-06-09days on market $450,000 Active 40 DOM
-
2026-06-08days on market $450,000 Active 39 DOM
-
2026-06-07days on market $450,000 Active 38 DOM
-
2026-06-05days on market $450,000 Active 35 DOM
-
2026-06-03days on market $450,000 Active 34 DOM
-
2026-06-02days on market $450,000 Active 33 DOM
-
2026-06-01days on market $450,000 Active 32 DOM
-
2026-05-31days on market $450,000 Active 31 DOM
-
2026-05-31days on market $450,000 Active 30 DOM
-
2026-04-30$450,000 New 993-char remark
-
2014-10-06soldstatus $75,000 Sold 102-char remark
Show marketing remark (102 chars)
Three family currently occupied,plenty of off street parking,subject to short sale approval by lender.
-
2014-08-22historical Contingent 102-char remark
Show marketing remark (102 chars)
Three family currently occupied,plenty of off street parking,subject to short sale approval by lender.
-
2013-12-18price $95,000 Price Changed 102-char remark
Show marketing remark (102 chars)
Three family currently occupied,plenty of off street parking,subject to short sale approval by lender.
-
2013-12-18status Price Changed 102-char remark
Show marketing remark (102 chars)
Three family currently occupied,plenty of off street parking,subject to short sale approval by lender.
-
2013-11-14historical Contingent 102-char remark
Show marketing remark (102 chars)
Three family currently occupied,plenty of off street parking,subject to short sale approval by lender.
-
2013-08-09price $99,900 Back On Market 102-char remark
Show marketing remark (102 chars)
Three family currently occupied,plenty of off street parking,subject to short sale approval by lender.
-
2013-08-09status Back On Market 102-char remark
Show marketing remark (102 chars)
Three family currently occupied,plenty of off street parking,subject to short sale approval by lender.
-
2013-07-03historical Under Agreement 102-char remark
Show marketing remark (102 chars)
Three family currently occupied,plenty of off street parking,subject to short sale approval by lender.
-
2013-04-04price $94,900 Price Changed 102-char remark
Show marketing remark (102 chars)
Three family currently occupied,plenty of off street parking,subject to short sale approval by lender.
-
2013-02-14$99,900 New 102-char remark
Show marketing remark (102 chars)
Three family currently occupied,plenty of off street parking,subject to short sale approval by lender.
-
2006-09-28soldstatus $229,000
-
2006-09-27soldstatus $229,000
Show marketing remark (150 chars)
Money making 3-Family. Coin operated washer & dryer convey. Tile floors in kitchens and baths. Many recent improvements. Frontage on two streets.
-
2006-08-25soldstatus $162,500
-
2006-07-24historical
Show marketing remark (150 chars)
Money making 3-Family. Coin operated washer & dryer convey. Tile floors in kitchens and baths. Many recent improvements. Frontage on two streets.
-
2005-09-09$259,000
Show marketing remark (150 chars)
Money making 3-Family. Coin operated washer & dryer convey. Tile floors in kitchens and baths. Many recent improvements. Frontage on two streets.
-
1989-09-01soldstatus $132,000
ⓘ Source: listings_history table (triggers on properties + properties_extension) + one-shot
backfill from property_details.listing_events for pre-trigger history.
Tax reassessment forecast MA · Partial reset (capped growth)
- Current annual tax
- $3,934 · $328/mo
- Projected year-2 tax
- $4,734 · $395/mo
- Expected delta
- +$800/yr (+$67/mo · 20.3%)
ⓘ Screening estimate from a state-policy table — verify with the county assessor before closing.
Climate risk First Street
- Flood 1/10 Low 0% chance over 30 yrs
- Wildfire 2/10 Low
- Heat 3/10 Moderate 7 d/yr ≥92°F today · 17 d/yr by 30 yrs out
- Wind 5/10 Major 26% chance of damaging wind over 30 yrs
- Air quality 2/10 Low 1 unhealthy d/yr today · 1 by 30 yrs out
Nearby sold comps map
Loading sold comps map…
Walkable amenities ~0.75 mi
Loading nearby amenities…
Taxation est. · year 1
- Rental income
- $62,400
- − Mortgage interest
- −$25,207
- − Property taxes
- −$3,934
- − Insurance
- −$2,250
- − Repairs & maintenance
- −$4,992
- − Management
- −$4,992
- − Depreciation
- −$13,091
- Taxable income
- $7,934
- Est. tax owed @ 24.0%
- −$1,904
- After-tax cash flow
- $12,890/yr
For passive investors: Depreciation is non-cash, so a rental often shows a tax loss while cash-flowing — sheltering income. Rental losses are passive: they offset passive income freely, and up to $25,000/yr can offset ordinary (W-2) income if you actively participate and your MAGI is under $100k (phasing out to $0 by $150k); unused losses carry forward. On sale, claimed depreciation is recaptured at up to 25%, and gains may owe capital-gains tax (a 1031 exchange can defer both). Figures are a year-1 estimate at your 24.0% rate — not tax advice; consult a CPA.
Schools (NCES district)
- District
- Gardner
- NCES district ID
- 2505130
- Math proficiency
- 16% ▼ -13.00%
- Reading proficiency
- 29% ▬ 0.00%
- Median HH income
- $47,019
- Composite
- 19.65/100
- National rank
- #8739
- State rank
- #284 of 302 in MA
Livability — Gardner
- Score
- 76/100
- State rank
- #61
- US rank
- #3394
Category grades
Schools grade is shown separately in the Schools card above.
Census & demographics
- Census place
- Gardner, MA
- County
- Worcester County · 487,911 people
- City population
- 21,276
- Metro
- Worcester, MA-CT
- Population (ZIP)
- 21,276
- Household income
- $67,440
- Rent vs Own
- Severe rent burden
- 975.0
Population outlook (Worcester County) Hauer SSP2
- Today (2025)
- 850,858 people
- By 2030
- 860,403 · +1.1%
- By 2040
- 869,902 · +2.2%
- By 2050
- 869,110 · +2.1%
- By 2075
- 870,120 · +2.3%
- By 2100
- 829,703 · -2.5%
Race, ethnicity, and origin ACS 2023
- Neighborhood character
- Predominantly White (80%)
- Race & ethnicity
- White 80% Hispanic / Latino 9% Two or more races 8% Black 4% Asian 3%
- Hispanic origin (detail)
- Puerto Rican 6%
- Common ancestry
- Lithuanian 11% Romanian 4% Slovak 2%
- Foreign-born
- 8% · Canada, Vietnam, South Korea
- Languages at home
- 86% English-only · Spanish 6% French/Haitian/Cajun 3% Other Asian/Pacific 1%
Political lean MEDSL · Worcester
- 2024 margin
- D (+10.0) · D 53.9% · R 43.9% · Other 2.2%
- 2008→2024 swing
- -3.8pp toward R · 2008: 13.8pp · 2024: 10.0pp
- All cycles
- 2024: D+10.0 2020: D+17.8 2016: D+10.5 2012: D+9.2 2008: D+13.8
Not yet ingested
- Civics
- —
Market trends
- HPI YoY
- ▼ -100.35%
- Current HPI
- 288.3218
- Rent YoY
- ▲ 5.15%
- Metro
- Worcester, MA-CT
- State GDP YoY
- ▲ 2.28%
- F500 in state
- 38
Industry mix (Fortune 500 HQ in MA)
| Industry | F500 HQs | Revenue |
|---|---|---|
| Technology | 3 | $17B |
|
||
| Insurance | 2 | $84B |
|
||
| Retail | 2 | $76B |
|
||
| Life Sciences | 1 | $43B |
|
||
| Energy Technology | 1 | $31B |
|
||
| Aerospace / Defense | 1 | $18B |
|
||
Price history
+240.9% since first listed17 events — show timeline
- 2026-04-30 Listed $450,000 MLS PIN
- 2014-10-06 Sold (MLS) $75,000 MLS PIN
- 2014-08-22 Contingent — MLS PIN
- 2013-12-18 Relisted — MLS PIN
- 2013-12-18 Price Changed $95,000 MLS PIN
- 2013-11-14 Contingent — MLS PIN
- 2013-08-09 Relisted — MLS PIN
- 2013-08-09 Price Changed $99,900 MLS PIN
- 2013-07-03 Contingent — MLS PIN
- 2013-04-04 Price Changed $94,900 MLS PIN
- 2013-02-14 Listed $99,900 MLS PIN
- 2006-09-28 Sold (Public Records) $229,000 Public Records
- 2006-09-27 Sold (MLS) $229,000 MLS PIN
- 2006-08-25 Sold (Public Records) $162,500 Public Records
- 2006-07-24 Listing Removed — MLS PIN
- 2005-09-09 Listed $259,000 MLS PIN
- 1989-09-01 Sold (Public Records) $132,000 Public Records
Property tax history
+2.4%/yrLatest (2023): $3,934 · +15.1% YoY. Source: county tax records.
Cash-flow waterfall
monthlySold comps — $/sqft
last 12 mo · ≤1 miLoading sold comps…