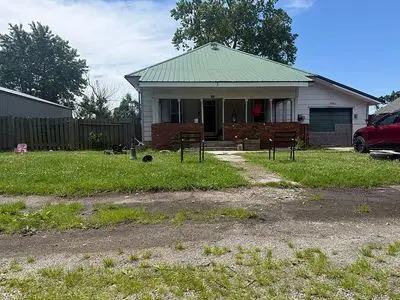
205 Kentucky St · Quapaw, OK
Flood risk 1/10 · Minimal
- FEMA flood zone
- X (unshaded)
- Chance of flooding over 30 yrs
- 0.0%
- Est. flood insurance / yr
- $507 – $1,088
Fire risk 7/10 · Major
- Est. fire insurance / yr
- $2,463 – $4,575
Heat risk 6/10 · Moderate
- Hot days now (above 110°F)
- 7 days/yr
- Hot days in 30 yrs
- 20 days/yr
Wind risk 2/10 · Minimal
- Chance of severe wind over 30 yrs
- 2.0%
Air-quality risk 2/10 · Minimal
- Unhealthy air days now
- 1 days/yr
- Unhealthy air days in 30 yrs
- 1 days/yr
Risk factors via First Street. Map © Google.
Why this score? — see what drove the D- grade
The composite is a weighted blend of 9 inputs, each scored 0–100. Each bar is that input's sub-score; the figure is the points it added to the 100-point composite (weight × sub-score).
- Cash flow +12.3/30.0
- ARV discount +7.5/15.0
- Appreciation +5.0/10.0
- DSCR +3.6/10.0
- Livability +2.9/5.0
- Rent growth +2.5/5.0
- Condition / age +2.5/5.0
- 1% rule +2.3/10.0
- Schools +0.9/10.0
$140,000
🖨 Deal sheet 📄 Offer letter ✓ Due diligence
Listing remarks
Charming home offered For Sale By Owner at a value-conscious price! This property is priced below market to reflect a few minor cosmetic updates & acirc; & euro; & rdquo; mainly interior paint and finishing trim & acirc; & euro; & rdquo; that are already in progress. As these improvements are completed, the asking price will become more firm. Already completed items include: new electrical wiring 2019, metal roof installed 2010, 30 amp box for RV installed with space for parking, box for level 2 EV charging as well, smart thermostat, Ring camera. We & acirc; & euro; & trade; re continuing to make improvements to paint, trim, etc. Pictures will be updated
Key facts
- Metal roof
- 30 amp box for rv
- Ring camera
Tags
Neighborhood map
What this means for you Summary
Snapshot
- This is a 3-bed/1.0-bath single-family listed at $140k.
Deal economics
- At list price, monthly cash flow is $-27 ($-320/yr) — negative.
- To cash-flow at today's rent, offer at most $135k (3.4% below list).
- To meet the 1% rule (rent ≥ 1% of price), the offer needs to be $102k (27.4% below list).
- Recommended offer: $102k (27.4% below list) — sets the bar for 1% rule.
Location & tenants
- Location reads 58/100 on livability (#411 in OK) — a working-class tenant base; expect higher turnover. Strengths: cost of living A+, housing A+; Watch: schools F, crime F, amenities F.
- Quapaw (rural): math 7% / reading 14% proficiency, ranked #247 of 270 in OK (top 92%) — low school quality limits family demand, transient renter base, plan for 1-2y turnover.
- Market conditions: 9 active listings in the ZIP; 3 units permitted in Ottawa County in 2024 (0 in 5+ unit buildings).
Forward outlook
- In year one you build about $5k of equity ($968 loan paydown + $4k appreciation (3.0% local appreciation)).
- Ottawa County population projected to shrink 4% by 2050 — rents likely to lag national; underwrite the cash flow, not the appreciation.
- At projected returns (3.0% appreciation + 3.0% rent growth), your $39k cash investment doubles in ~7 years — after that, you're playing with house money.
- By year 7, paydown + projected appreciation supports a ~$33k cash-out refi (75% LTV) — recoverable capital for the next deal without selling this one.
Negotiation context
- It's been on market 35 days — a 3% lower offer ($136k) is reasonable based on typical stale-listing flexibility.
- Current owner paid $70k; list at $140k implies a 100% gain — meaningful room to come down on a strong offer.
Risks & watch-outs
- Climate carrying-cost: major wildfire risk; extreme-heat days projected 7→20/yr by 2055 (HVAC capex compounding) — expect insurance premiums to compound above CPI over the hold.
Questions for the listing agent
- What do current leases actually rent for vs. the listed asking? Can we see a recent rent roll and the last 12 months of T-12 income?
- It's been on market 35 days. Have you received any prior offers? Is the seller open to a 27% concession, seller financing, or rate buy-down credit?
- Is there a deadline driving the sale (1031 exchange, divorce, estate, relocation)? That informs how much negotiation room exists.
- Schools are F-rated, which usually means shorter tenancies and higher turnover. Who's the typical renter profile here, and what's been the actual vacancy rate?
- Crime grade is F in this area — have there been break-ins, vandalism, or insurance claims at this property in the last 3 years? What carrier currently insures it and at what premium?
- The area grade is low — what's the realistic commute time and amenity access for the typical tenant pool here? Any planned neighborhood developments (good or bad) we should know about?
- What's the average days-on-market for RENTAL listings here right now (not sales)? A rising rental-DOM trend means longer vacancies and softer asking-rent achievability than the comps imply.
- What's the recent tenant-quality profile in this submarket — average credit score on applications, eviction rate, late-payment / NSF rate, and stable-employment percentage? A property-management company in the area should have these aggregated.
- How much new for-sale + rental construction is in the pipeline within 1–3 miles? Heavy new supply typically softens prices + rents 12–24 months out; constrained supply supports both.
Investment metrics
- 1% rule
- 0.73% ✗
- Cap rate
- 6.06%
- Cash-on-cash
- -0.82%
- DSCR
- 0.96
- GRM
- 11.5
CMA / ARV
No comps found within radius.
Projected returns pro-forma
3.0% appreciation · 3.0% rent growth · sell at horizon
- IRR
- 6.7%
- Equity multiple
- 1.39×
- Total profit
- $15,097
- Equity at exit
- $62,950
- IRR
- 9.5%
- Equity multiple
- 2.43×
- Total profit
- $56,050
- Equity at exit
- $97,014
Cash invested: $39,200 (down + closing). Projections, not guarantees.
Landlord ↔ Tenant lean methodology
- Overall (STATE)
- 83 Strongly Landlord-Friendly
- State Oklahoma
- 83 Strongly Landlord-Friendly · R+20
- County
- — inherits STATE
- City
- — inherits STATE
ZIP-level market 74363
- Active inventory
- 9
- Price-to-rent
- 11.5×
Monthly cashflow live
- Estimated rent
- $1,016 medium interval (Pro) →
- Mortgage (P&I)
- −$734
- Tax from tax record
- −$37 /mo · $440/yr
- Insurance
- −$58
- HOA
- −$0
- Vacancy / Maint / Mgmt
- −$213
- Net cashflow
- $-27
Break-even live
UW: 25.0% down · 7.5% · 30yr · 1.5% tax · 5.0% vac · 8.0% maint · 8.0% mgmt
Financing live
Cash to close
- Down payment
- $35,000
- Closing costs
- $4,200
- Reserves months
- —
- Total cash needed
- —
Loan-product check · same deal, 3 products live
Conventional
25% down · 7.5% · 30yr
- Down + closing
- —
- Monthly P&I
- —
- Monthly cashflow
- —
- DSCR
- —
- Eligible?
- —
Personal DTI + credit; lowest rate.
DSCR
20% down · 8.5% · 30yr
- Down + closing
- —
- Monthly P&I
- —
- Monthly cashflow
- —
- DSCR
- —
- Eligible?
- —
No personal income docs; deal must DSCR.
Hard money
10% down · 12.0% · 12mo
- Down + closing
- —
- Monthly P&I
- —
- Monthly cashflow
- —
- DSCR
- —
- Eligible?
- —
Short-term bridge; refi at stabilization.
Listing history 18 events
-
2026-06-16days on market $140,000 Active 35 DOM
-
2026-06-15days on market $140,000 Active 34 DOM
-
2026-06-14days on market $140,000 Active 32 DOM
-
2026-06-13days on market $140,000 Active 31 DOM
-
2026-06-10days on market $140,000 Active 29 DOM
-
2026-06-09days on market $140,000 Active 28 DOM
-
2026-06-08days on market $140,000 Active 27 DOM
-
2026-06-07days on market $140,000 Active 26 DOM
-
2026-06-03days on market $140,000 Active 22 DOM
-
2026-06-02days on market $140,000 Active 21 DOM
-
2026-06-01days on market $140,000 Active 20 DOM
-
2026-05-31days on market $140,000 Active 19 DOM
-
2026-05-30days on market $140,000 Active 18 DOM
-
2026-05-13price $140,000
-
2026-05-12$149,900 Active
-
2025-07-09soldstatus $70,000
-
2010-03-01soldstatus $52,500
-
2001-02-15soldstatus $35,500
ⓘ Source: listings_history table (triggers on properties + properties_extension) + one-shot
backfill from property_details.listing_events for pre-trigger history.
Tax reassessment forecast OK · Resets to sale price
- Current annual tax
- $440 · $37/mo
- Projected year-2 tax
- $1,260 · $105/mo
- Expected delta
- +$820/yr (+$68/mo · 186.4%)
ⓘ Screening estimate from a state-policy table — verify with the county assessor before closing.
Climate risk First Street
- Flood 1/10 Low FEMA zone X (unshaded) · 0% chance over 30 yrs
- Wildfire 7/10 Severe
- Heat 6/10 Major 7 d/yr ≥110°F today · 20 d/yr by 30 yrs out
- Wind 2/10 Low 2% chance of damaging wind over 30 yrs
- Air quality 2/10 Low 1 unhealthy d/yr today · 1 by 30 yrs out
Nearby sold comps map
Loading sold comps map…
Walkable amenities ~0.75 mi
Loading nearby amenities…
Taxation est. · year 1
- Rental income
- $12,190
- − Mortgage interest
- −$7,842
- − Property taxes
- −$440
- − Insurance
- −$700
- − Repairs & maintenance
- −$975
- − Management
- −$975
- − Depreciation
- −$4,073
- Taxable loss
- −$2,815
- Est. tax savings @ 24.0%
- +$676
- After-tax cash flow
- $356/yr
For passive investors: Depreciation is non-cash, so a rental often shows a tax loss while cash-flowing — sheltering income. Rental losses are passive: they offset passive income freely, and up to $25,000/yr can offset ordinary (W-2) income if you actively participate and your MAGI is under $100k (phasing out to $0 by $150k); unused losses carry forward. On sale, claimed depreciation is recaptured at up to 25%, and gains may owe capital-gains tax (a 1031 exchange can defer both). Figures are a year-1 estimate at your 24.0% rate — not tax advice; consult a CPA.
Schools (NCES district)
- District
- Quapaw
- NCES district ID
- 4025320
- Math proficiency
- 7% ▼ -14.00%
- Reading proficiency
- 14% ▼ -14.00%
- Median HH income
- $39,487
- Composite
- 9.01/100
- National rank
- #9882
- State rank
- #247 of 270 in OK
Livability — Quapaw
- Score
- 58/100
- State rank
- #411
- US rank
- #20712
Category grades
Schools grade is shown separately in the Schools card above.
Census & demographics
- Census place
- Quapaw, OK
- Population (ZIP)
- 2,646
Population outlook (Ottawa County) Hauer SSP2
- Today (2025)
- 31,860 people
- By 2030
- 31,699 · -0.5%
- By 2040
- 31,324 · -1.7%
- By 2050
- 30,745 · -3.5%
- By 2075
- 29,902 · -6.1%
- By 2100
- 27,545 · -13.5%
Race, ethnicity, and origin ACS 2023
- Neighborhood character
- Diverse neighborhood (Simpson 0.61)
- Race & ethnicity
- White 63% Native American 24% Two or more races 11% Hispanic / Latino 2%
- Common ancestry
- Slovak 1% Iranian 1% Lithuanian 1%
- Foreign-born
- 1% · Canada, China
- Languages at home
- 97% English-only · Chinese 1% Spanish 1%
Political lean MEDSL · Ottawa
- 2024 margin
- Solid R (+53.5) · D 22.5% · R 76.0% · Other 1.6%
- 2008→2024 swing
- -29.9pp toward R · 2008: -23.6pp · 2024: -53.5pp
- All cycles
- 2024: R+53.5 2020: R+51.2 2016: R+47.2 2012: R+29.7 2008: R+23.6
Not yet ingested
- Civics
- —
Market trends
- HPI YoY
- —
- Current HPI
- —
- Rent YoY
- —
- Metro
- —
- State GDP YoY
- ▲ 1.55%
- F500 in state
- 6
Industry mix (Fortune 500 HQ in OK)
| Industry | F500 HQs | Revenue |
|---|---|---|
| Energy | 3 | $48B |
|
||
Price history
+294.4% since first listed5 events — show timeline
- 2026-05-13 Price Changed $140,000 FSBO.com
- 2026-05-12 Listed $149,900 FSBO.com
- 2025-07-09 Sold (Public Records) $70,000 Public Records
- 2010-03-01 Sold (Public Records) $52,500 Public Records
- 2001-02-15 Sold (Public Records) $35,500 Public Records
Property tax history
+0.2%/yrLatest (2025): $440 · -23.1% YoY. Source: county tax records.
Cash-flow waterfall
monthlySold comps — $/sqft
last 12 mo · ≤1 miLoading sold comps…