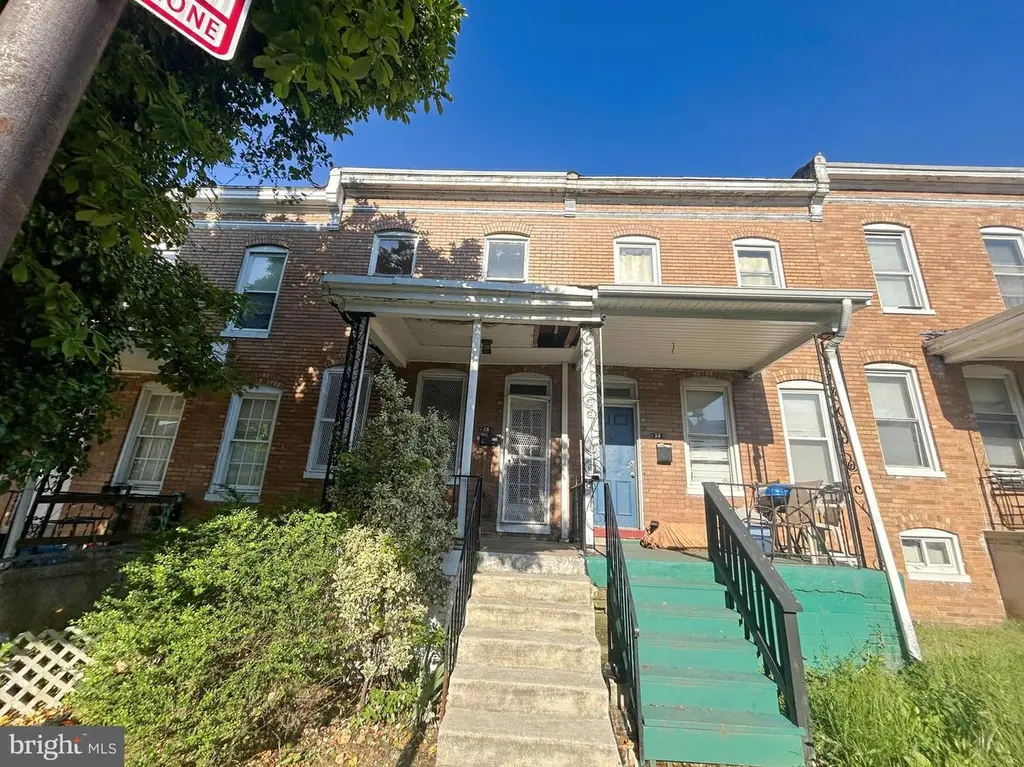
12 N Abington Ave · Baltimore, MD
Flood risk 1/10 · Minimal
- FEMA flood zone
- X (unshaded)
- Chance of flooding over 30 yrs
- 0.0%
- Est. flood insurance / yr
- $473 – $860
Fire risk 2/10 · Minimal
- Est. fire insurance / yr
- $755 – $1,403
Heat risk 7/10 · Major
- Hot days now (above 103°F)
- 7 days/yr
- Hot days in 30 yrs
- 15 days/yr
Wind risk 6/10 · Moderate
- Chance of severe wind over 30 yrs
- 27.0%
Air-quality risk 3/10 · Minor
- Unhealthy air days now
- 3 days/yr
- Unhealthy air days in 30 yrs
- 4 days/yr
Risk factors via First Street. Map © Google.
Why this score? — see what drove the B+ grade
The composite is a weighted blend of 9 inputs, each scored 0–100. Each bar is that input's sub-score; the figure is the points it added to the 100-point composite (weight × sub-score).
- Cash flow +30.0/30.0
- ARV discount +15.0/15.0
- 1% rule +10.0/10.0
- DSCR +10.0/10.0
- Rent growth +3.8/5.0
- Livability +3.8/5.0
- Condition / age +2.5/5.0
- Schools +1.0/10.0
- Appreciation +0.0/10.0
$45,600
🖨 Deal sheet (PDF) 📄 Offer letter ✓ Due diligence
Listing remarks
Discover an exceptional investment opportunity in the neighborhood of Carroll-South Hilton. Built in 1926, this townhome exudes character with its classic brick exterior and inviting interior spaces. Venture inside to find spacious living spaces with laminated plank flooring that flows throughout the main and upper levels. The separate dining room provides a cozy spot for formal gathering or casual meals, while the two well-appointed bedrooms offers relaxation after a long day. The full, unfinished basement offers endless possibilities, whether to transform it into a recreation room, home gym, or additional storage space. Enjoy the outdoors on your porch, perfect for morning coffee or eveni
Key facts
- Rear fenced yard
- Separate dining room
- Easy access to parks
Tags
Property features AI
Finance
- Other: Fee simple ownership
Exterior
- Parking: On-street parking
- Utilities: Public water; Public sewer; Natural gas for heating and hot water
- Home design: Interior townhouse/rowhouse; Level entry at main entrance
- Construction: Brick construction with brick front; Built-up roof; Concrete perimeter foundation; Estimated year built
- Exterior features: Sidewalks; Street lights; Rear yard; Rear fencing; Porch(es)
Interior
- Kitchen: Kitchen with space for a table
- Bedrooms: Two bedrooms on the first upper level
- Flooring: Vinyl; Laminate plank; Wood
- Bathrooms: One full bathroom (all upper levels)
- Heating & cooling: Forced air heating; Other heating (unspecified); Natural gas hot water
- Interior features: Dining area; Traditional floor plan; Kitchen with table space; Wood floors; Drywall, paneled and plaster walls
Neighborhood map
What this means for you Summary
Snapshot
- This is a 2-bed/1.0-bath townhouse listed at $46k.
Deal economics
- At list price, monthly cash flow is $813 ($10k/yr) — positive.
- The deal already cash-flows at list — no discount required.
- Meets the 1% rule at list price ($1k rent vs $46k).
- Recommended offer: $44k (3.0% below list) — sets the bar for market timing.
- Cap rate 27.7% vs local median 6.0% in Baltimore — top-decile yield for the area; either an underpriced asset or a hidden risk that comps aren't pricing in. Stress-test before assuming the spread holds.
Location & tenants
- Location reads 76/100 on livability (#90 in MD, #3,396 nationally) — a middle-class / working-renter tenant base. Strengths: amenities A+, commute A+, housing A+; Watch: schools D, crime F.
- Baltimore City Public Schools (urban): math 7% / reading 16% proficiency, ranked #24 of 24 in MD (top 100%) — low school quality limits family demand, transient renter base, plan for 1-2y turnover; 79% free/reduced lunch — lower-income household profile, screen leases tightly.
- Market conditions: Rents rising fast (+5.4%/yr); 256 active listings in the ZIP; 40 comparable units currently listed for rent nearby; rentals at typical pace (median 25d on market — plan ~3-4 weeks tenant-placement turnaround); 40% of comp listings sitting > 30 days — soft ceiling on asking rent; 1,273 units permitted in Baltimore city in 2024 (1,104 in 5+ unit buildings).
Forward outlook
- Local home prices are declining (-3.0%/yr); year-one equity from $315 of loan paydown is wiped out by about $1k of value loss. Plan a longer hold.
- Baltimore County population projected to shrink 4% by 2050 — rents likely to lag national; underwrite the cash flow, not the appreciation.
- At projected returns (-3.0% appreciation + 5.4% rent growth), your $13k cash investment doubles in ~2 years — after that, you're playing with house money.
Negotiation context
- It's been on market 53 days — a 3% lower offer ($44k) is reasonable based on typical stale-listing flexibility.
- Current owner paid $20k; list at $46k implies a 122% gain — meaningful room to come down on a strong offer.
Risks & watch-outs
- Watch-outs: property tax is 2.7% of price; built in 1926 — expect roof / HVAC / electrical / plumbing capex.
- Climate carrying-cost: major wind risk, 27% chance of damaging wind over 30y; extreme-heat days projected 7→15/yr by 2055 (HVAC capex compounding) — expect insurance premiums to compound above CPI over the hold.
Questions for the listing agent
- It's been on market 53 days. Have you received any prior offers? Is the seller open to a 3% concession, seller financing, or rate buy-down credit?
- Built in 1926 — when were the roof, HVAC, electrical panel, plumbing, and water heater last replaced?
- Property tax is high relative to price — has the assessment been appealed recently, and will the sale trigger a re-assessment?
- Is there a deadline driving the sale (1031 exchange, divorce, estate, relocation)? That informs how much negotiation room exists.
- Schools are D-rated, which usually means shorter tenancies and higher turnover. Who's the typical renter profile here, and what's been the actual vacancy rate?
- Crime grade is F in this area — have there been break-ins, vandalism, or insurance claims at this property in the last 3 years? What carrier currently insures it and at what premium?
- What's the average days-on-market for RENTAL listings here right now (not sales)? A rising rental-DOM trend means longer vacancies and softer asking-rent achievability than the comps imply.
- What's the recent tenant-quality profile in this submarket — average credit score on applications, eviction rate, late-payment / NSF rate, and stable-employment percentage? A property-management company in the area should have these aggregated.
- How much new for-sale + rental construction is in the pipeline within 1–3 miles? Heavy new supply typically softens prices + rents 12–24 months out; constrained supply supports both.
Investment metrics
- 1% rule
- 3.26% ✓
- Cap rate
- 27.68%
- Cash-on-cash
- 76.38%
- DSCR
- 4.40
- GRM
- 2.6
CMA / ARV
- ARV (median comp)
- $81,193
- List price
- $45,600
- Delta
- -43.84%
- Verdict
- UNDERPRICED
- Comps
- 20 within 1.0 mi
Show comp detail 12 sales within ~0.75 mi
| Address | Dist | Beds/Ba | Sqft | Sold | Price | $/sf | Match |
|---|---|---|---|---|---|---|---|
| 119 Hilton St | 0.08mi | 2/2.0 | 1,040 (+12%) | 0mo | $211,000 | $203 | 72 |
| 3236 Lohrs Ln | 0.08mi | 2/1.0 | 840 (-10%) | 11mo | $64,000 | $76 | 71 |
| 3302 W Franklin St | 0.48mi | 3/1.0 (+1) | 960 (+3%) | 2mo | $50,000 | $52 | 66 |
| 23 N Morley St | 0.13mi | 3/1.0 (+1) | 1,041 (+12%) | 6mo | $85,000 | $82 | 64 |
| 3140 Strickland St | 0.59mi | 2/1.0 | 904 (-3%) | 6mo | $103,000 | $114 | 62 |
| 3306 W Franklin St | 0.48mi | 3/2.0 (+1) | 960 (+3%) | 1mo | $51,500 | $54 | 62 |
| 3005 Harlem Ave | 0.69mi | 2/2.0 | 912 (-2%) | 3mo | $50,000 | $55 | 58 |
| 335 N Grantley St | 0.47mi | 2/2.0 | 840 (-10%) | 2mo | $85,000 | $101 | 57 |
| 134 Palormo Ave | 0.27mi | 2/1.5 | 1,050 (+13%) | 8mo | $72,000 | $69 | 57 |
| 3019 Harlem Ave | 0.69mi | 2/2.0 | 912 (-2%) | 7mo | $91,700 | $101 | 55 |
| 2664 W Franklin St | 0.74mi | 3/1.0 (+1) | 1,024 (+10%) | 7mo | $114,900 | $112 | 38 |
| 516 Sunset Rd | 0.70mi | 3/1.5 (+1) | 1,024 (+10%) | 9mo | $169,999 | $166 | 36 |
Match score weights: distance 35% · size 25% · config 20% · recency 20%. Top-matched comps best support the ARV.
Projected returns pro-forma
-3.0% appreciation · 5.38% rent growth · sell at horizon
- IRR
- 79.2%
- Equity multiple
- 4.76×
- Total profit
- $48,066
- Equity at exit
- $6,799
- IRR
- 83.3%
- Equity multiple
- 10.74×
- Total profit
- $124,418
- Equity at exit
- $3,943
Cash invested: $12,768 (down + closing). Projections, not guarantees.
Landlord ↔ Tenant lean methodology
- Overall (CITY)
- 12 Strongly Tenant-Friendly
- State Maryland
- 27 Tenant-Leaning · D+14
- County
- — inherits STATE
- City Baltimore
- 12 Strongly Tenant-Friendly · D+58
ZIP-level market 21229
- Rents YoY
- 5.4%
- Active inventory
- 256
- Price-to-rent
- 2.6×
Monthly cashflow live
- Estimated rent
- $1,487 high interval (Pro) →
- Mortgage (P&I)
- −$239
- Tax from tax record
- −$104 /mo · $1,249/yr
- Insurance
- −$19
- HOA
- −$0
- Vacancy / Maint / Mgmt
- −$312
- Net cashflow
- $813
Break-even live
Sensitivity live
| Price | -10% $838 | -5% $826 | +0% $813 | +5% $800 | +10% $787 |
|---|---|---|---|---|---|
| Rent | -10% $695 | -5% $754 | +0% $813 | +5% $871 | +10% $930 |
| Rate | -1.0pp $836 | -0.5pp $824 | base $813 | +0.5pp $801 | +1.0pp $789 |
UW: 25.0% down · 7.5% · 30yr · 1.5% tax · 5.0% vac · 8.0% maint · 8.0% mgmt
Financing live
Cash to close
- Down payment
- $11,400
- Closing costs
- $1,368
- Reserves months
- —
- Total cash needed
- —
Loan-product check · same deal, 3 products live
Conventional
25% down · 7.5% · 30yr
- Down + closing
- —
- Monthly P&I
- —
- Monthly cashflow
- —
- DSCR
- —
- Eligible?
- —
Personal DTI + credit; lowest rate.
DSCR
20% down · 8.5% · 30yr
- Down + closing
- —
- Monthly P&I
- —
- Monthly cashflow
- —
- DSCR
- —
- Eligible?
- —
No personal income docs; deal must DSCR.
Hard money
10% down · 12.0% · 12mo
- Down + closing
- —
- Monthly P&I
- —
- Monthly cashflow
- —
- DSCR
- —
- Eligible?
- —
Short-term bridge; refi at stabilization.
Rent comps 40 comps
| Address | Beds | Baths | Sqft | Rent | $/sqft | DOM | Units | Dist |
|---|---|---|---|---|---|---|---|---|
| 3310 Elbert St Baltimore, MD | 2.0 | 1.0 | 920 | $1,550 | $1.68 | 25d | 1 | 0.14mi |
| 3607 W Lexington St Baltimore, MD | 3.0 | 2.0 | 1050 | $1,895 | $1.80 | 5d | 1 | 0.44mi |
| 3706 W Franklin St Unit 1 Baltimore, MD | 2.0 | 1.0 | 735 | $1,100 | $1.50 | 5d | 1 | 0.63mi |
| 600 Linnard St Baltimore, MD | 1.0 | 1.0 | 600 | $1,300 | $2.17 | 45d | 1 | 0.66mi |
| 4018 Massachusetts Ave Baltimore, MD | 3.0 | 1.0 | 1050 | $1,400 | $1.33 | 25d | 1 | 0.67mi |
| 709 Denison St Baltimore, MD | 2.0 | 2.0 | 840 | $1,630 | $1.94 | 25d | 1 | 0.68mi |
| 332 S Franklintown Rd Unit 2 Baltimore, MD | 2.0 | 1.0 | 776 | $795 | $1.02 | 25d | 1 | 0.74mi |
| 2516 Hollins St Baltimore, MD | 3.0 | 2.0 | 1100 | $1,700 | $1.55 | 45d | 1 | 0.76mi |
| 304 Collins Ave Unit 1 Baltimore, MD | 1.0 | 1.0 | 845 | $1,600 | $1.89 | 45d | 1 | 0.76mi |
| 304 Collins Ave Unit 2 Baltimore, MD | 3.0 | 1.0 | 1016 | $2,100 | $2.07 | 45d | 1 | 0.76mi |
| 2540 Frederick Ave Baltimore, MD | 3.0 | 1.0 | 1075 | $1,400 | $1.30 | 25d | 1 | 0.79mi |
| 2657 Lehman St Unit 1 Baltimore, MD | 2.0 | 1.0 | 1056 | $1,000 | $0.95 | 45d | 1 | 0.79mi |
| 787 N Grantley St Baltimore, MD | 3.0 | 1.0 | 1116 | $1,575 | $1.41 | 25d | 1 | 0.81mi |
| 4215 Connecticut Ave Baltimore, MD | 1.0 | 1.0 | 625 | $950 | $1.52 | 25d | 1 | 0.84mi |
| 3392 Saint Benedict St Baltimore, MD | 2.0 | 1.0 | 864 | $1,450 | $1.68 | 25d | 1 | 0.85mi |
| 2 S Woodington Rd Baltimore, MD | 2.0 | 1.0 | 856 | $1,160 | $1.36 | 16d | 1 | 0.85mi |
| 2 S Woodington Rd Baltimore, MD | 1.0 | 1.0 | 620 | $1,135 | $1.83 | 5d | 1 | 0.85mi |
| 2 S Woodington Rd Baltimore, MD | 1.0 | 1.0 | 620 | $1,310 | $2.11 | 45d | 1 | 0.85mi |
| 2 N Woodington Rd Baltimore, MD | 1.0–2.0 | 1.0 | 738 | $1,335 | $1.81 | 4d | 5 | 0.86mi |
| 62 N Gorman Ave Baltimore, MD | 3.0 | 2.0 | 1100 | $2,500 | $2.27 | 19d | 1 | 0.94mi |
| 1042 Ellicott Dr Baltimore, MD | 2.0 | 1.0 | 900 | $1,450 | $1.61 | 45d | 1 | 1.00mi |
| 4301 Parkton St Baltimore, MD | 1.0–3.0 | 1.0 | 730 | $1,264 | $1.73 | 45d | 1 | 1.03mi |
| 4520 Scarlet Oak Ln Baltimore, MD | 2.0 | 1.0 | 1025 | $1,500 | $1.46 | 45d | 1 | 1.21mi |
| 4103 Mountwood Rd Baltimore, MD | 3.0 | 2.0 | 1030 | $1,700 | $1.65 | 45d | 1 | 1.23mi |
| 1307 Wildwood Pkwy Baltimore, MD | 2.0 | 1.0 | 725 | $1,295 | $1.79 | 45d | 1 | 1.23mi |
| 4601 Pen Lucy Rd Unit 103-H Baltimore, MD | 2.0 | 1.0 | 798 | $1,315 | $1.65 | 25d | 1 | 1.25mi |
| 4601 Pen Lucy Rd Unit 4714-B Baltimore, MD | 2.0 | 1.0 | 730 | $1,205 | $1.65 | 16d | 1 | 1.25mi |
| 4601 Pen Lucy Rd Unit 4718-F Baltimore, MD | 2.0 | 1.0 | 879 | $1,225 | $1.39 | 3d | 1 | 1.25mi |
| 1216 N Augusta Ave Baltimore, MD | 3.0 | 1.0 | 1024 | $1,550 | $1.51 | 25d | 1 | 1.25mi |
| 4431 Eldone Rd Baltimore, MD | 3.0 | 2.0 | 896 | $2,000 | $2.23 | 25d | 1 | 1.25mi |
| 4601 Pen Lucy Rd Unit 4615-G Baltimore, MD | 2.0 | 1.0 | 798 | $1,200 | $1.50 | 23d | 1 | 1.26mi |
| 1918 W Baltimore St Baltimore, MD | 2.0–3.0 | 1.0–2.0 | 857 | $1,375 | $1.60 | 45d | 1 | 1.27mi |
| 751 Yale Ave Baltimore, MD | 3.0 | 1.5 | 1024 | $1,750 | $1.71 | 45d | 1 | 1.31mi |
| 4103 Stokes Dr Apt 1 Baltimore, MD | 2.0 | 1.0 | 725 | $1,095 | $1.51 | 45d | 1 | 1.32mi |
| 2301 Riggs Ave Baltimore, MD | 3.0 | 2.0 | 1072 | $1,600 | $1.49 | 25d | 1 | 1.35mi |
| 3127 Baker St Baltimore, MD | 3.0 | 1.0 | 1000 | $1,300 | $1.30 | 45d | 1 | 1.35mi |
| 402 Colleen Rd Baltimore, MD | 1.0–2.0 | 1.0 | 910 | $1,450 | $1.59 | 3d | 11 | 1.37mi |
| 219 Atholgate Ln Baltimore, MD | 1.0–3.0 | 1.0–1.5 | 814 | $1,300 | $1.60 | 4d | 2 | 1.37mi |
| 627 Lucia Ave Baltimore, MD | 3.0 | 1.0 | 892 | $1,750 | $1.96 | 25d | 1 | 1.42mi |
| 1712 W Lombard St #4 Baltimore, MD | 1.0 | 1.0 | 550 | $900 | $1.64 | 45d | 1 | 1.44mi |
Listing history 16 events
-
2026-06-21days on market $45,600 Active 53 DOM
-
2026-06-18days on market $45,600 Active 50 DOM
-
2026-06-17days on market $45,600 Active 49 DOM
-
2026-06-16days on market $45,600 Active 48 DOM
-
2026-06-15days on market $45,600 Active 47 DOM
-
2026-06-13days on market $45,600 Active 45 DOM
-
2026-06-09days on market $45,600 Active 41 DOM
-
2026-06-08days on market $45,600 Active 40 DOM
-
2026-06-07days on market $45,600 Active 39 DOM
-
2026-06-04days on market $45,600 Active 36 DOM
-
2026-06-03days on market $45,600 Active 35 DOM
-
2026-06-02days on market $45,600 Active 34 DOM
-
2026-06-01days on market $45,600 Active 33 DOM
-
2026-05-31days on market $45,600 Active 32 DOM
-
2026-04-29$48,000 Active 1013-char remark
-
1982-09-01soldstatus $20,500
ⓘ Source: listings_history table (triggers on properties + properties_extension) + one-shot
backfill from property_details.listing_events for pre-trigger history.
Tax reassessment forecast MD · Partial reset (capped growth)
- Current annual tax
- $1,249 · $104/mo
- Projected year-2 tax
- $1,249 · $104/mo
- Expected delta
- $0/yr ($0/mo · 0.0%)
ⓘ Screening estimate from a state-policy table — verify with the county assessor before closing.
Climate risk First Street
- Flood 1/10 Low FEMA zone X (unshaded) · 0% chance over 30 yrs
- Wildfire 2/10 Low
- Heat 7/10 Severe 7 d/yr ≥103°F today · 15 d/yr by 30 yrs out
- Wind 6/10 Major 27% chance of damaging wind over 30 yrs
- Air quality 3/10 Moderate 3 unhealthy d/yr today · 4 by 30 yrs out
Nearby sold comps map
Loading sold comps map…
Walkable amenities ~0.75 mi
Loading nearby amenities…
Taxation est. · year 1
- Rental income
- $17,846
- − Mortgage interest
- −$2,554
- − Property taxes
- −$1,249
- − Insurance
- −$228
- − Repairs & maintenance
- −$1,428
- − Management
- −$1,428
- − Depreciation
- −$1,327
- Taxable income
- $9,633
- Est. tax owed @ 24.0%
- −$2,312
- After-tax cash flow
- $7,440/yr
For passive investors: Depreciation is non-cash, so a rental often shows a tax loss while cash-flowing — sheltering income. Rental losses are passive: they offset passive income freely, and up to $25,000/yr can offset ordinary (W-2) income if you actively participate and your MAGI is under $100k (phasing out to $0 by $150k); unused losses carry forward. On sale, claimed depreciation is recaptured at up to 25%, and gains may owe capital-gains tax (a 1031 exchange can defer both). Figures are a year-1 estimate at your 24.0% rate — not tax advice; consult a CPA.
Schools (NCES district)
- District
- Baltimore City Public Schools
- NCES district ID
- 2400090
- Math proficiency
- 7% ▼ -9.00%
- Reading proficiency
- 16% ▼ -5.00%
- Median HH income
- $42,108
- Composite
- 10.08/100
- National rank
- #9805
- State rank
- #24 of 24 in MD
Livability — Baltimore
- Score
- 76/100
- State rank
- #90
- US rank
- #3396
Category grades
Schools grade is shown separately in the Schools card above.
Census & demographics
- Census place
- Baltimore, MD
- County
- Baltimore City · 558,601 people
- City population
- 588,727
- Metro
- Baltimore-Columbia-Towson, MD
- Population (ZIP)
- 46,679
- Household income
- $60,047
- Rent vs Own
- Severe rent burden
- 2776.0
Population outlook (Baltimore County) Hauer SSP2
- Today (2025)
- 624,249 people
- By 2030
- 621,541 · -0.4%
- By 2040
- 609,756 · -2.3%
- By 2050
- 597,249 · -4.3%
- By 2075
- 552,236 · -11.5%
- By 2100
- 513,934 · -17.7%
Race, ethnicity, and origin ACS 2023
- Neighborhood character
- Predominantly Black (73%)
- Race & ethnicity
- Black 73% White 15% Hispanic / Latino 6% Two or more races 4% Asian 3%
- Hispanic origin (detail)
- Common ancestry
- Lithuanian 1% Romanian 1% Serbian 1%
- Foreign-born
- 5% · Canada, Philippines
- Languages at home
- 91% English-only · Spanish 4% Other Indo-European 2% Other Asian/Pacific 1%
Political lean MEDSL · Baltimore
- 2024 margin
- Solid D (+73.0) · D 85.2% · R 12.2% · Other 2.6%
- 2008→2024 swing
- -2.5pp toward R · 2008: 75.5pp · 2024: 73.0pp
- All cycles
- 2024: D+73.0 2020: D+76.6 2016: D+74.6 2012: D+76.4 2008: D+75.5
Not yet ingested
- Civics
- —
Market trends
- HPI YoY
- ▼ -259.07%
- Current HPI
- 226.896
- Rent YoY
- ▲ 5.38%
- Metro
- Baltimore-Columbia-Towson, MD
- State GDP YoY
- ▲ 2.97%
- F500 in state
- 12
Industry mix (Fortune 500 HQ in MD)
| Industry | F500 HQs | Revenue |
|---|---|---|
| Aerospace / Defense | 1 | $71B |
|
||
| Utilities | 1 | $25B |
|
||
| Hotels | 1 | $24B |
|
||
| Consumer Goods | 1 | $7B |
|
||
| Real Estate | 1 | $6B |
|
||
| Chemicals | 1 | $2B |
|
||
Price history
+122.4% since first listed3 events — show timeline
- 2026-05-27 Price Changed $45,600 BRIGHT MLS
- 2026-04-29 Listed $48,000 BRIGHT MLS
- 1982-09-01 Sold (Public Records) $20,500 Public Records
Property tax history
-1.5%/yrLatest (2025): $1,249 · +4.2% YoY. Source: county tax records.
Cash-flow waterfall
monthlySold comps — $/sqft
last 12 mo · ≤1 miLoading sold comps…