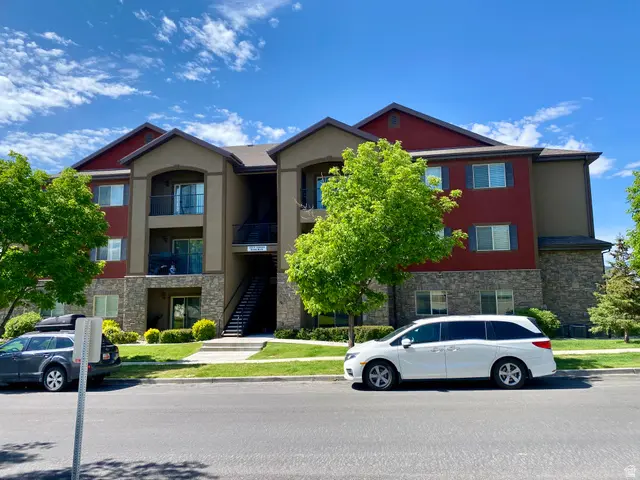
223 E Jordan Ridge Blvd #102 · Saratoga Springs, UT
Flood risk No data
- FEMA flood zone
- —
- Chance of flooding over 30 yrs
- —
- Est. flood insurance / yr
- —
Fire risk No data
- Est. fire insurance / yr
- —
Heat risk No data
- Hot days now (above threshold)
- —
- Hot days in 30 yrs
- —
Wind risk No data
- Chance of severe wind over 30 yrs
- —
Air-quality risk No data
- Unhealthy air days now
- —
- Unhealthy air days in 30 yrs
- —
Risk factors via First Street. Map © Google.
Why this score? — see what drove the D- grade
The composite is a weighted blend of 9 inputs, each scored 0–100. Each bar is that input's sub-score; the figure is the points it added to the 100-point composite (weight × sub-score).
- Appreciation +10.0/10.0
- ARV discount +7.5/15.0
- Cash flow +6.1/30.0
- Schools +4.2/10.0
- Livability +3.5/5.0
- Rent growth +2.7/5.0
- Condition / age +2.5/5.0
- 1% rule +1.3/10.0
- DSCR +0.4/10.0
$315,000
🖨 Deal sheet (PDF) 📄 Offer letter ✓ Due diligence
Listing remarks MLS
There are no remarks available.
Key facts
- New furnace
- Brand new appliances
- New water heater
Tags
Property features AI
Finance
- Other: Subdivision: Jordan Ridge Condominium
- HOA & community: Homeowners association with a $250 monthly fee; HOA covers insurance, grounds maintenance, trash, and water; Community amenities include barbecue area, playground, and snow removal
Exterior
- Parking: Two-car garage plus two additional covered parking spaces (4 total); Covered parking
- Utilities: Natural gas connected; Electricity connected; Water (culinary) connected; Sewer connected
- Home design: Condo, main-level layout; Building is built and standing
- Construction: Stucco construction; Asphalt roof
- Exterior features: Asphalt roof; North-facing; Lot approximately 0.03 acres; Multi-family zoning; Stucco exterior
Interior
- Kitchen: Microwave; Refrigerator
- Bedrooms: Three bedrooms on the main level
- Bathrooms: Two full bathrooms
- Heating & cooling: Gas central heating; Central air conditioning
- Interior features: Blinds; Ceiling fan
- Laundry & utility: Electric dryer hookup
Neighborhood map
What this means for you Summary
Snapshot
- This is a 3-bed/2.0-bath condo listed at $315k.
Deal economics
- At list price, monthly cash flow is $-591 ($-7k/yr) — negative.
- To cash-flow at today's rent, offer at most $211k (33.1% below list).
- To meet the 1% rule (rent ≥ 1% of price), the offer needs to be $197k (37.5% below list).
- Recommended offer: $197k (37.5% below list) — sets the bar for 1% rule.
Location & tenants
- Location reads 70/100 on livability (#93 in UT) — a middle-class / working-renter tenant base. Strengths: crime A+, employment A+, housing A+; Watch: amenities F, commute F, cost of living F.
- Alpine District (suburban): math 45% / reading 50% proficiency, ranked #25 of 80 in UT (top 31%) — families likely to look elsewhere, expect single-tenant / working-renter base with shorter leases; only 18% free/reduced lunch — higher-income household profile.
- Zoned schools: Riverview School (math 56% / reading 55%, grade C, #93 of 585 statewide, top 17%, 977 students, 16% FRL); Vista Heights Middle (math 50% / reading 51%, grade D+, #25 of 171 statewide, top 15%, 1,519 students, 16% FRL); Westlake High (math 39% / reading 48%, grade F, #50 of 171 statewide, top 29%, 2,659 students, 12% FRL) — zoned schools at 15% FRL track the district average.
- Market conditions: Rents flat; 1185 active listings in the ZIP; 26 comparable units currently listed for rent nearby; rentals at typical pace (median 16d on market — plan ~3-4 weeks tenant-placement turnaround); high-income renter base; 6,326 units permitted in Utah County in 2024 (1,053 in 5+ unit buildings).
Forward outlook
- In year one you build about $34k of equity ($2k loan paydown + $32k appreciation (10.0% local appreciation)).
- Utah County population projected at +49% by 2050 — long-run rental-demand tailwind backs the buy-and-hold thesis.
- By year 2, paydown + projected appreciation supports a ~$54k cash-out refi (75% LTV) — recoverable capital for the next deal without selling this one.
Negotiation context
- Only 10 days on market — expect competitive offers; lowballing is unlikely to land.
- 3 sale attempts since 13y ago with the ask held roughly flat each time — persistent listings suggest the price (not the market) is what's stuck; bring a comps-based counter.
Questions for the listing agent
- What do current leases actually rent for vs. the listed asking? Can we see a recent rent roll and the last 12 months of T-12 income?
- What does the HOA fee cover, when was the last increase, and are there any pending special assessments or reserve-fund shortfalls?
- Any open or pending special assessments — roof, HVAC, plumbing, elevator, façade? What's the per-unit balance and payoff schedule, and is the seller paying it off at close or rolling it to the buyer?
- Is there a deadline driving the sale (1031 exchange, divorce, estate, relocation)? That informs how much negotiation room exists.
- Schools are B-rated — typically a magnet for longer-tenancy family renters. What's the average tenant stay here, and is there a school-zone premium baked into asking?
- The area grade is low — what's the realistic commute time and amenity access for the typical tenant pool here? Any planned neighborhood developments (good or bad) we should know about?
- What's the average days-on-market for RENTAL listings here right now (not sales)? A rising rental-DOM trend means longer vacancies and softer asking-rent achievability than the comps imply.
- What's the recent tenant-quality profile in this submarket — average credit score on applications, eviction rate, late-payment / NSF rate, and stable-employment percentage? A property-management company in the area should have these aggregated.
- How much new apartment / multifamily construction is in the pipeline within 1–3 miles? Heavy new supply (>2% of stock underway) typically softens rents 12–24 months out; light construction supports rent growth.
Investment metrics
- 1% rule
- 0.63% ✗
- Cap rate
- 4.04%
- Cash-on-cash
- -8.04%
- DSCR
- 0.64
- GRM
- 13.3
CMA / ARV
No comps found within radius.
Projected returns pro-forma
10.0% appreciation · 0.68% rent growth · sell at horizon
- IRR
- 18.1%
- Equity multiple
- 2.47×
- Total profit
- $129,446
- Equity at exit
- $283,777
- IRR
- 16.5%
- Equity multiple
- 5.56×
- Total profit
- $402,529
- Equity at exit
- $611,976
Cash invested: $88,200 (down + closing). Projections, not guarantees.
Landlord ↔ Tenant lean methodology
- Overall (STATE)
- 86 Strongly Landlord-Friendly
- State Utah
- 86 Strongly Landlord-Friendly · R+15
- County
- — inherits STATE
- City
- — inherits STATE
ZIP-level market 84045
- Home prices YoY
- 3.9%
- Rents YoY
- 0.7%
- Active inventory
- 1185
- Price-to-rent
- 13.3×
Monthly cashflow live
- Estimated rent
- $1,970 high interval (Pro) →
- Mortgage (P&I)
- −$1,652
- Tax from tax record
- −$114 /mo · $1,364/yr
- Insurance
- −$131
- HOA
- −$250
- Vacancy / Maint / Mgmt
- −$414
- Net cashflow
- $-591
Break-even live
Sensitivity live
| Price | -10% $-412 | -5% $-502 | +0% $-591 | +5% $-680 | +10% $-769 |
|---|---|---|---|---|---|
| Rent | -10% $-746 | -5% $-669 | +0% $-591 | +5% $-513 | +10% $-435 |
| Rate | -1.0pp $-432 | -0.5pp $-511 | base $-591 | +0.5pp $-672 | +1.0pp $-755 |
UW: 25.0% down · 7.5% · 30yr · 1.5% tax · 5.0% vac · 8.0% maint · 8.0% mgmt
Financing live
Cash to close
- Down payment
- $78,750
- Closing costs
- $9,450
- Reserves months
- —
- Total cash needed
- —
Loan-product check · same deal, 3 products live
Conventional
25% down · 7.5% · 30yr
- Down + closing
- —
- Monthly P&I
- —
- Monthly cashflow
- —
- DSCR
- —
- Eligible?
- —
Personal DTI + credit; lowest rate.
DSCR
20% down · 8.5% · 30yr
- Down + closing
- —
- Monthly P&I
- —
- Monthly cashflow
- —
- DSCR
- —
- Eligible?
- —
No personal income docs; deal must DSCR.
Hard money
10% down · 12.0% · 12mo
- Down + closing
- —
- Monthly P&I
- —
- Monthly cashflow
- —
- DSCR
- —
- Eligible?
- —
Short-term bridge; refi at stabilization.
Rent comps 26 comps
| Address | Beds | Baths | Sqft | Rent | $/sqft | DOM | Units | Dist |
|---|---|---|---|---|---|---|---|---|
| 157 E Jordan Ridge Blvd #311 Saratoga Springs, UT | 3.0 | 2.0 | 1255 | $1,650 | $1.31 | 20d | 1 | 0.10mi |
| 1256 Commerce Dr Saratoga Springs, UT | 1.0–3.0 | 1.0–2.0 | 1147 | $1,759 | $1.53 | 4d | 15 | 0.10mi |
| 127 Jordan Ridge Blvd Saratoga Springs, UT | 3.0 | 2.0 | 1278 | $1,595 | $1.25 | 4d | 1 | 0.13mi |
| 1532 N Rosa Ln Saratoga Springs, UT | 3.0 | 2.5 | 1367 | $2,234 | $1.63 | 25d | 1 | 0.45mi |
| 3761 W 620 N Lehi, UT | 3.0 | 2.0 | 1383 | $2,295 | $1.66 | 15d | 1 | 0.75mi |
| 830 N Canvasback Dr Lehi, UT | 3.0 | 2.0 | 1311 | $1,950 | $1.49 | 22d | 1 | 0.92mi |
| 241 W Ridge Rd Saratoga Springs, UT | 3.0 | 2.0 | 1196 | $1,650 | $1.38 | 4d | 1 | 0.98mi |
| 79 W Ridge Rd Saratoga Springs, UT | 3.0 | 2.0 | 1200 | $1,550 | $1.29 | 4d | 1 | 0.99mi |
| 848 N Old Ranch Rd Unit 1 Lehi, UT | 3.0 | 2.0 | 1400 | $2,250 | $1.61 | 4d | 1 | 1.00mi |
| 1823 N Crest Rd Saratoga Springs, UT | 3.0 | 2.0 | 1264 | $1,650 | $1.31 | 25d | 1 | 1.03mi |
| 902 N Old Ranch Rd Lehi, UT | 3.0 | 2.0 | 1400 | $2,100 | $1.50 | 25d | 1 | 1.04mi |
| 1093 3980 W Lehi, UT | 3.0 | 2.0 | 1272 | $1,625 | $1.28 | 4d | 1 | 1.17mi |
| 251 N Riverside Dr Saratoga Springs, UT | 4.0 | 2.5 | 1587 | $2,250 | $1.42 | 15d | 1 | 1.19mi |
| 3757 Big Horn Dr Unit 1 Lehi, UT | 3.0 | 2.5 | 1600 | $2,300 | $1.44 | 15d | 1 | 1.28mi |
| 2153 Springtime Dr Unit Bedroom 1 Master Saratoga Springs, UT | 3.0 | 2.0 | 1375 | $900 | $0.65 | 15d | 1 | 1.34mi |
| 157 W Springview Dr Unit 1 Saratoga Springs, UT | 3.0 | 2.0 | 1250 | $1,625 | $1.30 | 25d | 1 | 1.35mi |
| 1342 N 3650 W Unit W303 Eagle Mountain, UT | 3.0 | 2.0 | 1300 | $1,550 | $1.19 | 4d | 1 | 1.37mi |
| 1423 N 3830 W Unit B204 Lehi, UT | 3.0 | 2.0 | 1272 | $1,950 | $1.53 | 4d | 1 | 1.43mi |
| 1424 N 3830 W Lehi, UT | 3.0 | 2.0 | 1272 | $1,850 | $1.45 | 15d | 1 | 1.43mi |
| 3722 W 1440 N Unit F202 Eagle Mountain, UT | 3.0 | 2.0 | 1336 | $1,495 | $1.12 | 25d | 1 | 1.44mi |
| 1451 N 3830 W #204 Lehi, UT | 3.0 | 2.0 | 1272 | $1,895 | $1.49 | 25d | 1 | 1.46mi |
| 68 S Willow Circle Loop Unit B Lehi, UT | 3.0 | 2.0 | 1285 | $1,625 | $1.26 | 25d | 1 | 1.47mi |
| 28 S Willow Circle Loop Lehi, UT | 3.0 | 2.0 | 1285 | $1,550 | $1.21 | 25d | 2 | 1.47mi |
| 967 E Drifter Ln Saratoga Springs, UT | 3.0 | 2.0 | 1399 | $2,200 | $1.57 | 15d | 1 | 1.47mi |
| 982 E Drifter Ln Saratoga Springs, UT | 3.0 | 3.0 | 1508 | $2,250 | $1.49 | 25d | 1 | 1.48mi |
| 3637 W 1480 N Eagle Mountain, UT | 3.0 | 2.0 | 1228 | $1,899 | $1.55 | 15d | 1 | 1.49mi |
HOA detail condo
- Monthly dues
- $250 · $3,000/yr
- Assessments
- None detected in remarks — confirm with the listing agent.
Listing history 11 events
-
2026-06-07statusdays on market $315,000 Under Contract 10 DOM
-
2026-06-03days on market $315,000 Active 8 DOM
-
2026-06-03days on market $315,000 Active 7 DOM
-
2026-06-01days on market $315,000 Active 6 DOM
-
2026-05-31days on market $315,000 Active 5 DOM
-
2026-05-31days on market $315,000 Active 4 DOM
-
2026-05-26$315,000 Active
-
2015-02-24soldstatus 31-char remark
Show marketing remark (31 chars)
There are no remarks available.
-
2014-12-17$159,900 31-char remark
Show marketing remark (31 chars)
There are no remarks available.
-
2014-05-04historical
-
2013-11-04$159,900
ⓘ Source: listings_history table (triggers on properties + properties_extension) + one-shot
backfill from property_details.listing_events for pre-trigger history.
Tax reassessment forecast UT · Resets to sale price
- Current annual tax
- $1,364 · $114/mo
- Projected year-2 tax
- $2,079 · $173/mo
- Expected delta
- +$715/yr (+$60/mo · 52.4%)
ⓘ Screening estimate from a state-policy table — verify with the county assessor before closing.
Nearby sold comps map
Loading sold comps map…
Walkable amenities ~0.75 mi
Loading nearby amenities…
Taxation est. · year 1
- Rental income
- $23,636
- − Mortgage interest
- −$17,645
- − Property taxes
- −$1,364
- − Insurance
- −$1,575
- − Repairs & maintenance
- −$1,891
- − Management
- −$1,891
- − HOA
- −$3,000
- − Depreciation
- −$9,164
- Taxable loss
- −$12,894
- Est. tax savings @ 24.0%
- +$3,094
- After-tax cash flow
- $-3,995/yr
For passive investors: Depreciation is non-cash, so a rental often shows a tax loss while cash-flowing — sheltering income. Rental losses are passive: they offset passive income freely, and up to $25,000/yr can offset ordinary (W-2) income if you actively participate and your MAGI is under $100k (phasing out to $0 by $150k); unused losses carry forward. On sale, claimed depreciation is recaptured at up to 25%, and gains may owe capital-gains tax (a 1031 exchange can defer both). Figures are a year-1 estimate at your 24.0% rate — not tax advice; consult a CPA.
Schools (NCES district)
- District
- Alpine District
- NCES district ID
- 4900030
- Math proficiency
- 45% ▼ -4.00%
- Reading proficiency
- 50% ▼ -2.00%
- Median HH income
- $68,595
- Composite
- 42.48/100
- National rank
- #3213
- State rank
- #25 of 80 in UT
Livability — Saratoga Springs
- Score
- 70/100
- State rank
- #93
- US rank
- #7648
Category grades
Schools grade is shown separately in the Schools card above.
Census & demographics
- Census place
- Saratoga Springs, UT
- County
- Utah County · 661,754 people
- City population
- 45,429
- Metro
- Provo-Orem, UT
- Population (ZIP)
- 45,429
- Household income
- $130,331
- Rent vs Own
- Severe rent burden
- 476.0
Population outlook (Utah County) Hauer SSP2
- Today (2025)
- 693,420 people
- By 2030
- 757,324 · +9.2%
- By 2040
- 893,178 · +28.8%
- By 2050
- 1,035,842 · +49.4%
- By 2075
- 1,376,733 · +98.5%
- By 2100
- 1,609,388 · +132.1%
Race, ethnicity, and origin ACS 2023
- Neighborhood character
- Predominantly White (83%)
- Race & ethnicity
- White 83% Hispanic / Latino 12% Two or more races 9% Asian 1%
- Hispanic origin (detail)
- Mexican 6%
- Common ancestry
- Italian 7% Scottish 4% Slovak 4%
- Foreign-born
- 6% · Canada, Jamaica
- Languages at home
- 88% English-only · Spanish 9% Other Indo-European 1% Chinese 1%
Political lean MEDSL · Utah
- 2024 margin
- Solid R (+39.8) · D 28.5% · R 68.3% · Other 3.2%
- 2008→2024 swing
- +19.1pp toward D · 2008: -58.9pp · 2024: -39.8pp
- All cycles
- 2024: R+39.8 2020: R+41.0 2016: R+37.3 2012: R+78.5 2008: R+58.9
Not yet ingested
- Civics
- —
Market trends
- HPI YoY
- ▲ 11.09%
- Current HPI
- 298.0545
- Rent YoY
- ▲ 0.68%
- Metro
- Provo-Orem, UT
- State GDP YoY
- ▲ 3.54%
- F500 in state
- 2
Industry mix (Fortune 500 HQ in UT)
| Industry | F500 HQs | Revenue |
|---|---|---|
| Financial Services | 1 | $3B |
|
||
Price history
+97.0% since first listed5 events — show timeline
- 2026-05-26 Listed $315,000 WFRMLS
- 2015-02-24 Sold (MLS) — WFRMLS
- 2014-12-17 Listed $159,900 WFRMLS
- 2014-05-04 Listing Removed — WFRMLS
- 2013-11-04 Listed $159,900 WFRMLS
Property tax history
+4.8%/yrLatest (2025): $1,364 · -1.4% YoY. Source: county tax records.
Cash-flow waterfall
monthlySold comps — $/sqft
last 12 mo · ≤1 miLoading sold comps…