5505 S Grove St #14 · Rocklin, CA
Flood risk 1/10 · Minimal
- FEMA flood zone
- X (unshaded)
- Chance of flooding over 30 yrs
- 0.0%
- Est. flood insurance / yr
- $507 – $1,088
Fire risk 8/10 · Major
- Est. fire insurance / yr
- $659 – $1,223
Heat risk 7/10 · Major
- Hot days now (above 104°F)
- 7 days/yr
- Hot days in 30 yrs
- 16 days/yr
Wind risk 1/10 · Minimal
- Chance of severe wind over 30 yrs
- —
Air-quality risk 10/10 · Severe
- Unhealthy air days now
- 32 days/yr
- Unhealthy air days in 30 yrs
- 38 days/yr
Risk factors via First Street. Map © Google.
Why this score? — see what drove the B grade
The composite is a weighted blend of 9 inputs, each scored 0–100. Each bar is that input's sub-score; the figure is the points it added to the 100-point composite (weight × sub-score).
- Cash flow +30.0/30.0
- 1% rule +10.0/10.0
- DSCR +10.0/10.0
- ARV discount +7.5/15.0
- Schools +5.0/10.0
- Livability +3.7/5.0
- Rent growth +3.2/5.0
- Condition / age +2.5/5.0
- Appreciation +0.0/10.0
$139,900
🖨 Deal sheet 📄 Offer letter ✓ Due diligence
Listing remarks
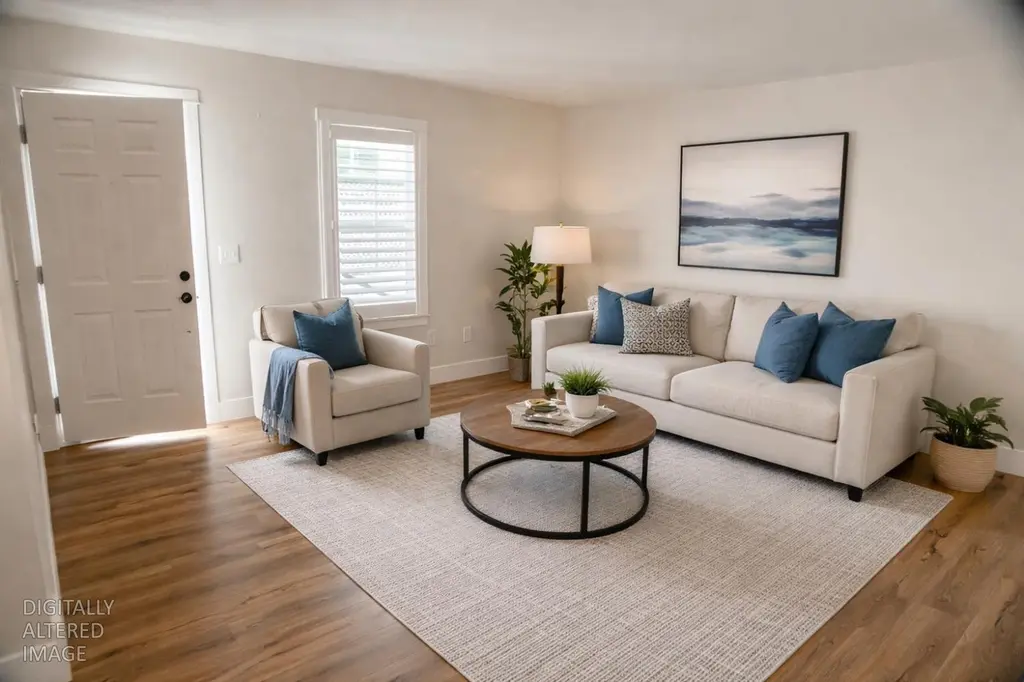
Adorable, affordable home with stunning landscaped, private backyard. Space 14 is a perimeter lot with an amazing, terraced backyard retreat, a bountiful citrus tree and quite areas to enjoy outdoor relaxation. Fully, private vinal fenced to give your pets lots of room to move around outdoors. New Central Air, 2022. New Roof 2023, New Vinal 4'fences 2023, Two New side one on each side Awnings 2024. Easy stroll to the pool, park office or recreation room. Enjoy easy living with nearby Rocklin shopping and restaurants. Just a few miles from I-80 access. This home is located in one of Rocklin's most desired 55+ communities, come check it out!
Key facts
- Private vinal fenced
- Easy stroll to pool
- Parking
Tags
Neighborhood map
What this means for you Summary
Snapshot
- This is a 2-bed/1.0-bath manufactured listed at $140k.
Deal economics
- At list price, monthly cash flow is $749 ($9k/yr) — positive.
- The deal already cash-flows at list — no discount required.
- Meets the 1% rule at list price ($2k rent vs $140k).
- Recommended offer: $132k (6.0% below list) — sets the bar for market timing.
- Cap rate 12.7% vs local median 2.7% in Rocklin — top-decile yield for the area; either an underpriced asset or a hidden risk that comps aren't pricing in. Stress-test before assuming the spread holds.
Location & tenants
- Location reads 74/100 on livability (#136 in CA, #4,755 nationally) — a middle-class / working-renter tenant base. Strengths: schools A+, employment A+, housing A+; Watch: commute D+, amenities F, cost of living F.
- Rocklin Unified (suburban): math 44% / reading 65% proficiency, ranked #96 of 517 in CA (top 19%) — acceptable for families but not a draw, mixed tenant base, ~2y average lease; only 14% free/reduced lunch — higher-income household profile.
- Market conditions: Rents rising (+2.9%/yr); 159 active listings in the ZIP; 15 comparable units currently listed for rent nearby; rentals leasing fast (median 8d on market — plan ~1-2 weeks tenant-placement turnaround); solid renter incomes; 3,535 units permitted in Placer County in 2024 (689 in 5+ unit buildings).
Forward outlook
- Local home prices are declining (-3.0%/yr); year-one equity from $967 of loan paydown is wiped out by about $4k of value loss. Plan a longer hold.
- Placer County population projected at +20% by 2050 — long-run rental-demand tailwind backs the buy-and-hold thesis.
- At projected returns (-3.0% appreciation + 2.9% rent growth), your $39k cash investment doubles in ~6 years — after that, you're playing with house money.
Negotiation context
- It's been on market 70 days — a 6% lower offer ($132k) is reasonable based on typical stale-listing flexibility.
Risks & watch-outs
- Climate carrying-cost: severe wildfire risk; extreme-heat days projected 7→16/yr by 2055 (HVAC capex compounding) — expect insurance premiums to compound above CPI over the hold.
Questions for the listing agent
- It's been on market 70 days. Have you received any prior offers? Is the seller open to a 6% concession, seller financing, or rate buy-down credit?
- Why hasn't it sold? Are there any deal-killer items the seller is aware of (foundation, flood, title, zoning, code violations)?
- Is there a deadline driving the sale (1031 exchange, divorce, estate, relocation)? That informs how much negotiation room exists.
- Schools are A-rated — typically a magnet for longer-tenancy family renters. What's the average tenant stay here, and is there a school-zone premium baked into asking?
- What's the average days-on-market for RENTAL listings here right now (not sales)? A rising rental-DOM trend means longer vacancies and softer asking-rent achievability than the comps imply.
- What's the recent tenant-quality profile in this submarket — average credit score on applications, eviction rate, late-payment / NSF rate, and stable-employment percentage? A property-management company in the area should have these aggregated.
- How much new for-sale + rental construction is in the pipeline within 1–3 miles? Heavy new supply typically softens prices + rents 12–24 months out; constrained supply supports both.
Investment metrics
- 1% rule
- 1.55% ✓
- Cap rate
- 12.71%
- Cash-on-cash
- 22.93%
- DSCR
- 2.02
- GRM
- 5.4
CMA / ARV
- ARV (median comp)
- $80,000
- List price
- $139,900
- Delta
- 74.88%
- Verdict
- OVERPRICED
- Comps
- 2 within 1.0 mi
Show comp detail 2 sales within ~0.75 mi
| Address | Dist | Beds/Ba | Sqft | Sold | Price | $/sf | Match |
|---|---|---|---|---|---|---|---|
| 4305 Fernwood St #44 | 0.27mi | 2/1.0 | 960 (+13%) | 3mo | $75,000 | $78 | 63 |
| 4168 Lakeside Dr | 0.11mi | 2/2.0 | 804 (-5%) | 23mo | $85,000 | $106 | 63 |
Match score weights: distance 35% · size 25% · config 20% · recency 20%. Top-matched comps best support the ARV.
Projected returns pro-forma
-3.0% appreciation · 2.93% rent growth · sell at horizon
- IRR
- 15.8%
- Equity multiple
- 1.64×
- Total profit
- $24,893
- Equity at exit
- $20,860
- IRR
- 24.4%
- Equity multiple
- 3.11×
- Total profit
- $82,583
- Equity at exit
- $12,096
Cash invested: $39,172 (down + closing). Projections, not guarantees.
Landlord ↔ Tenant lean methodology
- Overall (STATE)
- 18 Strongly Tenant-Friendly
- State California
- 18 Strongly Tenant-Friendly · D+13
- County
- — inherits STATE
- City
- — inherits STATE
ZIP-level market 95677
- Rents YoY
- 2.9%
- Active inventory
- 159
- Price-to-rent
- 5.4×
Monthly cashflow live
- Estimated rent
- $2,172 high interval (Pro) →
- Mortgage (P&I)
- −$734
- Tax est. 1.5%
- −$175 /mo · $2,098/yr
- Insurance
- −$58
- HOA
- −$0
- Vacancy / Maint / Mgmt
- −$456
- Net cashflow
- $749
Break-even live
UW: 25.0% down · 7.5% · 30yr · 1.5% tax · 5.0% vac · 8.0% maint · 8.0% mgmt
Financing live
Cash to close
- Down payment
- $34,975
- Closing costs
- $4,197
- Reserves months
- —
- Total cash needed
- —
Loan-product check · same deal, 3 products live
Conventional
25% down · 7.5% · 30yr
- Down + closing
- —
- Monthly P&I
- —
- Monthly cashflow
- —
- DSCR
- —
- Eligible?
- —
Personal DTI + credit; lowest rate.
DSCR
20% down · 8.5% · 30yr
- Down + closing
- —
- Monthly P&I
- —
- Monthly cashflow
- —
- DSCR
- —
- Eligible?
- —
No personal income docs; deal must DSCR.
Hard money
10% down · 12.0% · 12mo
- Down + closing
- —
- Monthly P&I
- —
- Monthly cashflow
- —
- DSCR
- —
- Eligible?
- —
Short-term bridge; refi at stabilization.
Rent comps 15 comps
| Address | Beds | Baths | Sqft | Rent | $/sqft | DOM | Units | Dist |
|---|---|---|---|---|---|---|---|---|
| 5415 S Grove St Rocklin, CA | 1.0–2.0 | 1.0 | 765 | $2,100 | $2.75 | 2d | 6 | 0.08mi |
| 5800 Woodside Dr Rocklin, CA | 1.0–2.0 | 1.0–2.0 | 850 | $2,239 | $2.63 | 3d | 4 | 0.42mi |
| 5457 5th St Rocklin, CA | 3.0 | 1.0 | 640 | $1,845 | $2.88 | 7d | 1 | 0.77mi |
| 4760 3rd St Unit B, Rocklin, CA 95677 Rocklin, CA | 1.0 | 1.0 | 650 | $1,750 | $2.69 | 22d | 1 | 0.90mi |
| 6250 Westwood Dr Rocklin, CA | 2.0 | 1.0 | 827 | $1,995 | $2.41 | 23d | 1 | 1.01mi |
| 6260 Westwood Dr Rocklin, CA | 2.0 | 1.0 | 827 | $1,995 | $2.41 | 22d | 1 | 1.02mi |
| 6260 Westwood Dr Rocklin, CA | 2.0 | 1.0 | 828 | $1,995 | $2.41 | 12d | 1 | 1.02mi |
| 3041 Twin Creeks Ln Rocklin, CA | 3.0 | 2.0 | 986 | $2,695 | $2.73 | 23d | 1 | 1.27mi |
| 5902 Springview Dr Rocklin, CA | 2.0 | 2.0 | 840 | $2,099 | $2.50 | 14d | 1 | 1.28mi |
| 5902 Springview Dr Rocklin, CA | 2.0 | 2.0 | 840 | $2,199 | $2.62 | 23d | 1 | 1.28mi |
| 5051 El Don Dr Rocklin, CA | 2.0 | 2.0 | 1125 | $2,270 | $2.02 | 2d | 7 | 1.31mi |
| 1501 Cobble Creek Cir Rocklin, CA | 1.0–2.0 | 1.0–2.0 | 881 | $2,300 | $2.61 | 2d | 7 | 1.32mi |
| 5953 Springview Dr Rocklin, CA | 2.0 | 1.5–2.0 | 840 | $2,083 | $2.48 | 3d | 6 | 1.35mi |
| 6115 Brookside Cir Rocklin, CA | 2.0 | 3.0 | 1102 | $2,706 | $2.46 | 4d | 1 | 1.42mi |
| 5180 Rocklin Rd Rocklin, CA | 1.0–2.0 | 1.0–2.0 | 857 | $2,552 | $2.98 | 2d | 9 | 1.44mi |
Listing history 14 events
-
2026-06-18days on market $139,900 Active 70 DOM
-
2026-06-17days on market $139,900 Active 69 DOM
-
2026-06-16days on market $139,900 Active 68 DOM
-
2026-06-15days on market $139,900 Active 67 DOM
-
2026-06-13days on market $139,900 Active 65 DOM
-
2026-06-13days on market $139,900 Active 64 DOM
-
2026-06-09days on market $139,900 Active 61 DOM
-
2026-06-08days on market $139,900 Active 60 DOM
-
2026-06-07days on market $139,900 Active 59 DOM
-
2026-06-05days on market $139,900 Active 56 DOM
-
2026-06-03days on market $139,900 Active 55 DOM
-
2026-06-02days on market $139,900 Active 54 DOM
-
2026-06-01days on market $139,900 Active 53 DOM
-
2026-05-31days on market $139,900 Active 52 DOM
ⓘ Source: listings_history table (triggers on properties + properties_extension) + one-shot
backfill from property_details.listing_events for pre-trigger history.
Climate risk First Street
- Flood 1/10 Low FEMA zone X (unshaded) · 0% chance over 30 yrs
- Wildfire 8/10 Severe
- Heat 7/10 Severe 7 d/yr ≥104°F today · 16 d/yr by 30 yrs out
- Wind 1/10 Low
- Air quality 10/10 Extreme 32 unhealthy d/yr today · 38 by 30 yrs out
Nearby sold comps map
Loading sold comps map…
Walkable amenities ~0.75 mi
Loading nearby amenities…
Taxation est. · year 1
- Rental income
- $26,058
- − Mortgage interest
- −$7,837
- − Property taxes
- −$2,098
- − Insurance
- −$700
- − Repairs & maintenance
- −$2,085
- − Management
- −$2,085
- − Depreciation
- −$4,070
- Taxable income
- $7,184
- Est. tax owed @ 24.0%
- −$1,724
- After-tax cash flow
- $7,260/yr
For passive investors: Depreciation is non-cash, so a rental often shows a tax loss while cash-flowing — sheltering income. Rental losses are passive: they offset passive income freely, and up to $25,000/yr can offset ordinary (W-2) income if you actively participate and your MAGI is under $100k (phasing out to $0 by $150k); unused losses carry forward. On sale, claimed depreciation is recaptured at up to 25%, and gains may owe capital-gains tax (a 1031 exchange can defer both). Figures are a year-1 estimate at your 24.0% rate — not tax advice; consult a CPA.
Schools (NCES district)
- District
- Rocklin Unified
- NCES district ID
- 0600013
- Math proficiency
- 44% ▼ -19.00%
- Reading proficiency
- 65% ▼ -6.00%
- Median HH income
- $82,858
- Composite
- 49.58/100
- National rank
- #1984
- State rank
- #96 of 517 in CA
Livability — Rocklin
- Score
- 74/100
- State rank
- #136
- US rank
- #4755
Category grades
Schools grade is shown separately in the Schools card above.
Census & demographics
- Census place
- Rocklin, CA
- County
- Placer County · 390,510 people
- City population
- 73,077
- Metro
- Sacramento-Roseville-Folsom, CA
- Population (ZIP)
- 29,206
- Household income
- $105,713
- Rent vs Own
- Severe rent burden
- 1107.0
Population outlook (Placer County) Hauer SSP2
- Today (2025)
- 422,709 people
- By 2030
- 444,249 · +5.1%
- By 2040
- 480,192 · +13.6%
- By 2050
- 506,390 · +19.8%
- By 2075
- 550,219 · +30.2%
- By 2100
- 547,760 · +29.6%
Race, ethnicity, and origin ACS 2023
- Neighborhood character
- Predominantly White (67%)
- Race & ethnicity
- White 67% Hispanic / Latino 15% Two or more races 15% Asian 7% Black 1%
- Hispanic origin (detail)
- Mexican 10%
- Common ancestry
- Italian 3% Slovak 3% Lithuanian 2%
- Foreign-born
- 10% · Canada, China, South Korea
- Languages at home
- 86% English-only · Spanish 5% Other Indo-European 2% Russian/Polish/Slavic 2%
Political lean MEDSL · Placer
- 2024 margin
- Lean R (+8.5) · D 44.3% · R 52.8% · Other 2.9%
- 2008→2024 swing
- +2.8pp toward D · 2008: -11.3pp · 2024: -8.5pp
- All cycles
- 2024: R+8.5 2020: R+6.7 2016: R+11.3 2012: R+20.1 2008: R+11.3
Not yet ingested
- Civics
- —
Market trends
- HPI YoY
- ▼ -443.08%
- Current HPI
- 278.1359
- Rent YoY
- ▲ 2.93%
- Metro
- Sacramento-Roseville-Folsom, CA
- State GDP YoY
- ▲ 3.21%
- F500 in state
- 116
Industry mix (Fortune 500 HQ in CA)
| Industry | F500 HQs | Revenue |
|---|---|---|
| Technology | 27 | $1,492B |
|
||
| Financial Services | 3 | $174B |
|
||
| Retail | 3 | $44B |
|
||
| Insurance | 3 | $26B |
|
||
| Media / Entertainment | 2 | $115B |
|
||
| Pharmaceuticals / Biotech | 2 | $62B |
|
||
Cash-flow waterfall
monthlySold comps — $/sqft
last 12 mo · ≤1 miLoading sold comps…