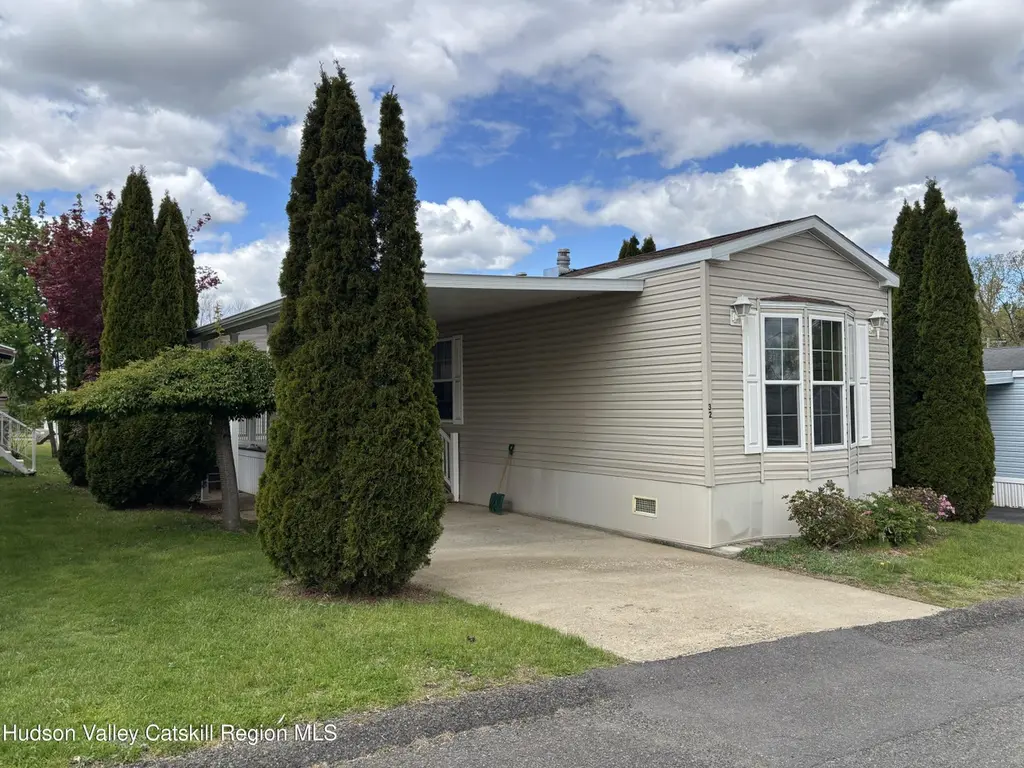
3459 Route 9 #32 · Claverack-Red Mills, NY
Flood risk No data
- FEMA flood zone
- —
- Chance of flooding over 30 yrs
- —
- Est. flood insurance / yr
- —
Fire risk No data
- Est. fire insurance / yr
- —
Heat risk No data
- Hot days now (above threshold)
- —
- Hot days in 30 yrs
- —
Wind risk No data
- Chance of severe wind over 30 yrs
- —
Air-quality risk No data
- Unhealthy air days now
- —
- Unhealthy air days in 30 yrs
- —
Risk factors via First Street. Map © Google.
Why this score? — see what drove the B+ grade
The composite is a weighted blend of 9 inputs, each scored 0–100. Each bar is that input's sub-score; the figure is the points it added to the 100-point composite (weight × sub-score).
- Cash flow +30.0/30.0
- 1% rule +10.0/10.0
- DSCR +10.0/10.0
- Appreciation +10.0/10.0
- Rent growth +5.0/5.0
- Condition / age +3.8/5.0
- Schools +3.6/10.0
- Livability +2.5/5.0
- ARV discount +1.1/15.0
$85,000
🖨 Deal sheet (PDF) 📄 Offer letter ✓ Due diligence
Listing remarks
Welcome to easy living at The Community at Bells Pond, a quiet and well-maintained 55+ community. Located on Lot 32, this 2011 Champion mobile home offers comfortable single-level living with a bright and open layout. This 70' x 14' home features 2 bedrooms and 2 full bathrooms, including a spacious primary bedroom with its own private bath. The open floor plan creates a comfortable flow between the kitchen, dining, and living areas, making the space feel welcoming and functional. Enjoy relaxing outdoors on the covered porch, perfect for morning coffee or quiet evenings. The property also includes a storage shed for tools, seasonal items, or additional storage needs. Monthly lot rent is 362
Key facts
- Covered porch
- Open floor plan
- Single level living
Tags
Property features AI
Finance
- Other: Property is residential, listed as a mobile home
- Financial info: Financial details not provided
- HOA & community: HOA/community information not specified
Exterior
- Parking: Attached carport
- Security: Security information not specified
- Utilities: Public water; Public sewer
- Home design: Manufactured house (mobile home); Single-wide body type; Entry level and facing direction not specified
- Construction: Slab foundation; Construction year not specified
- Exterior features: Covered patio/porch; Shed(s); Landscaped lot
Interior
- Kitchen: Dishwasher; Free-standing gas oven; Microwave; Refrigerator
- Bedrooms: Bedrooms information not specified
- Flooring: Flooring information not specified
- Bathrooms: 2 full bathrooms
- Heating & cooling: Forced air heating; Propane heating
- Interior features: Walk-in closet(s); Covered patio/porch
- Laundry & utility: Dedicated laundry room; Generator
Neighborhood map
What this means for you Summary
Snapshot
- This is a 2-bed/2.0-bath single-family listed at $85k. Condition is rated good.
Deal economics
- At list price, monthly cash flow is $1k ($15k/yr) — positive.
- The deal already cash-flows at list — no discount required.
- Meets the 1% rule at list price ($2k rent vs $85k).
- Recommended offer: $82k (3.0% below list) — sets the bar for market timing.
- Cap rate 23.6% vs local median 3.9% in Claverack-Red Mills — top-decile yield for the area; either an underpriced asset or a hidden risk that comps aren't pricing in. Stress-test before assuming the spread holds.
Location & tenants
- Location reads: area grade B — affects rentability + tenant quality, not the cash-flow math above.
- Hudson City School District (town): math 38% / reading 47% proficiency, ranked #494 of 590 in NY (top 84%) — families likely to look elsewhere, expect single-tenant / working-renter base with shorter leases.
- Zoned schools: Montgomery C Smith Elementary School (math 36% / reading 47%, grade F, #1,409 of 2,108 statewide, top 67%, 723 students, 65% FRL); Hudson Junior High School (math 20% / reading 36%, grade F, #573 of 729 statewide, top 79%, 384 students, 63% FRL); Hudson High School (math 82% / reading 84%, grade A, #435 of 1,100 statewide, top 40%, 454 students, 57% FRL).
- Market conditions: Rents rising fast (+10.9%/yr); 162 active listings in the ZIP; 136 units permitted in Columbia County in 2024 (0 in 5+ unit buildings).
- This rent runs 38% of the median local income ($73k/yr) — at the standard rent-burdened threshold; future hikes will face affordability resistance.
Forward outlook
- In year one you build about $9k of equity ($588 loan paydown + $8k appreciation (10.0% local appreciation)).
- Columbia County population projected at -22% by 2050 — secular population decline; favor cash flow + early exit over multi-decade hold.
- At projected returns (10.0% appreciation + 8.0% rent growth), your $24k cash investment doubles in ~2 years — after that, you're playing with house money.
- By year 4, paydown + projected appreciation supports a ~$32k cash-out refi (75% LTV) — recoverable capital for the next deal without selling this one.
Negotiation context
- It's been on market 34 days — a 3% lower offer ($82k) is reasonable based on typical stale-listing flexibility.
- 3 sale attempts with the ask held roughly flat each time — persistent listings suggest the price (not the market) is what's stuck; bring a comps-based counter.
Questions for the listing agent
- It's been on market 34 days. Have you received any prior offers? Is the seller open to a 3% concession, seller financing, or rate buy-down credit?
- Is there a deadline driving the sale (1031 exchange, divorce, estate, relocation)? That informs how much negotiation room exists.
- What's the average days-on-market for RENTAL listings here right now (not sales)? A rising rental-DOM trend means longer vacancies and softer asking-rent achievability than the comps imply.
- What's the recent tenant-quality profile in this submarket — average credit score on applications, eviction rate, late-payment / NSF rate, and stable-employment percentage? A property-management company in the area should have these aggregated.
- How much new for-sale + rental construction is in the pipeline within 1–3 miles? Heavy new supply typically softens prices + rents 12–24 months out; constrained supply supports both.
Investment metrics
- 1% rule
- 2.70% ✓
- Cap rate
- 23.58%
- Cash-on-cash
- 61.75%
- DSCR
- 3.75
- GRM
- 3.1
CMA / ARV
- ARV (on-the-fly)
- $74,480
- Comps found
- 1
Show comp detail 1 sale within ~0.75 mi
| Address | Dist | Beds/Ba | Sqft | Sold | Price | $/sf | Match |
|---|---|---|---|---|---|---|---|
| 5427 Ny-9h #16 | 0.43mi | 2/1.0 | 960 (-2%) | 9mo | $73,000 | $76 | 65 |
Match score weights: distance 35% · size 25% · config 20% · recency 20%. Top-matched comps best support the ARV.
Projected returns pro-forma
10.0% appreciation · 8.0% rent growth · sell at horizon
- IRR
- 77.9%
- Equity multiple
- 6.73×
- Total profit
- $136,453
- Equity at exit
- $76,575
- IRR
- 73.7%
- Equity multiple
- 16.57×
- Total profit
- $370,592
- Equity at exit
- $165,136
Cash invested: $23,800 (down + closing). Projections, not guarantees.
Landlord ↔ Tenant lean methodology
- Overall (STATE)
- 15 Strongly Tenant-Friendly
- State New York
- 15 Strongly Tenant-Friendly · D+10
- County
- — inherits STATE
- City
- — inherits STATE
ZIP-level market 12534
- Home prices YoY
- 5.6%
- Rents YoY
- 10.9%
- Active inventory
- 162
- Price-to-rent
- 3.1×
Monthly cashflow live
- Estimated rent
- $2,294 medium interval (Pro) →
- Mortgage (P&I)
- −$446
- Tax est. 1.5%
- −$106 /mo · $1,275/yr
- Insurance
- −$35
- HOA
- −$0
- Vacancy / Maint / Mgmt
- −$482
- Net cashflow
- $1,225
Break-even live
Sensitivity live
| Price | -10% $1,283 | -5% $1,254 | +0% $1,225 | +5% $1,195 | +10% $1,166 |
|---|---|---|---|---|---|
| Rent | -10% $1,044 | -5% $1,134 | +0% $1,225 | +5% $1,315 | +10% $1,406 |
| Rate | -1.0pp $1,268 | -0.5pp $1,246 | base $1,225 | +0.5pp $1,203 | +1.0pp $1,180 |
UW: 25.0% down · 7.5% · 30yr · 1.5% tax · 5.0% vac · 8.0% maint · 8.0% mgmt
Financing live
Cash to close
- Down payment
- $21,250
- Closing costs
- $2,550
- Reserves months
- —
- Total cash needed
- —
Loan-product check · same deal, 3 products live
Conventional
25% down · 7.5% · 30yr
- Down + closing
- —
- Monthly P&I
- —
- Monthly cashflow
- —
- DSCR
- —
- Eligible?
- —
Personal DTI + credit; lowest rate.
DSCR
20% down · 8.5% · 30yr
- Down + closing
- —
- Monthly P&I
- —
- Monthly cashflow
- —
- DSCR
- —
- Eligible?
- —
No personal income docs; deal must DSCR.
Hard money
10% down · 12.0% · 12mo
- Down + closing
- —
- Monthly P&I
- —
- Monthly cashflow
- —
- DSCR
- —
- Eligible?
- —
Short-term bridge; refi at stabilization.
Listing history 17 events
-
2026-06-21days on market $85,000 Active 34 DOM
-
2026-06-19days on market $85,000 Active 32 DOM
-
2026-06-18days on market $85,000 Active 31 DOM
-
2026-06-17days on market $85,000 Active 30 DOM
-
2026-06-16days on market $85,000 Active 29 DOM
-
2026-06-15days on market $85,000 Active 28 DOM
-
2026-06-14days on market $85,000 Active 26 DOM
-
2026-06-12days on market $85,000 Active 25 DOM
-
2026-06-09days on market $85,000 Active 22 DOM
-
2026-06-08days on market $85,000 Active 21 DOM
-
2026-06-07days on market $85,000 Active 20 DOM
-
2026-06-04days on market $85,000 Active 18 DOM
-
2026-06-02days on market $85,000 Active 17 DOM
-
2026-06-01days on market $85,000 Active 16 DOM
-
2026-05-31days on market $85,000 Active 15 DOM
-
2026-05-31status $85,000 Active 14 DOM
-
2026-05-07$85,000 Active 700-char remark
ⓘ Source: listings_history table (triggers on properties + properties_extension) + one-shot
backfill from property_details.listing_events for pre-trigger history.
Nearby sold comps map
Loading sold comps map…
Walkable amenities ~0.75 mi
Loading nearby amenities…
Taxation est. · year 1
- Rental income
- $27,526
- − Mortgage interest
- −$4,761
- − Property taxes
- −$1,275
- − Insurance
- −$425
- − Repairs & maintenance
- −$2,202
- − Management
- −$2,202
- − Depreciation
- −$2,473
- Taxable income
- $14,188
- Est. tax owed @ 24.0%
- −$3,405
- After-tax cash flow
- $11,292/yr
For passive investors: Depreciation is non-cash, so a rental often shows a tax loss while cash-flowing — sheltering income. Rental losses are passive: they offset passive income freely, and up to $25,000/yr can offset ordinary (W-2) income if you actively participate and your MAGI is under $100k (phasing out to $0 by $150k); unused losses carry forward. On sale, claimed depreciation is recaptured at up to 25%, and gains may owe capital-gains tax (a 1031 exchange can defer both). Figures are a year-1 estimate at your 24.0% rate — not tax advice; consult a CPA.
Condition & rehab AI · 11 photos
This 2011 Champion mobile home is in good condition with a good layout and well-maintained exterior. It's ready for a fresh coat of paint and new carpet to further enhance its curb appeal and value.
Value-add opportunities
- Both Paint exterior siding — Enhances curb appeal and value
- Both Replace carpet — Fresh carpet improves comfort and value
Renovation cost estimate screening
Value-add ROI direction
- Both Paint exterior siding — Enhances curb appeal and value ↑
- Both Replace carpet — Fresh carpet improves comfort and value ↑
ⓘ Cost ranges are severity-bucket heuristics (US national rule-of-thumb). Get contractor quotes + a written scope before underwriting a rehab budget.
Schools (NCES district)
- District
- Hudson City School District
- NCES district ID
- 3614940
- Math proficiency
- 38% ▲ 4.00%
- Reading proficiency
- 47% ▲ 7.00%
- Median HH income
- $44,663
- Composite
- 36.03/100
- National rank
- #4779
- State rank
- #494 of 590 in NY
Livability — Claverack-Red Mills
No livability data for this city. (Only ~50 U.S. cities are tracked.)
Census & demographics
- County
- Columbia County · 17,176 people
- City population
- 17,176
- Metro
- Hudson, NY
- Population (ZIP)
- 17,176
- Household income
- $72,741
- Rent vs Own
- Severe rent burden
- 1083.0
Population outlook (Columbia County) Hauer SSP2
- Today (2025)
- 58,662 people
- By 2030
- 56,557 · -3.6%
- By 2040
- 51,324 · -12.5%
- By 2050
- 45,790 · -21.9%
- By 2075
- 35,232 · -39.9%
- By 2100
- 25,846 · -55.9%
Race, ethnicity, and origin ACS 2023
- Neighborhood character
- Predominantly White (74%)
- Race & ethnicity
- White 74% Two or more races 7% Black 7% Hispanic / Latino 7% Asian 6%
- Hispanic origin (detail)
- Mexican 2% Puerto Rican 1%
- Common ancestry
- Lithuanian 4% Romanian 4% Iranian 3%
- Foreign-born
- 10% · Canada, China
- Languages at home
- 88% English-only · Spanish 5% Other Indo-European 3% Chinese 1%
Political lean MEDSL · Columbia
- 2024 margin
- D (+14.7) · D 57.4% · R 42.6%
- 2008→2024 swing
- +1.3pp toward D · 2008: 13.4pp · 2024: 14.7pp
- All cycles
- 2024: D+14.7 2020: D+16.7 2016: D+1.4 2012: D+11.7 2008: D+13.4
Not yet ingested
- Civics
- —
Market trends
- HPI YoY
- ▲ 25.98%
- Current HPI
- 490.0412
- Rent YoY
- ▲ 10.88%
- Metro
- Hudson, NY
- State GDP YoY
- ▲ 2.60%
- F500 in state
- 92
Industry mix (Fortune 500 HQ in NY)
| Industry | F500 HQs | Revenue |
|---|---|---|
| Financial Services | 10 | $950B |
|
||
| Consumer Goods | 9 | $162B |
|
||
| Insurance | 4 | $225B |
|
||
| Telecommunications | 2 | $144B |
|
||
| Pharmaceuticals | 2 | $112B |
|
||
| Media / Entertainment | 2 | $69B |
|
||
Price history
5 events — show timeline
- 2026-06-06 Relisted — HVCRMLS
- 2026-06-04 Pending — HVCRMLS
- 2026-05-30 Relisted — HVCRMLS
- 2026-05-21 Pending — HVCRMLS
- 2026-05-07 Listed $85,000 HVCRMLS
Cash-flow waterfall
monthlySold comps — $/sqft
last 12 mo · ≤1 miLoading sold comps…