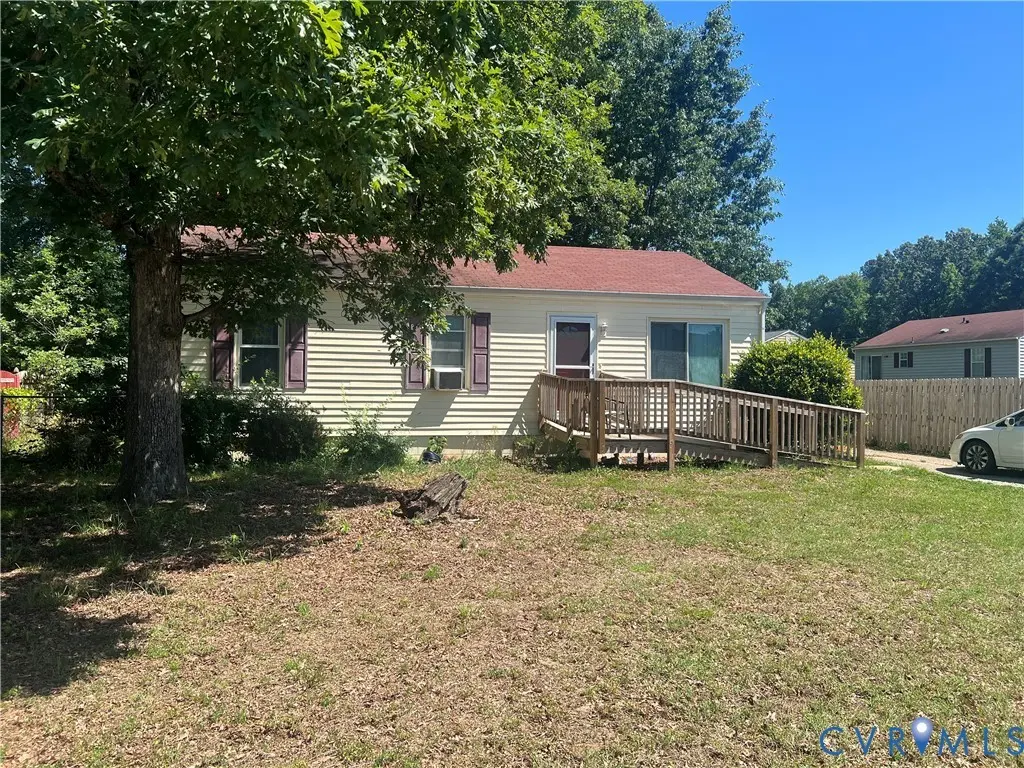
602 Wilmer Ave · Richmond, VA
Flood risk 1/10 · Minimal
- FEMA flood zone
- X (unshaded)
- Chance of flooding over 30 yrs
- 0.0%
- Est. flood insurance / yr
- $507 – $1,088
Fire risk 2/10 · Minimal
- Est. fire insurance / yr
- $666 – $1,236
Heat risk 7/10 · Major
- Hot days now (above 105°F)
- 7 days/yr
- Hot days in 30 yrs
- 17 days/yr
Wind risk 6/10 · Moderate
- Chance of severe wind over 30 yrs
- 27.0%
Air-quality risk 2/10 · Minimal
- Unhealthy air days now
- 1 days/yr
- Unhealthy air days in 30 yrs
- 3 days/yr
Risk factors via First Street. Map © Google.
Why this score? — see what drove the D+ grade
The composite is a weighted blend of 9 inputs, each scored 0–100. Each bar is that input's sub-score; the figure is the points it added to the 100-point composite (weight × sub-score).
- ARV discount +15.0/15.0
- Cash flow +10.8/30.0
- Schools +4.9/10.0
- Livability +4.2/5.0
- DSCR +3.1/10.0
- Rent growth +2.8/5.0
- 1% rule +2.5/10.0
- Condition / age +2.5/5.0
- Appreciation +0.0/10.0
$199,000
🖨 Deal sheet (PDF) 📄 Offer letter ✓ Due diligence
Listing remarks MLS
WOW!! Adorable and priced to go now. .This is a well maintained home that is difficult to find in this price range. Priced $13,400 under county assessment. This home has a new roof, new vinyl siding, and replacement windows, new flooring, freshly painted inside-with either 3 or 4 bedrooms/or living room with rear den (not visible from street) which leads to oversize rear deck with private fenced rear yard. A MUST SEE. ..
Key facts
- Large eat in kitchen
- New vanity
- Bonus family room
Tags
Property features AI
Exterior
- Parking: Unpaved driveway
- Utilities: Public water; Public sewer; Electric service
- Home design: Single-story home; Resale property; Composition roof; Frame construction with vinyl siding; Zoned R5
- Construction: Built in (year: Actual); Frame construction; Vinyl siding; Composition roof; Crawl space foundation
- Exterior features: Deck; Front porch; Unpaved driveway
Interior
- Bedrooms: Bedroom located on the first floor
- Flooring: Laminate flooring; Partially carpeted
- Bathrooms: 1 full bathroom with tub and shower
- Heating & cooling: Electric baseboard heat; Window cooling units
- Interior features: Dining area; Bedroom on main level; Crawl space basement
- Laundry & utility: Washer hookup; Dryer hookup; Electric water heater
Neighborhood map
What this means for you Summary
Snapshot
- This is a 3-bed/1.5-bath single-family listed at $199k.
Deal economics
- At list price, monthly cash flow is $-91 ($-1k/yr) — negative.
- To cash-flow at today's rent, offer at most $183k (8.1% below list).
- To meet the 1% rule (rent ≥ 1% of price), the offer needs to be $149k (25.4% below list).
- Recommended offer: $149k (25.4% below list) — sets the bar for 1% rule.
- Cap rate 5.7% vs local median 3.2% in Richmond — top-decile yield for the area; either an underpriced asset or a hidden risk that comps aren't pricing in. Stress-test before assuming the spread holds.
Location & tenants
- Location reads 84/100 on livability (#33 in VA, #793 nationally) — a professional / high-income tenant draw. Strengths: amenities A+, commute A+, health & safety A+; Watch: crime D-.
- Henrico County Public School District (suburban): math 49% / reading 64% proficiency, ranked #68 of 131 in VA (top 52%) — acceptable for families but not a draw, mixed tenant base, ~2y average lease.
- Zoned schools: Laburnum Elementary (math 12% / reading 27%, grade F, #1,089 of 1,108 statewide, top 99%, 456 students, 88% FRL); L. Douglas Wilder Middle (math 47% / reading 51%, grade C-, #238 of 342 statewide, top 71%, 761 students, 89% FRL); Henrico High (math 44% / reading 74%, grade C+, #256 of 319 statewide, top 81%, 1,348 students, 86% FRL) — zoned schools average 88% FRL vs 34% district-wide (54 pts higher); higher-poverty schools than district average — tighter screening recommended.
- Zoned-school proficiency averages 42% at this address vs 56% district-wide (-14 pts) — the specific schools serving this property underperform the Henrico County Public School District average; the district grade overstates school quality for this exact location.
- Market conditions: Rents rising (+1.0%/yr); 115 active listings in the ZIP; 13 comparable units currently listed for rent nearby; rentals lingering (median 46d on market — plan ~5-8 weeks vacancy on turnover, expect pricing pressure); 54% of comp listings sitting > 30 days — soft ceiling on asking rent; 1,826 units permitted in Henrico County in 2024 (785 in 5+ unit buildings).
Forward outlook
- Local home prices are declining (-3.0%/yr); year-one equity from $1k of loan paydown is wiped out by about $6k of value loss. Plan a longer hold.
- Henrico County population projected at +21% by 2050 — long-run rental-demand tailwind backs the buy-and-hold thesis.
Negotiation context
- Only 3 days on market — expect competitive offers; lowballing is unlikely to land.
- 3 sale attempts since 17y ago with the ask held roughly flat each time — persistent listings suggest the price (not the market) is what's stuck; bring a comps-based counter.
- Current owner paid $115k; list at $199k implies a 73% gain — meaningful room to come down on a strong offer.
Risks & watch-outs
- Climate carrying-cost: major wind risk, 27% chance of damaging wind over 30y; extreme-heat days projected 7→17/yr by 2055 (HVAC capex compounding) — expect insurance premiums to compound above CPI over the hold.
Questions for the listing agent
- What do current leases actually rent for vs. the listed asking? Can we see a recent rent roll and the last 12 months of T-12 income?
- Is there a deadline driving the sale (1031 exchange, divorce, estate, relocation)? That informs how much negotiation room exists.
- Schools are A-rated — typically a magnet for longer-tenancy family renters. What's the average tenant stay here, and is there a school-zone premium baked into asking?
- Crime grade is D in this area — have there been break-ins, vandalism, or insurance claims at this property in the last 3 years? What carrier currently insures it and at what premium?
- The area grade is low — what's the realistic commute time and amenity access for the typical tenant pool here? Any planned neighborhood developments (good or bad) we should know about?
- What's the average days-on-market for RENTAL listings here right now (not sales)? A rising rental-DOM trend means longer vacancies and softer asking-rent achievability than the comps imply.
- What's the recent tenant-quality profile in this submarket — average credit score on applications, eviction rate, late-payment / NSF rate, and stable-employment percentage? A property-management company in the area should have these aggregated.
- How much new for-sale + rental construction is in the pipeline within 1–3 miles? Heavy new supply typically softens prices + rents 12–24 months out; constrained supply supports both.
Investment metrics
- 1% rule
- 0.75% ✗
- Cap rate
- 5.74%
- Cash-on-cash
- -1.96%
- DSCR
- 0.91
- GRM
- 11.2
CMA / ARV
- ARV (on-the-fly)
- $277,560
- Comps found
- 8
Show comp detail 8 sales within ~0.75 mi
| Address | Dist | Beds/Ba | Sqft | Sold | Price | $/sf | Match |
|---|---|---|---|---|---|---|---|
| 408 Winnetka Ave | 0.27mi | 3/2.0 | 1,070 (-1%) | 10mo | $280,000 | $262 | 76 |
| 4907 Edgefield Cir | 0.41mi | 3/1.0 | 1,088 (+1%) | 3mo | $260,000 | $239 | 76 |
| 605 Conley Rd | 0.45mi | 3/1.5 | 1,088 (+1%) | 9mo | $280,000 | $257 | 70 |
| 514 Conley Rd | 0.45mi | 3/1.5 | 1,088 (+1%) | 17mo | $274,000 | $252 | 64 |
| 812 Azalea Ave | 0.35mi | 3/2.0 | 1,104 (+2%) | 17mo | $255,000 | $231 | 63 |
| 621 Conley Rd | 0.39mi | 3/1.0 | 1,088 (+1%) | 20mo | $305,000 | $280 | 62 |
| 608 Conley Rd | 0.38mi | 3/2.0 | 1,088 (+1%) | 22mo | $325,000 | $299 | 61 |
| 804 Winnetka Ave | 0.28mi | 3/1.5 | 1,033 (-4%) | 23mo | $190,000 | $184 | 60 |
Match score weights: distance 35% · size 25% · config 20% · recency 20%. Top-matched comps best support the ARV.
Projected returns pro-forma
-3.0% appreciation · 1.0% rent growth · sell at horizon
- IRR
- -21.6%
- Equity multiple
- 0.26×
- Total profit
- $-41,012
- Equity at exit
- $29,672
- IRR
- -20.5%
- Equity multiple
- 0.01×
- Total profit
- $-54,905
- Equity at exit
- $17,206
Cash invested: $55,720 (down + closing). Projections, not guarantees.
Landlord ↔ Tenant lean methodology
- Overall (STATE)
- 55 Moderately Landlord-Leaning
- State Virginia
- 55 Moderately Landlord-Leaning · D+2
- County
- — inherits STATE
- City
- — inherits STATE
ZIP-level market 23227
- Rents YoY
- 1.0%
- Active inventory
- 115
- Price-to-rent
- 11.2×
Monthly cashflow live
- Estimated rent
- $1,485 high interval (Pro) →
- Mortgage (P&I)
- −$1,044
- Tax from tax record
- −$138 /mo · $1,654/yr
- Insurance
- −$83
- HOA
- −$0
- Vacancy / Maint / Mgmt
- −$312
- Net cashflow
- $-91
Break-even live
Sensitivity live
| Price | -10% $22 | -5% $-35 | +0% $-91 | +5% $-147 | +10% $-204 |
|---|---|---|---|---|---|
| Rent | -10% $-208 | -5% $-150 | +0% $-91 | +5% $-32 | +10% $26 |
| Rate | -1.0pp $9 | -0.5pp $-40 | base $-91 | +0.5pp $-142 | +1.0pp $-195 |
UW: 25.0% down · 7.5% · 30yr · 1.5% tax · 5.0% vac · 8.0% maint · 8.0% mgmt
Financing live
Cash to close
- Down payment
- $49,750
- Closing costs
- $5,970
- Reserves months
- —
- Total cash needed
- —
Loan-product check · same deal, 3 products live
Conventional
25% down · 7.5% · 30yr
- Down + closing
- —
- Monthly P&I
- —
- Monthly cashflow
- —
- DSCR
- —
- Eligible?
- —
Personal DTI + credit; lowest rate.
DSCR
20% down · 8.5% · 30yr
- Down + closing
- —
- Monthly P&I
- —
- Monthly cashflow
- —
- DSCR
- —
- Eligible?
- —
No personal income docs; deal must DSCR.
Hard money
10% down · 12.0% · 12mo
- Down + closing
- —
- Monthly P&I
- —
- Monthly cashflow
- —
- DSCR
- —
- Eligible?
- —
Short-term bridge; refi at stabilization.
Rent comps 13 comps
| Address | Beds | Baths | Sqft | Rent | $/sqft | DOM | Units | Dist |
|---|---|---|---|---|---|---|---|---|
| 628 Windomere Ave Richmond, VA | 1.0–2.0 | 1.0–1.5 | 750 | $1,685 | $2.25 | 3d | 6 | 0.07mi |
| 800 Brook Hill Rd Unit 722 Richmond, VA | 2.0 | 1.0 | 900 | $1,295 | $1.44 | 45d | 1 | 0.26mi |
| 806 Brook Hill Rd Unit 432 Richmond, VA | 2.0 | 1.0 | 997 | $1,150 | $1.15 | 45d | 1 | 0.29mi |
| 812 Brook Hill Rd Unit 1633 Richmond, VA | 2.0 | 1.0 | 997 | $1,200 | $1.20 | 45d | 1 | 0.30mi |
| 5604 Crenshaw Rd Unit 1533 Richmond, VA | 2.0 | 1.0 | 800 | $1,200 | $1.50 | 45d | 1 | 0.32mi |
| 835 Winnetka Ave Richmond, VA | 3.0 | 1.5 | 980 | $1,775 | $1.81 | 25d | 1 | 0.42mi |
| 6001 Grammarcy Cir Richmond, VA | 1.0–3.0 | 1.0–1.5 | 830 | $1,395 | $1.68 | 45d | 1 | 0.48mi |
| 4903 Chamberlayne Ave #1 Richmond, VA | 2.0 | 1.0 | 780 | $1,150 | $1.47 | 45d | 1 | 0.66mi |
| 5501 Pony Farm Dr Richmond, VA | 1.0–3.0 | 1.0–2.0 | 794 | $1,850 | $2.33 | 3d | 133 | 0.69mi |
| 4812 Chamberlayne Ave Unit 2 Richmond, VA | 2.0 | 1.0 | 720 | $1,325 | $1.84 | 19d | 1 | 0.77mi |
| 5701 Pony Farm Dr Richmond, VA | 1.0–3.0 | 1.0–2.0 | 794 | $2,010 | $2.53 | 3d | 52 | 0.78mi |
| 3810 Chamberlayne Ave Unit B Richmond, VA | 2.0 | 1.0 | 850 | $1,095 | $1.29 | 45d | 1 | 1.43mi |
| 3810 Chamberlayne Ave Unit G Richmond, VA | 2.0 | 1.0 | 750 | $1,095 | $1.46 | 19d | 1 | 1.43mi |
Listing history 4 events
-
2026-06-09days on market $199,000 Active 3 DOM
-
2026-06-08days on market $199,000 Active 2 DOM
-
2026-06-07remarks 428-char remark
-
2026-06-07$199,000 Active 1 DOM
ⓘ Source: listings_history table (triggers on properties + properties_extension) + one-shot
backfill from property_details.listing_events for pre-trigger history.
Tax reassessment forecast VA · Resets to sale price
- Current annual tax
- $1,654 · $138/mo
- Projected year-2 tax
- $1,654 · $138/mo
- Expected delta
- $0/yr ($0/mo · 0.0%)
ⓘ Screening estimate from a state-policy table — verify with the county assessor before closing.
Climate risk First Street
- Flood 1/10 Low FEMA zone X (unshaded) · 0% chance over 30 yrs
- Wildfire 2/10 Low
- Heat 7/10 Severe 7 d/yr ≥105°F today · 17 d/yr by 30 yrs out
- Wind 6/10 Major 27% chance of damaging wind over 30 yrs
- Air quality 2/10 Low 1 unhealthy d/yr today · 3 by 30 yrs out
Nearby sold comps map
Loading sold comps map…
Walkable amenities ~0.75 mi
Loading nearby amenities…
Taxation est. · year 1
- Rental income
- $17,825
- − Mortgage interest
- −$11,147
- − Property taxes
- −$1,654
- − Insurance
- −$995
- − Repairs & maintenance
- −$1,426
- − Management
- −$1,426
- − Depreciation
- −$5,789
- Taxable loss
- −$4,613
- Est. tax savings @ 24.0%
- +$1,107
- After-tax cash flow
- $16/yr
For passive investors: Depreciation is non-cash, so a rental often shows a tax loss while cash-flowing — sheltering income. Rental losses are passive: they offset passive income freely, and up to $25,000/yr can offset ordinary (W-2) income if you actively participate and your MAGI is under $100k (phasing out to $0 by $150k); unused losses carry forward. On sale, claimed depreciation is recaptured at up to 25%, and gains may owe capital-gains tax (a 1031 exchange can defer both). Figures are a year-1 estimate at your 24.0% rate — not tax advice; consult a CPA.
Schools (NCES district)
- District
- Henrico County Public School District
- NCES district ID
- 5101890
- Math proficiency
- 49% ▼ -32.00%
- Reading proficiency
- 64% ▼ -12.00%
- Median HH income
- $61,854
- Composite
- 49.25/100
- National rank
- #2031
- State rank
- #68 of 131 in VA
Livability — Richmond
- Score
- 84/100
- State rank
- #33
- US rank
- #793
Category grades
Schools grade is shown separately in the Schools card above.
Census & demographics
- County
- Henrico County · 334,490 people
- City population
- 287,109
- Metro
- Richmond, VA
- Population (ZIP)
- 24,925
- Household income
- $69,187
- Rent vs Own
- Severe rent burden
- 1950.0
Population outlook (Henrico County) Hauer SSP2
- Today (2025)
- 365,885 people
- By 2030
- 384,255 · +5.0%
- By 2040
- 416,688 · +13.9%
- By 2050
- 442,376 · +20.9%
- By 2075
- 488,037 · +33.4%
- By 2100
- 487,430 · +33.2%
Race, ethnicity, and origin ACS 2023
- Neighborhood character
- Diverse neighborhood (Simpson 0.62)
- Race & ethnicity
- Black 45% White 42% Two or more races 8% Hispanic / Latino 5% Asian 1%
- Common ancestry
- Slovak 2% Serbian 1% Italian 1%
- Foreign-born
- 6% · Canada
- Languages at home
- 93% English-only · Spanish 4% Arabic 1%
Political lean MEDSL · Henrico
- 2024 margin
- Strong D (+28.9) · D 63.7% · R 34.8% · Other 1.5%
- 2008→2024 swing
- +16.6pp toward D · 2008: 12.2pp · 2024: 28.9pp
- All cycles
- 2024: D+28.9 2020: D+29.0 2016: D+21.0 2012: D+11.7 2008: D+12.2
Not yet ingested
- Civics
- —
Market trends
- HPI YoY
- ▼ -332.25%
- Current HPI
- 303.5514
- Rent YoY
- ▲ 1.00%
- Metro
- Richmond, VA
- State GDP YoY
- ▲ 2.40%
- F500 in state
- 50
Industry mix (Fortune 500 HQ in VA)
| Industry | F500 HQs | Revenue |
|---|---|---|
| Aerospace / Defense | 4 | $236B |
|
||
| Technology / Defense | 3 | $32B |
|
||
| Financial Services | 2 | $176B |
|
||
| Utilities | 2 | $27B |
|
||
| Insurance | 2 | $25B |
|
||
| Technology | 2 | $15B |
|
||
Price history
+282.7% since first listed6 events — show timeline
- 2026-06-05 Listed $199,000 CVRMLS
- 2009-05-22 Sold (MLS) $115,000 CVRMLS
- 2009-05-22 Sold (MLS) $115,000 CVRMLS
- 2009-03-26 Listed $115,000 CVRMLS
- 2009-03-26 Listed $115,000 CVRMLS
- 1990-08-01 Sold (Public Records) $52,000 Public Records
Property tax history
+5.4%/yrLatest (2025): $1,654 · +7.5% YoY. Source: county tax records.
Cash-flow waterfall
monthlySold comps — $/sqft
last 12 mo · ≤1 miLoading sold comps…