 Fourplex
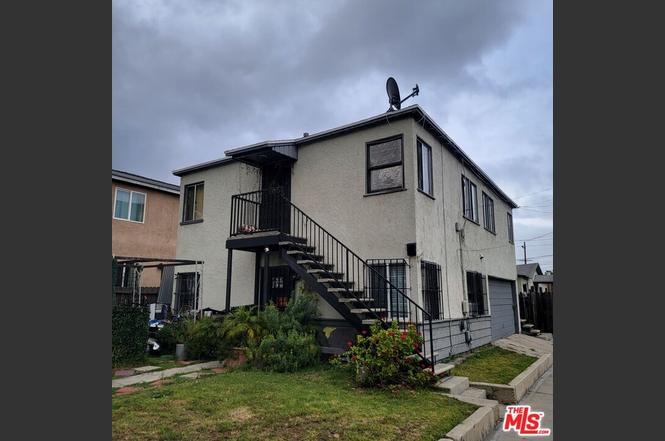
715 W 92nd St · Los Angeles, CA
Flood risk 1/10 · Minimal
- FEMA flood zone
- X (unshaded)
- Chance of flooding over 30 yrs
- 0.0%
- Est. flood insurance / yr
- $507 – $1,088
Fire risk 1/10 · Minimal
- Est. fire insurance / yr
- $659 – $1,223
Heat risk 5/10 · Moderate
- Hot days now (above 88°F)
- 7 days/yr
- Hot days in 30 yrs
- 22 days/yr
Wind risk 1/10 · Minimal
- Chance of severe wind over 30 yrs
- —
Air-quality risk 5/10 · Moderate
- Unhealthy air days now
- 7 days/yr
- Unhealthy air days in 30 yrs
- 7 days/yr
Risk factors via First Street. Map © Google.
Why this score? — see what drove the B- grade
The composite is a weighted blend of 9 inputs, each scored 0–100. Each bar is that input's sub-score; the figure is the points it added to the 100-point composite (weight × sub-score).
- Cash flow +30.0/30.0
- 1% rule +10.0/10.0
- DSCR +10.0/10.0
- ARV discount +7.5/15.0
- Schools +3.6/10.0
- Livability +3.4/5.0
- Condition / age +2.5/5.0
- Rent growth +1.9/5.0
- Appreciation +0.0/10.0
$770,000
🖨 Deal sheet 📄 Offer letter ✓ Due diligence
Multi-family units
County records classify this as Multi-Family (2-4 Unit). Listing-text estimate: 4 units. confirmed
Listing remarks
Investor opportunity in a high-demand South Los Angeles rental corridor. This value-add fourplex sits on a 5,078 SF LAR2-zoned lot and features a detached 2BD/1BA front house with a rear structure consisting of three 1BD/1BA units. Built in 1922 with approximately 2,184 SF of living space, the property offers clear repositioning potential with below in place rents and strong upside through renovation and rent optimization. Strategically located near the 110, 105, and 91 freeways, the asset provides efficient access to Downtown Los Angeles, Inglewood, LAX, SoFi Stadium, Intuit Dome, Hollywood Park, Kia Forum, SpaceX, and a wide range of major employment, entertainment, and lifestyle hubs. Th
Key facts
- Detached front house
- Three 1bd units
- Strong tenant demand
Tags
Property features AI
Finance
- Financial info: Actual gross annual income: $39,300; Gross operating income: $37,335; Net operating income: $22,311; Total annual expenses: $15,024; Gross rent multiplier: 19.59; Listing terms: Cash; Current rents (actual): Unit A: $1,550; Unit B: $500; Unit C: $700; Unit D: $525; Projected market rents: Unit A: $2,300; Units B–D: $1,750 each
- HOA & community: Complex contains 4 units
Exterior
- Parking: Two-car garage; Four total parking spaces
- Home design: Residential income property; Two levels (two-story); Fourplex (four units across four buildings)
- Exterior features: No additional structures on the lot; Zoned LAR2
Interior
- Bedrooms: One 2-bedroom unit; Three 1-bedroom units
- Bathrooms: Four 1-bath units
- Heating & cooling: Wall heating; Ceiling fan (cooling)
- Interior features: Ceiling fan
Neighborhood map
What this means for you Summary
Snapshot
- This is a 4 × 5-bed/4.0-bath units multifamily listed at $770k.
Deal economics
- At list price, monthly cash flow is $7k ($86k/yr) — positive. Per door: $2k/mo.
- The deal already cash-flows at list — no discount required.
- Meets the 1% rule at list price ($16k rent vs $770k).
- Cap rate 17.4% vs local median 2.1% in Los Angeles — top-decile yield for the area; either an underpriced asset or a hidden risk that comps aren't pricing in. Stress-test before assuming the spread holds.
Location & tenants
- Location reads 68/100 on livability (#273 in CA) — a middle-class / working-renter tenant base. Strengths: amenities A+, commute A+, employment B; Watch: health & safety C-, schools D+, crime F.
- Los Angeles Unified (urban): math 29% / reading 54% proficiency, ranked #223 of 517 in CA (top 43%) — families likely to look elsewhere, expect single-tenant / working-renter base with shorter leases; 67% free/reduced lunch — lower-income household profile, screen leases tightly.
- Market conditions: Rents soft (-2.5%/yr); 172 active listings in the ZIP; 40 comparable units currently listed for rent nearby; rentals at typical pace (median 25d on market — plan ~3-4 weeks tenant-placement turnaround); 19,697 units permitted in Los Angeles County in 2024 (9,426 in 5+ unit buildings).
- At $15,768/mo this rent would consume 355% of the median local household income ($53k/yr) (locally 7490% of renters already pay >50% of income on rent) — very limited rent-growth headroom before tenants either downsize or default.
Forward outlook
- Local home prices are declining (-3.0%/yr); year-one equity from $5k of loan paydown is wiped out by about $23k of value loss. Plan a longer hold.
- Los Angeles County population projected at +9% by 2050 — modest demand growth; plan on rents tracking national, not racing it.
- At projected returns (-3.0% appreciation + 0.0% rent growth), your $216k cash investment doubles in ~4 years — after that, you're playing with house money.
Negotiation context
- Only 4 days on market — expect competitive offers; lowballing is unlikely to land.
- 4 sale attempts since 8y ago with the ask held roughly flat each time — persistent listings suggest the price (not the market) is what's stuck; bring a comps-based counter.
Risks & watch-outs
- Watch-outs: built in 1922 — expect roof / HVAC / electrical / plumbing capex.
- Climate carrying-cost: extreme-heat days projected 7→22/yr by 2055 (HVAC capex compounding) — expect insurance premiums to compound above CPI over the hold.
Questions for the listing agent
- Can we see the unit-by-unit rent roll, current vacancy, and any below-market leases? What's the average tenancy length?
- What capital expenditures (roof, boiler, parking lot, exteriors) have been made in the last 5 years, and what's planned in the next 2?
- Built in 1922 — when were the roof, HVAC, electrical panel, plumbing, and water heater last replaced?
- Is there a deadline driving the sale (1031 exchange, divorce, estate, relocation)? That informs how much negotiation room exists.
- Schools are D-rated, which usually means shorter tenancies and higher turnover. Who's the typical renter profile here, and what's been the actual vacancy rate?
- Crime grade is F in this area — have there been break-ins, vandalism, or insurance claims at this property in the last 3 years? What carrier currently insures it and at what premium?
- What's the average days-on-market for RENTAL listings here right now (not sales)? A rising rental-DOM trend means longer vacancies and softer asking-rent achievability than the comps imply.
- What's the recent tenant-quality profile in this submarket — average credit score on applications, eviction rate, late-payment / NSF rate, and stable-employment percentage? A property-management company in the area should have these aggregated.
- How much new apartment / multifamily construction is in the pipeline within 1–3 miles? Heavy new supply (>2% of stock underway) typically softens rents 12–24 months out; light construction supports rent growth.
Investment metrics
- 1% rule
- 2.05% ✓
- Cap rate
- 17.41%
- Cash-on-cash
- 39.71%
- DSCR
- 2.77
- GRM
- 4.1
CMA / ARV
No comps found within radius.
Projected returns pro-forma
-3.0% appreciation · 0.0% rent growth · sell at horizon
- IRR
- 32.6%
- Equity multiple
- 2.32×
- Total profit
- $283,714
- Equity at exit
- $114,810
- IRR
- 38.0%
- Equity multiple
- 4.04×
- Total profit
- $654,625
- Equity at exit
- $66,576
Cash invested: $215,600 (down + closing). Projections, not guarantees.
Landlord ↔ Tenant lean methodology
- Overall (CITY)
- 0 Strongly Tenant-Friendly
- State California
- 18 Strongly Tenant-Friendly · D+13
- County
- — inherits STATE
- City Los Angeles
- 0 Strongly Tenant-Friendly · D+22
ZIP-level market 90044
- Rents YoY
- -2.5%
- Active inventory
- 172
- Price-to-rent
- 16.3×
Monthly cashflow live
- Estimated rent
- $15,768 high interval (Pro) →
- Mortgage (P&I)
- −$4,038
- Tax est. 1.5%
- −$962 /mo · $11,550/yr
- Insurance
- −$321
- HOA
- −$0
- Vacancy / Maint / Mgmt
- −$3,311
- Net cashflow
- $7,135
Break-even live
4-unit breakdown (identical units grouped — click to expand)
| Units | Beds | Baths | Est. rent |
|---|---|---|---|
| 4× units | 5 | 4 | $15,768 |
| #1 | 5 | 4 | $3,942 |
| #2 | 5 | 4 | $3,942 |
| #3 | 5 | 4 | $3,942 |
| #4 | 5 | 4 | $3,942 |
| Total (4 units) | $15,768 | ||
UW: 25.0% down · 7.5% · 30yr · 1.5% tax · 5.0% vac · 8.0% maint · 8.0% mgmt
Financing live
Cash to close
- Down payment
- $192,500
- Closing costs
- $23,100
- Reserves months
- —
- Total cash needed
- —
Loan-product check · same deal, 3 products live
Conventional
25% down · 7.5% · 30yr
- Down + closing
- —
- Monthly P&I
- —
- Monthly cashflow
- —
- DSCR
- —
- Eligible?
- —
Personal DTI + credit; lowest rate.
DSCR
20% down · 8.5% · 30yr
- Down + closing
- —
- Monthly P&I
- —
- Monthly cashflow
- —
- DSCR
- —
- Eligible?
- —
No personal income docs; deal must DSCR.
Hard money
10% down · 12.0% · 12mo
- Down + closing
- —
- Monthly P&I
- —
- Monthly cashflow
- —
- DSCR
- —
- Eligible?
- —
Short-term bridge; refi at stabilization.
Rent comps 40 comps
| Address | Beds | Baths | Sqft | Rent | $/sqft | DOM | Units | Dist |
|---|---|---|---|---|---|---|---|---|
| 634 W 92nd St Los Angeles, CA | 1.0–2.0 | 1.0 | 750 | $1,995 | $2.66 | 16d | 2 | 0.12mi |
| 634 W 92nd St Unit 13 Los Angeles, CA | 2.0 | 1.0 | 750 | $1,995 | $2.66 | 24d | 1 | 0.12mi |
| 625 W 92nd St Los Angeles, CA | 1.0 | 1.0 | 610 | $1,895 | $3.11 | 43d | 1 | 0.13mi |
| 1011 W 91st St Apt 3 Los Angeles, CA | 1.0 | 1.0 | 650 | $2,004 | $3.08 | 22d | 1 | 0.28mi |
| 9617 1/2 S Hoover St Los Angeles, CA | 1.0 | 1.0 | 600 | $2,000 | $3.33 | 43d | 1 | 0.30mi |
| 1106 W 91st St Los Angeles, CA | 2.0 | 1.0 | 754 | $2,500 | $3.32 | 10d | 1 | 0.36mi |
| 1104 W 93rd St Unit 3 Los Angeles, CA | 1.0 | 1.0 | 700 | $1,550 | $2.21 | 24d | 1 | 0.36mi |
| 1033 W 95th St Los Angeles, CA | 1.0 | 1.0 | 646 | $1,595 | $2.47 | 24d | 1 | 0.36mi |
| 1111 W 93rd St Unit 1111 Los Angeles, CA | 2.0 | 1.0 | 913 | $2,500 | $2.74 | 24d | 1 | 0.37mi |
| 1111 W 93rd St Unit 1111 Los Angeles, CA | 2.0 | 1.0 | 913 | $2,500 | $2.74 | 14d | 1 | 0.37mi |
| 1107 1/2 W 94th St Los Angeles, CA | 2.0 | 1.0 | 800 | $1,845 | $2.31 | 3d | 1 | 0.37mi |
| 1110 W 94th St Unit 2 Los Angeles, CA | 2.0 | 1.0 | 880 | $2,550 | $2.90 | 43d | 1 | 0.40mi |
| 1120 W 93rd St Los Angeles, CA | 2.0 | 1.0 | 800 | $2,400 | $3.00 | 24d | 1 | 0.40mi |
| 8703 Baring Cross St Los Angeles, CA | 2.0 | 1.0 | 710 | $2,750 | $3.87 | 43d | 1 | 0.41mi |
| 1122 W 94th St Unit 3 Los Angeles, CA | 2.0 | 1.0 | 800 | $2,400 | $3.00 | 24d | 1 | 0.42mi |
| 8738 S Figueroa St Unit 3 Los Angeles, CA | 3.0 | 2.0 | 1100 | $2,300 | $2.09 | 43d | 1 | 0.45mi |
| 9307 Budlong Ave Unit 4 Los Angeles, CA | 3.0 | 2.0 | 917 | $3,300 | $3.60 | 43d | 1 | 0.48mi |
| 9307 Budlong Ave Unit 2 Los Angeles, CA | 3.0 | 2.0 | 977 | $3,200 | $3.28 | 43d | 1 | 0.48mi |
| 817 W 101st St Los Angeles, CA | 2.0 | 1.0 | 638 | $2,100 | $3.29 | 43d | 1 | 0.57mi |
| 607 W 101st St Los Angeles, CA | 2.0 | 1.0 | 995 | $2,800 | $2.81 | 24d | 1 | 0.59mi |
| 241 W 89th St Los Angeles, CA | 1.0 | 1.0 | 680 | $2,200 | $3.24 | 19d | 1 | 0.63mi |
| 916 W 84th St Unit 10 Los Angeles, CA | 1.0 | 1.0 | 600 | $2,250 | $3.75 | 3d | 1 | 0.64mi |
| 916 W 84th St Unit 10 Los Angeles, CA | 1.0 | 1.0 | 600 | $2,250 | $3.75 | 22d | 1 | 0.64mi |
| 9715 S Broadway Unit 1 Los Angeles, CA | 3.0 | 1.0 | 950 | $2,990 | $3.15 | 43d | 1 | 0.65mi |
| 1333 1/2 W 93rd St Unit 1242 Los Angeles, CA | 3.0 | 1.0 | 767 | $2,849 | $3.71 | 24d | 1 | 0.65mi |
| 1327 W 94th St Unit 2 Los Angeles, CA | 2.0 | 1.0 | 910 | $2,900 | $3.19 | 24d | 1 | 0.65mi |
| 1245 W 88th St Apt 6 Los Angeles, CA | 2.0 | 1.0 | 800 | $2,061 | $2.58 | 43d | 1 | 0.65mi |
| 1031 W 102nd St Apt 1 Los Angeles, CA | 3.0 | 2.0 | 1080 | $2,950 | $2.73 | 22d | 1 | 0.66mi |
| 1334 W 93rd St Los Angeles, CA | 2.0 | 2.0 | 750 | $2,600 | $3.47 | 43d | 1 | 0.66mi |
| 517 W 84th St Apt 5 Los Angeles, CA | 2.0 | 1.0 | 750 | $2,600 | $3.47 | 3d | 1 | 0.70mi |
| 517 W 84th St Unit 7 Los Angeles, CA | 2.0 | 1.0 | 800 | $2,500 | $3.12 | 24d | 1 | 0.70mi |
| 517 W 84th St Unit 7 Los Angeles, CA | 2.0 | 1.0 | 800 | $2,500 | $3.12 | 3d | 1 | 0.70mi |
| 1317 W 97th St Unit 1 Los Angeles, CA | 1.0 | 1.0 | 750 | $1,750 | $2.33 | 16d | 1 | 0.71mi |
| 138 W 93rd St Los Angeles, CA | 3.0 | 2.0 | 1000 | $3,250 | $3.25 | 22d | 1 | 0.72mi |
| 140 W 93rd St Los Angeles, CA | 2.0 | 2.0 | 650 | $2,289 | $3.52 | 7d | 1 | 0.73mi |
| 140 W 93rd St Los Angeles, CA | 2.0 | 2.0 | 650 | $2,289 | $3.52 | 22d | 1 | 0.73mi |
| 142 W 94th St Los Angeles, CA | 2.0 | 1.0 | 825 | $2,600 | $3.15 | 43d | 1 | 0.73mi |
| 928 W 83rd St Unit 4 Los Angeles, CA | 1.0 | 1.0 | 550 | $2,000 | $3.64 | 24d | 1 | 0.73mi |
| 928 W 83rd St Unit 4 Los Angeles, CA | 1.0 | 1.0 | 550 | $2,250 | $4.09 | 22d | 1 | 0.73mi |
| 928 W 83rd St Los Angeles, CA | 1.0 | 1.0 | 550 | $2,000 | $3.64 | 43d | 1 | 0.73mi |
Listing history 5 events
-
2026-06-18days on market $770,000 Active 4 DOM
-
2026-06-17days on market $770,000 Active 3 DOM
-
2026-06-16days on market $770,000 Active 2 DOM
-
2026-06-15remarks 699-char remark
-
2026-06-15$770,000 Active 1 DOM
ⓘ Source: listings_history table (triggers on properties + properties_extension) + one-shot
backfill from property_details.listing_events for pre-trigger history.
Climate risk First Street
- Flood 1/10 Low FEMA zone X (unshaded) · 0% chance over 30 yrs
- Wildfire 1/10 Low
- Heat 5/10 Major 7 d/yr ≥88°F today · 22 d/yr by 30 yrs out
- Wind 1/10 Low
- Air quality 5/10 Major 7 unhealthy d/yr today · 7 by 30 yrs out
Nearby sold comps map
Loading sold comps map…
Walkable amenities ~0.75 mi
Loading nearby amenities…
Taxation est. · year 1
- Rental income
- $189,216
- − Mortgage interest
- −$43,132
- − Property taxes
- −$11,550
- − Insurance
- −$3,850
- − Repairs & maintenance
- −$15,137
- − Management
- −$15,137
- − Depreciation
- −$22,400
- Taxable income
- $78,009
- Est. tax owed @ 24.0%
- −$18,722
- After-tax cash flow
- $66,903/yr
For passive investors: Depreciation is non-cash, so a rental often shows a tax loss while cash-flowing — sheltering income. Rental losses are passive: they offset passive income freely, and up to $25,000/yr can offset ordinary (W-2) income if you actively participate and your MAGI is under $100k (phasing out to $0 by $150k); unused losses carry forward. On sale, claimed depreciation is recaptured at up to 25%, and gains may owe capital-gains tax (a 1031 exchange can defer both). Figures are a year-1 estimate at your 24.0% rate — not tax advice; consult a CPA.
Schools (NCES district)
- District
- Los Angeles Unified
- NCES district ID
- 0622710
- Math proficiency
- 29% ▼ -4.00%
- Reading proficiency
- 54% ▲ 10.00%
- Median HH income
- $50,403
- Composite
- 35.67/100
- National rank
- #4875
- State rank
- #223 of 517 in CA
Livability — Los Angeles
- Score
- 68/100
- State rank
- #273
- US rank
- #9237
Category grades
Schools grade is shown separately in the Schools card above.
Census & demographics
- Census place
- Los Angeles, CA
- County
- Los Angeles County · 9,444,647 people
- City population
- 3,838,149
- Metro
- Los Angeles-Long Beach-Anaheim, CA
- Population (ZIP)
- 94,830
- Household income
- $53,302
- Rent vs Own
- Severe rent burden
- 7490.0
Population outlook (Los Angeles County) Hauer SSP2
- Today (2025)
- 10,940,515 people
- By 2030
- 11,256,481 · +2.9%
- By 2040
- 11,729,929 · +7.2%
- By 2050
- 11,948,407 · +9.2%
- By 2075
- 11,818,114 · +8.0%
- By 2100
- 10,842,928 · -0.9%
Race, ethnicity, and origin ACS 2023
- Neighborhood character
- Predominantly Hispanic (67%)
- Race & ethnicity
- Hispanic / Latino 67% Black 29% Two or more races 23% White 1% Native American 1%
- Hispanic origin (detail)
- Mexican 39%
- Foreign-born
- 34% · Canada
- Languages at home
- 37% English-only · Spanish 62%
Political lean MEDSL · Los Angeles
- 2024 margin
- Solid D (+32.9) · D 64.8% · R 31.9% · Other 3.3%
- 2008→2024 swing
- -7.4pp toward R · 2008: 40.4pp · 2024: 32.9pp
- All cycles
- 2024: D+32.9 2020: D+44.2 2016: D+48.0 2012: D+40.0 2008: D+40.4
Not yet ingested
- Civics
- —
Market trends
- HPI YoY
- ▼ -691.99%
- Current HPI
- 467.9845
- Rent YoY
- ▼ -2.50%
- Metro
- Los Angeles-Long Beach-Anaheim, CA
- State GDP YoY
- ▲ 3.21%
- F500 in state
- 116
Industry mix (Fortune 500 HQ in CA)
| Industry | F500 HQs | Revenue |
|---|---|---|
| Technology | 27 | $1,492B |
|
||
| Financial Services | 3 | $174B |
|
||
| Retail | 3 | $44B |
|
||
| Insurance | 3 | $26B |
|
||
| Media / Entertainment | 2 | $115B |
|
||
| Pharmaceuticals / Biotech | 2 | $62B |
|
||
Price history
+40.0% since first listed8 events — show timeline
- 2026-06-13 Listed $770,000 TheMLS
- 2018-09-27 Listing Removed — SDMLS
- 2018-08-20 Pending — TheMLS
- 2018-08-17 Delisted — TheMLS
- 2018-08-08 Relisted — TheMLS
- 2018-08-01 Pending — TheMLS
- 2018-07-21 Listed $550,000 SDMLS
- 2018-07-21 Listed — TheMLS
Property tax history
+1.7%/yrLatest (2025): $1,044 · +1.2% YoY. Source: county tax records.
Cash-flow waterfall
monthlySold comps — $/sqft
last 12 mo · ≤1 miLoading sold comps…