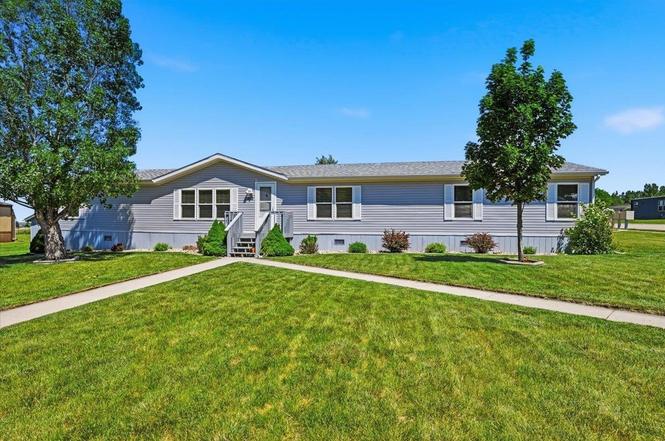
1210 Foothills Dr · Spearfish, SD
Flood risk 1/10 · Minimal
- FEMA flood zone
- A
- Chance of flooding over 30 yrs
- 0.0%
- Est. flood insurance / yr
- $1,009 – $1,996
Fire risk 7/10 · Major
- Est. fire insurance / yr
- $1,342 – $2,492
Heat risk 2/10 · Minimal
- Hot days now (above 90°F)
- 7 days/yr
- Hot days in 30 yrs
- 17 days/yr
Wind risk 2/10 · Minimal
- Chance of severe wind over 30 yrs
- —
Air-quality risk 3/10 · Minor
- Unhealthy air days now
- 2 days/yr
- Unhealthy air days in 30 yrs
- 3 days/yr
Risk factors via First Street. Map © Google.
Why this score? — see what drove the B grade
The composite is a weighted blend of 9 inputs, each scored 0–100. Each bar is that input's sub-score; the figure is the points it added to the 100-point composite (weight × sub-score).
- Cash flow +30.0/30.0
- 1% rule +10.0/10.0
- DSCR +10.0/10.0
- ARV discount +7.5/15.0
- Schools +4.3/10.0
- Livability +3.4/5.0
- Rent growth +2.5/5.0
- Condition / age +2.5/5.0
- Appreciation +0.0/10.0
$120,000
🖨 Deal sheet 📄 Offer letter ✓ Due diligence
Key facts
- Apple trees
- Updated kitchen
- Back deck
Tags
Property features AI
Exterior
- Home design: Manufactured home; Residential property
- Construction: Frame construction; Composition roof
- Exterior features: Deck; Shed(s); Corner lot
Interior
- Kitchen: Dishwasher; Electric range/oven; Refrigerator; Garbage disposal; Water softener
- Flooring: Carpet; Laminate; Vinyl
- Bathrooms: 2 full bathrooms
- Heating & cooling: Natural gas heating; Ceiling fans; Has cooling
- Interior features: Walk-in closets
- Laundry & utility: Laundry on main level; Clothes dryer
Neighborhood map
What this means for you Summary
Snapshot
- This is a 4-bed/4.0-bath manufactured listed at $120k.
Deal economics
- At list price, monthly cash flow is $890 ($11k/yr) — positive.
- The deal already cash-flows at list — no discount required.
- Meets the 1% rule at list price ($2k rent vs $120k).
- Cap rate 16.4% vs local median 2.2% in Spearfish — top-decile yield for the area; either an underpriced asset or a hidden risk that comps aren't pricing in. Stress-test before assuming the spread holds.
Location & tenants
- Location reads 68/100 on livability (#83 in SD) — a middle-class / working-renter tenant base. Strengths: cost of living A+, housing A-, schools B+; Watch: amenities F, commute F.
- Spearfish School District 40-2 (town): math 45% / reading 56% proficiency, ranked #32 of 59 in SD (top 54%) — acceptable for families but not a draw, mixed tenant base, ~2y average lease.
- Market conditions: 288 active listings in the ZIP; 217 units permitted in Lawrence County in 2024 (11 in 5+ unit buildings).
- This rent runs 37% of the median local income ($75k/yr) — at the standard rent-burdened threshold; future hikes will face affordability resistance.
Forward outlook
- Local home prices are declining (-3.0%/yr); year-one equity from $830 of loan paydown is wiped out by about $4k of value loss. Plan a longer hold.
- Lawrence County population projected at +17% by 2050 — long-run rental-demand tailwind backs the buy-and-hold thesis.
- At projected returns (-3.0% appreciation + 3.0% rent growth), your $34k cash investment doubles in ~4 years — after that, you're playing with house money.
Negotiation context
- Only 4 days on market — expect competitive offers; lowballing is unlikely to land.
Risks & watch-outs
- Watch-outs: flood insurance adds $125/mo.
- Climate carrying-cost: in FEMA flood zone A (mandatory federal flood insurance); major wildfire risk — expect insurance premiums to compound above CPI over the hold.
Questions for the listing agent
- What's the actual annual flood-insurance premium (NFIP or private), and is the property in a SFHA with mandatory coverage?
- Is there a deadline driving the sale (1031 exchange, divorce, estate, relocation)? That informs how much negotiation room exists.
- Schools are B-rated — typically a magnet for longer-tenancy family renters. What's the average tenant stay here, and is there a school-zone premium baked into asking?
- What's the average days-on-market for RENTAL listings here right now (not sales)? A rising rental-DOM trend means longer vacancies and softer asking-rent achievability than the comps imply.
- What's the recent tenant-quality profile in this submarket — average credit score on applications, eviction rate, late-payment / NSF rate, and stable-employment percentage? A property-management company in the area should have these aggregated.
- How much new for-sale + rental construction is in the pipeline within 1–3 miles? Heavy new supply typically softens prices + rents 12–24 months out; constrained supply supports both.
Investment metrics
- 1% rule
- 1.92% ✓
- Cap rate
- 16.45%
- Cash-on-cash
- 36.27%
- DSCR
- 2.61
- GRM
- 4.3
CMA / ARV
- ARV (on-the-fly)
- $305,748
- Comps found
- 1
Show comp detail 1 sale within ~0.75 mi
| Address | Dist | Beds/Ba | Sqft | Sold | Price | $/sf | Match |
|---|---|---|---|---|---|---|---|
| 1032 Roughlock Ln | 0.26mi | 3/2.0 (-1) | 2,144 (+4%) | 16mo | $320,000 | $149 | 54 |
Match score weights: distance 35% · size 25% · config 20% · recency 20%. Top-matched comps best support the ARV.
Projected returns pro-forma
-3.0% appreciation · 3.0% rent growth · sell at horizon
- IRR
- 26.8%
- Equity multiple
- 2.11×
- Total profit
- $37,356
- Equity at exit
- $17,892
- IRR
- 34.4%
- Equity multiple
- 4.15×
- Total profit
- $105,932
- Equity at exit
- $10,375
Cash invested: $33,600 (down + closing). Projections, not guarantees.
Landlord ↔ Tenant lean methodology
- Overall (STATE)
- 83 Strongly Landlord-Friendly
- State South Dakota
- 83 Strongly Landlord-Friendly · R+16
- County
- — inherits STATE
- City
- — inherits STATE
ZIP-level market 57783
- Active inventory
- 288
- Price-to-rent
- 4.3×
Monthly cashflow live
- Estimated rent
- $2,300 medium interval (Pro) →
- Mortgage (P&I)
- −$629
- Tax from tax record
- −$122 /mo · $1,467/yr
- Insurance
- −$50
- Flood insurance flood zone
- −$125 /mo · $1,502/yr
- HOA
- −$0
- Vacancy / Maint / Mgmt
- −$483
- Net cashflow
- $890
Break-even live
UW: 25.0% down · 7.5% · 30yr · 1.5% tax · 5.0% vac · 8.0% maint · 8.0% mgmt
Financing live
Cash to close
- Down payment
- $30,000
- Closing costs
- $3,600
- Reserves months
- —
- Total cash needed
- —
Loan-product check · same deal, 3 products live
Conventional
25% down · 7.5% · 30yr
- Down + closing
- —
- Monthly P&I
- —
- Monthly cashflow
- —
- DSCR
- —
- Eligible?
- —
Personal DTI + credit; lowest rate.
DSCR
20% down · 8.5% · 30yr
- Down + closing
- —
- Monthly P&I
- —
- Monthly cashflow
- —
- DSCR
- —
- Eligible?
- —
No personal income docs; deal must DSCR.
Hard money
10% down · 12.0% · 12mo
- Down + closing
- —
- Monthly P&I
- —
- Monthly cashflow
- —
- DSCR
- —
- Eligible?
- —
Short-term bridge; refi at stabilization.
Listing history 4 events
-
2026-06-19days on market $120,000 Active 4 DOM
-
2026-06-18days on market $120,000 Active 3 DOM
-
2026-06-17days on market $120,000 Active 2 DOM
-
2026-06-16$120,000 Active 1 DOM
ⓘ Source: listings_history table (triggers on properties + properties_extension) + one-shot
backfill from property_details.listing_events for pre-trigger history.
Tax reassessment forecast SD · Resets to sale price
- Current annual tax
- $1,467 · $122/mo
- Projected year-2 tax
- $1,572 · $131/mo
- Expected delta
- +$105/yr (+$9/mo · 7.2%)
ⓘ Screening estimate from a state-policy table — verify with the county assessor before closing.
Climate risk First Street
- Flood 1/10 Low FEMA zone A · 0% chance over 30 yrs
- Wildfire 7/10 Severe
- Heat 2/10 Low 7 d/yr ≥90°F today · 17 d/yr by 30 yrs out
- Wind 2/10 Low
- Air quality 3/10 Moderate 2 unhealthy d/yr today · 3 by 30 yrs out
Nearby sold comps map
Loading sold comps map…
Walkable amenities ~0.75 mi
Loading nearby amenities…
Taxation est. · year 1
- Rental income
- $27,602
- − Mortgage interest
- −$6,722
- − Property taxes
- −$1,467
- − Insurance
- −$2,102
- − Repairs & maintenance
- −$2,208
- − Management
- −$2,208
- − Depreciation
- −$3,491
- Taxable income
- $9,403
- Est. tax owed @ 24.0%
- −$2,257
- After-tax cash flow
- $8,427/yr
For passive investors: Depreciation is non-cash, so a rental often shows a tax loss while cash-flowing — sheltering income. Rental losses are passive: they offset passive income freely, and up to $25,000/yr can offset ordinary (W-2) income if you actively participate and your MAGI is under $100k (phasing out to $0 by $150k); unused losses carry forward. On sale, claimed depreciation is recaptured at up to 25%, and gains may owe capital-gains tax (a 1031 exchange can defer both). Figures are a year-1 estimate at your 24.0% rate — not tax advice; consult a CPA.
Schools (NCES district)
- District
- Spearfish School District 40-2
- NCES district ID
- 4666930
- Math proficiency
- 45% ▼ -3.00%
- Reading proficiency
- 56% ▲ 1.00%
- Median HH income
- $43,524
- Composite
- 42.54/100
- National rank
- #3199
- State rank
- #32 of 59 in SD
Livability — Spearfish
- Score
- 68/100
- State rank
- #83
- US rank
- #9525
Category grades
Schools grade is shown separately in the Schools card above.
Census & demographics
- Census place
- Spearfish, SD
- County
- Lawrence County · 17,248 people
- City population
- 17,248
- Metro
- Spearfish, SD
- Population (ZIP)
- 17,248
- Household income
- $74,844
- Rent vs Own
- Severe rent burden
- 580.0
Population outlook (Lawrence County) Hauer SSP2
- Today (2025)
- 27,092 people
- By 2030
- 28,137 · +3.9%
- By 2040
- 29,908 · +10.4%
- By 2050
- 31,789 · +17.3%
- By 2075
- 38,917 · +43.6%
- By 2100
- 50,407 · +86.1%
Race, ethnicity, and origin ACS 2023
- Neighborhood character
- Predominantly White (89%)
- Race & ethnicity
- White 89% Two or more races 4% Hispanic / Latino 3% Native American 3%
- Common ancestry
- Portuguese 12% Iranian 3% Serbian 2%
- Foreign-born
- 3% · Canada, China
- Languages at home
- 94% English-only · Spanish 3% German/W. Germanic 1%
Political lean MEDSL · Lawrence
- 2024 margin
- Solid R (+31.3) · D 32.9% · R 64.3% · Other 2.8%
- 2008→2024 swing
- -15.9pp toward R · 2008: -15.4pp · 2024: -31.3pp
- All cycles
- 2024: R+31.3 2020: R+30.5 2016: R+34.2 2012: R+26.9 2008: R+15.4
Not yet ingested
- Civics
- —
Market trends
- HPI YoY
- ▼ -174.59%
- Current HPI
- 206.2001
- Rent YoY
- —
- Metro
- Spearfish, SD
- State GDP YoY
- ▲ 0.70%
- F500 in state
- 2
Industry mix (Fortune 500 HQ in SD)
| Industry | F500 HQs | Revenue |
|---|---|---|
| Utilities | 1 | $1B |
|
||
Price history
1 event — show timeline
- 2026-06-15 Listed $120,000 MRAOR
Property tax history
+4.4%/yrLatest (2025): $1,467 · -1.8% YoY. Source: county tax records.
Cash-flow waterfall
monthlySold comps — $/sqft
last 12 mo · ≤1 miLoading sold comps…