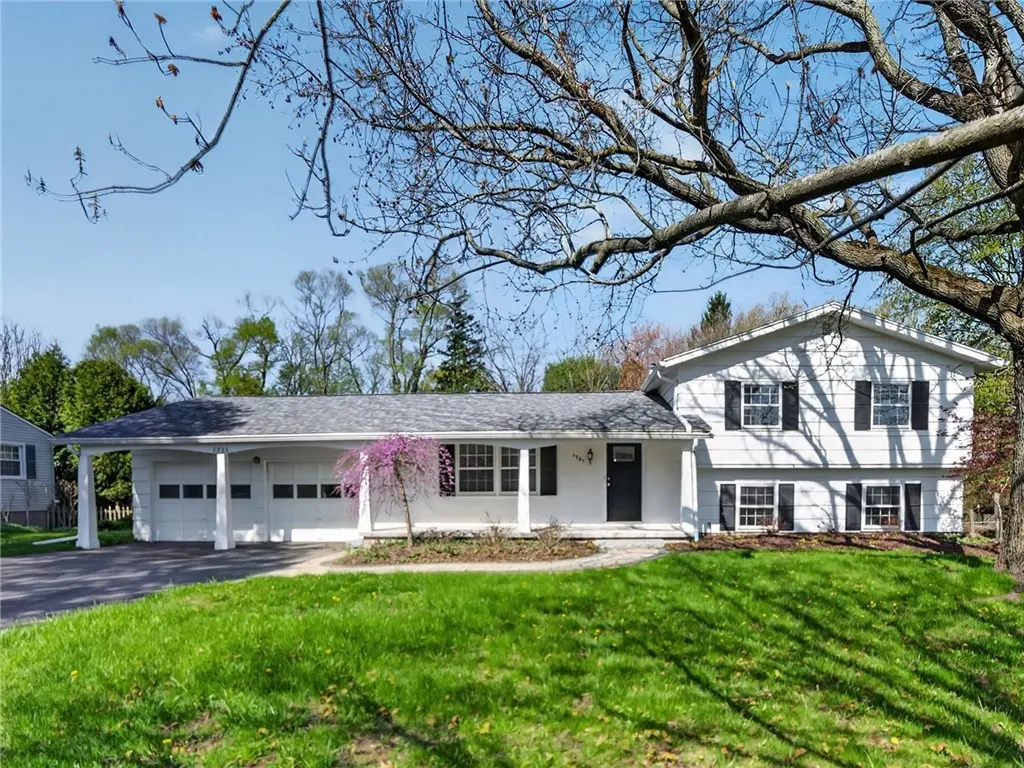
1731 Baird Rd · East Rochester, NY
Flood risk 1/10 · Minimal
- FEMA flood zone
- X (unshaded)
- Chance of flooding over 30 yrs
- 0.0%
- Est. flood insurance / yr
- $473 – $860
Fire risk 3/10 · Minor
- Est. fire insurance / yr
- $691 – $1,283
Heat risk 2/10 · Minimal
- Hot days now (above 95°F)
- 7 days/yr
- Hot days in 30 yrs
- 15 days/yr
Wind risk 1/10 · Minimal
- Chance of severe wind over 30 yrs
- —
Air-quality risk 2/10 · Minimal
- Unhealthy air days now
- 1 days/yr
- Unhealthy air days in 30 yrs
- 2 days/yr
Risk factors via First Street. Map © Google.
Why this score? — see what drove the D grade
The composite is a weighted blend of 9 inputs, each scored 0–100. Each bar is that input's sub-score; the figure is the points it added to the 100-point composite (weight × sub-score).
- ARV discount +15.0/15.0
- Cash flow +7.5/30.0
- Schools +6.8/10.0
- Livability +3.9/5.0
- 1% rule +3.5/10.0
- Rent growth +2.5/5.0
- Condition / age +2.5/5.0
- DSCR +1.6/10.0
- Appreciation +0.0/10.0
$234,900
🖨 Deal sheet (PDF) 📄 Offer letter ✓ Due diligence
Listing remarks
Delayed Negotiations Wednesday 5/13/2026 at noon. This split-level style residence is situated on a generous size 0.75 acre site. 4 car garage will please the car Lovers! Add your decorating touches and make this your Home Sweet Home! The home's family room has a wood burning stove, dining area adjacent to the kitchen with a slider leading to the two tiered patio. Some of the upgrades include: Front porch, floor: New concrete poured 2020, to the base (replaced old cracked floor). * Front walkway construction: 2020 * Upright posts, new construction, 2020 * Driveway, all new to the base, (NOT just a "coverup") , 2020 * Roof: All new, and a tear off, 2019 * Gutters All
Key facts
- Two tiered patio
- New kitchen
- New kitchen window
Tags
Property features AI
Finance
- Other: Rectangular lot approximately 0.75 acres (dimensions 101 x 300); Main thoroughfare road frontage
Exterior
- Parking: Attached garage with 4 spaces; Driveway parking; Garage has electricity
- Utilities: Electricity connected with circuit breakers; Public water connected; Sewer connected (also mentions holding tank); High-speed internet available
- Home design: 3 stories; Existing property condition
- Construction: Cedar and shake siding; Copper plumbing; Asphalt architectural shingle roof; Block foundation; Partial finished below-grade area
- Exterior features: Blacktop driveway; Partial fencing; Patio
Interior
- Kitchen: Electric oven; Electric range; Range hood; Refrigerator; Exhaust fan
- Bedrooms: Total rooms include living and family spaces (see room types)
- Flooring: Carpet; Ceramic tile; Laminate; Varied flooring
- Bathrooms: 2 full bathrooms
- Heating & cooling: Gas forced-air heating; Central air conditioning
- Interior features: Breakfast bar; Ceiling fans; Dining area; Eat-in kitchen; Separate/formal living room; Programmable thermostat; Workshop; Thermal windows
- Laundry & utility: Laundry located in the basement; Gas water heater
Neighborhood map
What this means for you Summary
Snapshot
- This is a 3-bed/2.0-bath single-family listed at $235k.
Deal economics
- At list price, monthly cash flow is $-292 ($-3k/yr) — negative.
- To cash-flow at today's rent, offer at most $183k (21.9% below list).
- To meet the 1% rule (rent ≥ 1% of price), the offer needs to be $200k (15.1% below list).
- Recommended offer: $183k (21.9% below list) — sets the bar for cash-flow.
Location & tenants
- Location reads 78/100 on livability (#155 in NY, #2,400 nationally) — a middle-class / working-renter tenant base. Strengths: amenities A+, cost of living A+, housing A+; Watch: employment D+, crime D.
- Penfield Central School District (suburban): math 77% / reading 79% proficiency, ranked #67 of 590 in NY (top 11%) — strong family-tenant draw, lease renewals of 3-5y typical; only 11% free/reduced lunch — higher-income household profile.
- Market conditions: 113 active listings in the ZIP; high-income renter base; 1,169 units permitted in Monroe County in 2024 (591 in 5+ unit buildings).
Forward outlook
- Local home prices are declining (-3.0%/yr); year-one equity from $2k of loan paydown is wiped out by about $7k of value loss. Plan a longer hold.
- Monroe County population projected to shrink 6% by 2050 — rents likely to lag national; underwrite the cash flow, not the appreciation.
Negotiation context
- Only 8 days on market — expect competitive offers; lowballing is unlikely to land.
- Current owner paid $115k; list at $235k implies a 104% gain — meaningful room to come down on a strong offer.
Risks & watch-outs
- Watch-outs: property tax is 2.7% of price; built in 1959 — expect roof / HVAC / electrical / plumbing capex.
Questions for the listing agent
- What do current leases actually rent for vs. the listed asking? Can we see a recent rent roll and the last 12 months of T-12 income?
- Built in 1959 — when were the roof, HVAC, electrical panel, plumbing, and water heater last replaced?
- Property tax is high relative to price — has the assessment been appealed recently, and will the sale trigger a re-assessment?
- Is there a deadline driving the sale (1031 exchange, divorce, estate, relocation)? That informs how much negotiation room exists.
- Schools are A-rated — typically a magnet for longer-tenancy family renters. What's the average tenant stay here, and is there a school-zone premium baked into asking?
- Crime grade is D in this area — have there been break-ins, vandalism, or insurance claims at this property in the last 3 years? What carrier currently insures it and at what premium?
- The area grade is low — what's the realistic commute time and amenity access for the typical tenant pool here? Any planned neighborhood developments (good or bad) we should know about?
- What's the average days-on-market for RENTAL listings here right now (not sales)? A rising rental-DOM trend means longer vacancies and softer asking-rent achievability than the comps imply.
- What's the recent tenant-quality profile in this submarket — average credit score on applications, eviction rate, late-payment / NSF rate, and stable-employment percentage? A property-management company in the area should have these aggregated.
- How much new for-sale + rental construction is in the pipeline within 1–3 miles? Heavy new supply typically softens prices + rents 12–24 months out; constrained supply supports both.
Investment metrics
- 1% rule
- 0.85% ✗
- Cap rate
- 4.80%
- Cash-on-cash
- -5.32%
- DSCR
- 0.76
- GRM
- 9.8
CMA / ARV
- ARV (median comp)
- $431,278
- List price
- $234,900
- Delta
- -45.53%
- Verdict
- UNDERPRICED
- Comps
- 20 within 1.0 mi
Show comp detail 9 sales within ~0.75 mi
| Address | Dist | Beds/Ba | Sqft | Sold | Price | $/sf | Match |
|---|---|---|---|---|---|---|---|
| 3 Saldo Ln | 0.15mi | 3/2.5 | 2,112 (+11%) | 5mo | $403,000 | $191 | 68 |
| 203 Timber Brook Ln | 0.61mi | 4/1.5 (+1) | 1,849 (-2%) | 3mo | $415,000 | $224 | 58 |
| 1725 Baird Rd | 0.04mi | 4/1.5 (+1) | 1,635 (-14%) | 15mo | $313,000 | $191 | 56 |
| 2892 Atlantic Ave | 0.30mi | 3/2.5 | 2,037 (+7%) | 23mo | $362,000 | $178 | 52 |
| 2918 Atlantic Ave | 0.19mi | 4/2.0 (+1) | 2,154 (+14%) | 21mo | $200,000 | $93 | 46 |
| 179 Timber Brook Ln | 0.64mi | 3/1.5 | 1,739 (-8%) | 11mo | $352,000 | $202 | 45 |
| 24 Pennicott Cir | 0.67mi | 3/2.0 | 2,132 (+12%) | 10mo | $418,000 | $196 | 40 |
| 22 Pennicott Cir | 0.65mi | 3/2.0 | 1,716 (-10%) | 17mo | $363,000 | $212 | 39 |
| 15 Willowbend Dr | 0.68mi | 4/2.0 (+1) | 2,156 (+14%) | 19mo | $275,000 | $128 | 25 |
Match score weights: distance 35% · size 25% · config 20% · recency 20%. Top-matched comps best support the ARV.
Projected returns pro-forma
-3.0% appreciation · 3.0% rent growth · sell at horizon
- IRR
- -25.3%
- Equity multiple
- 0.14×
- Total profit
- $-56,456
- Equity at exit
- $35,024
- IRR
- -21.1%
- Equity multiple
- -0.10×
- Total profit
- $-72,344
- Equity at exit
- $20,310
Cash invested: $65,772 (down + closing). Projections, not guarantees.
Landlord ↔ Tenant lean methodology
- Overall (STATE)
- 15 Strongly Tenant-Friendly
- State New York
- 15 Strongly Tenant-Friendly · D+10
- County
- — inherits STATE
- City
- — inherits STATE
ZIP-level market 14526
- Active inventory
- 113
- Price-to-rent
- 9.8×
Monthly cashflow live
- Estimated rent
- $1,995 medium interval (Pro) →
- Mortgage (P&I)
- −$1,232
- Tax from tax record
- −$538 /mo · $6,458/yr
- Insurance
- −$98
- HOA
- −$0
- Vacancy / Maint / Mgmt
- −$419
- Net cashflow
- $-292
Break-even live
Sensitivity live
| Price | -10% $-159 | -5% $-225 | +0% $-292 | +5% $-358 | +10% $-425 |
|---|---|---|---|---|---|
| Rent | -10% $-449 | -5% $-370 | +0% $-292 | +5% $-213 | +10% $-134 |
| Rate | -1.0pp $-173 | -0.5pp $-232 | base $-292 | +0.5pp $-352 | +1.0pp $-414 |
UW: 25.0% down · 7.5% · 30yr · 1.5% tax · 5.0% vac · 8.0% maint · 8.0% mgmt
Financing live
Cash to close
- Down payment
- $58,725
- Closing costs
- $7,047
- Reserves months
- —
- Total cash needed
- —
Loan-product check · same deal, 3 products live
Conventional
25% down · 7.5% · 30yr
- Down + closing
- —
- Monthly P&I
- —
- Monthly cashflow
- —
- DSCR
- —
- Eligible?
- —
Personal DTI + credit; lowest rate.
DSCR
20% down · 8.5% · 30yr
- Down + closing
- —
- Monthly P&I
- —
- Monthly cashflow
- —
- DSCR
- —
- Eligible?
- —
No personal income docs; deal must DSCR.
Hard money
10% down · 12.0% · 12mo
- Down + closing
- —
- Monthly P&I
- —
- Monthly cashflow
- —
- DSCR
- —
- Eligible?
- —
Short-term bridge; refi at stabilization.
Listing history 3 events
-
2026-05-14status Pending 2266-char remark
-
2026-05-06$234,900 Active 2266-char remark
-
1994-09-15soldstatus $115,000
ⓘ Source: listings_history table (triggers on properties + properties_extension) + one-shot
backfill from property_details.listing_events for pre-trigger history.
Tax reassessment forecast NY · Partial reset (capped growth)
- Current annual tax
- $6,458 · $538/mo
- Projected year-2 tax
- $6,458 · $538/mo
- Expected delta
- $0/yr ($0/mo · 0.0%)
ⓘ Screening estimate from a state-policy table — verify with the county assessor before closing.
Climate risk First Street
- Flood 1/10 Low FEMA zone X (unshaded) · 0% chance over 30 yrs
- Wildfire 3/10 Moderate
- Heat 2/10 Low 7 d/yr ≥95°F today · 15 d/yr by 30 yrs out
- Wind 1/10 Low
- Air quality 2/10 Low 1 unhealthy d/yr today · 2 by 30 yrs out
Nearby sold comps map
Loading sold comps map…
Walkable amenities ~0.75 mi
Loading nearby amenities…
Taxation est. · year 1
- Rental income
- $23,944
- − Mortgage interest
- −$13,158
- − Property taxes
- −$6,458
- − Insurance
- −$1,174
- − Repairs & maintenance
- −$1,916
- − Management
- −$1,916
- − Depreciation
- −$6,833
- Taxable loss
- −$7,512
- Est. tax savings @ 24.0%
- +$1,803
- After-tax cash flow
- $-1,697/yr
For passive investors: Depreciation is non-cash, so a rental often shows a tax loss while cash-flowing — sheltering income. Rental losses are passive: they offset passive income freely, and up to $25,000/yr can offset ordinary (W-2) income if you actively participate and your MAGI is under $100k (phasing out to $0 by $150k); unused losses carry forward. On sale, claimed depreciation is recaptured at up to 25%, and gains may owe capital-gains tax (a 1031 exchange can defer both). Figures are a year-1 estimate at your 24.0% rate — not tax advice; consult a CPA.
Schools (NCES district)
- District
- Penfield Central School District
- NCES district ID
- 3622710
- Math proficiency
- 77% ▼ -3.00%
- Reading proficiency
- 79% ▲ 10.00%
- Median HH income
- $74,802
- Composite
- 68.37/100
- National rank
- #347
- State rank
- #67 of 590 in NY
Livability — East Rochester
- Score
- 78/100
- State rank
- #155
- US rank
- #2400
Category grades
Schools grade is shown separately in the Schools card above.
Census & demographics
- County
- Monroe County · 674,131 people
- City population
- 7,529
- Metro
- Rochester, NY
- Population (ZIP)
- 19,629
- Household income
- $118,777
- Rent vs Own
- Severe rent burden
- 234.0
Population outlook (Monroe County) Hauer SSP2
- Today (2025)
- 759,460 people
- By 2030
- 757,154 · -0.3%
- By 2040
- 740,644 · -2.5%
- By 2050
- 714,443 · -5.9%
- By 2075
- 645,883 · -15.0%
- By 2100
- 547,084 · -28.0%
Race, ethnicity, and origin ACS 2023
- Neighborhood character
- Predominantly White (87%)
- Race & ethnicity
- White 87% Two or more races 7% Hispanic / Latino 5% Asian 2%
- Hispanic origin (detail)
- Puerto Rican 1% Cuban 1%
- Common ancestry
- Romanian 5% Slovak 4% Italian 2%
- Foreign-born
- 8% · Canada, China, Dominican Republic
- Languages at home
- 93% English-only · Other Indo-European 2% Spanish 2% Russian/Polish/Slavic 1%
Political lean MEDSL · Monroe
- 2024 margin
- D (+19.1) · D 59.5% · R 40.5%
- 2008→2024 swing
- +1.4pp toward D · 2008: 17.7pp · 2024: 19.1pp
- All cycles
- 2024: D+19.1 2020: D+21.0 2016: D+14.1 2012: D+17.4 2008: D+17.7
Not yet ingested
- Civics
- —
Market trends
- HPI YoY
- ▼ -149.19%
- Current HPI
- 271.8476
- Rent YoY
- —
- Metro
- Rochester, NY
- State GDP YoY
- ▲ 2.60%
- F500 in state
- 92
Industry mix (Fortune 500 HQ in NY)
| Industry | F500 HQs | Revenue |
|---|---|---|
| Financial Services | 10 | $950B |
|
||
| Consumer Goods | 9 | $162B |
|
||
| Insurance | 4 | $225B |
|
||
| Telecommunications | 2 | $144B |
|
||
| Pharmaceuticals | 2 | $112B |
|
||
| Media / Entertainment | 2 | $69B |
|
||
Price history
+104.3% since first listed3 events — show timeline
- 2026-05-14 Pending — UNYREIS
- 2026-05-06 Listed $234,900 UNYREIS
- 1994-09-15 Sold (Public Records) $115,000 Public Records
Property tax history
+2.1%/yrLatest (2025): $6,458 · +4.8% YoY. Source: county tax records.
Cash-flow waterfall
monthlySold comps — $/sqft
last 12 mo · ≤1 miLoading sold comps…