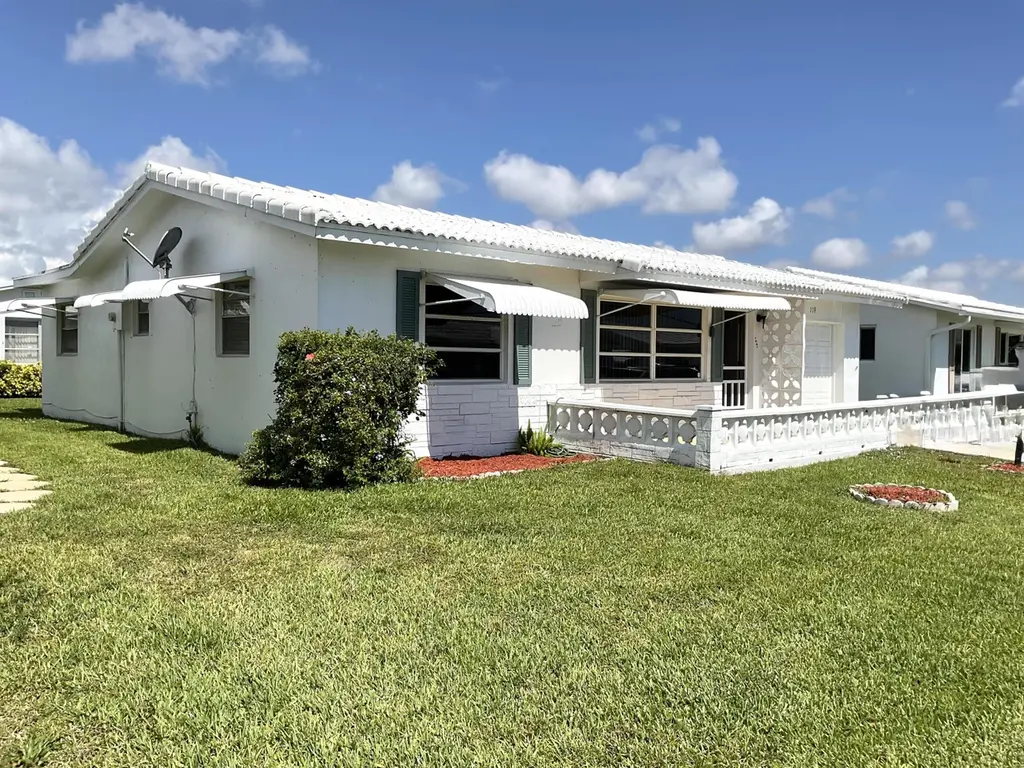
119 SW 10th Ct · Boynton Beach, FL
Flood risk 5/10 · Moderate
- FEMA flood zone
- X (unshaded)
- Chance of flooding over 30 yrs
- 0.36%
- Est. flood insurance / yr
- $507 – $1,088
Fire risk 1/10 · Minimal
- Est. fire insurance / yr
- $947 – $1,759
Heat risk 9/10 · Severe
- Hot days now (above 105°F)
- 7 days/yr
- Hot days in 30 yrs
- 23 days/yr
Wind risk 10/10 · Severe
- Chance of severe wind over 30 yrs
- 99.0%
Air-quality risk 2/10 · Minimal
- Unhealthy air days now
- 1 days/yr
- Unhealthy air days in 30 yrs
- 2 days/yr
Risk factors via First Street. Map © Google.
Why this score? — see what drove the D+ grade
The composite is a weighted blend of 9 inputs, each scored 0–100. Each bar is that input's sub-score; the figure is the points it added to the 100-point composite (weight × sub-score).
- Cash flow +16.2/30.0
- ARV discount +7.5/15.0
- DSCR +5.0/10.0
- Schools +4.3/10.0
- 1% rule +4.1/10.0
- Livability +3.6/5.0
- Rent growth +2.7/5.0
- Condition / age +2.5/5.0
- Appreciation +0.0/10.0
$250,000
🖨 Deal sheet (PDF) 📄 Offer letter ✓ Due diligence
Listing remarks
2 bedrooom 2 full baths, Fairmont model with good bones ready for your updates newer interior doors, crown molding, hurricane rated garage door, double driveway and AC 2025. Nice open front porch and large patio in the back on a great street in a vibrant 55+ community with many clubs, leagues, 3 clubhouses with heated pools, beautifully maintained 18 hole golf course free to owners and a full exercise facility. PAID REC LEASE!!
Key facts
- Heated pools
- Open front porch
- Good sized patio
Tags
Property features AI
Finance
- Other: Senior community
- Financial info: Land is not leased; Pets allowed with no restrictions
- HOA & community: Association: Campbell Property; Monthly HOA fee of $187; HOA covers common areas, golf, reserve funds, recreation facilities and pool service; Association amenities include clubhouse, fitness center, pool (heated), sauna, billiard room, game room, shuffleboard, bocce ball, putting green, kitchen facilities, library, workshop area, community/recreation rooms
Exterior
- Parking: 3 parking spaces total; Attached 1-car garage with garage door opener; 1 covered parking space; Driveway
- Security: Smoke detectors; Security patrol
- Utilities: Public water; Public sewer; Electricity connected; Underground utilities; Water connected
- Home design: Single-family residence; One story; Resale property; Faces east; Builder model: Fairmont
- Construction: Block, stucco, CBS and stone construction; Concrete, flat and tile roofing; Block foundation; Built as Fairmont model
- Exterior features: Not waterfront; Directions provided for property access
Interior
- Kitchen: Disposal; Dishwasher; Electric range; Microwave; Refrigerator
- Bedrooms: 2 bedrooms on the main level
- Flooring: Laminate; Tile; Wood
- Bathrooms: 2 full bathrooms on the main level
- Heating & cooling: Central electric heating; Central electric cooling; Ceiling fans
- Interior features: Walk-in closets; Split bedroom layout; Unfurnished; Blinds on windows; Satellite dish
- Laundry & utility: Laundry area in the garage
Neighborhood map
What this means for you Summary
Snapshot
- This is a 2-bed/2.0-bath single-family listed at $250k.
Deal economics
- At list price, monthly cash flow is $133 ($2k/yr) — positive.
- The deal already cash-flows at list — no discount required.
- To meet the 1% rule (rent ≥ 1% of price), the offer needs to be $227k (9.2% below list).
- Recommended offer: $227k (9.2% below list) — sets the bar for 1% rule.
- Cap rate 6.9% vs local median 4.3% in Boynton Beach — top-decile yield for the area; either an underpriced asset or a hidden risk that comps aren't pricing in. Stress-test before assuming the spread holds.
Location & tenants
- Location reads 72/100 on livability (#351 in FL) — a middle-class / working-renter tenant base. Strengths: housing A+, health & safety B+, cost of living B; Watch: amenities D+, crime D-, commute F.
- Palm Beach (suburban): math 46% / reading 53% proficiency, ranked #34 of 73 in FL (top 47%) — families likely to look elsewhere, expect single-tenant / working-renter base with shorter leases.
- Zoned schools: Galaxy Elementary School (math 36% / reading 39%, grade F, #1,596 of 2,144 statewide, top 75%, 617 students, 87% FRL); Congress Community Middle School (math 21% / reading 28%, grade F, #522 of 571 statewide, top 93%, 988 students, 72% FRL); Boynton Beach Community High (math 13% / reading 25%, grade F, #565 of 667 statewide, top 85%, 1,547 students, 65% FRL) — zoned schools average 75% FRL vs 52% district-wide (23 pts higher); higher-poverty schools than district average — tighter screening recommended.
- Zoned-school proficiency averages 27% at this address vs 50% district-wide (-22 pts) — the specific schools serving this property underperform the Palm Beach average; the district grade overstates school quality for this exact location.
- Market conditions: Rents flat; 232 active listings in the ZIP; 40 comparable units currently listed for rent nearby; rentals at typical pace (median 16d on market — plan ~3-4 weeks tenant-placement turnaround); 3,974 units permitted in Palm Beach County in 2024 (1,012 in 5+ unit buildings).
- This rent runs 37% of the median local income ($74k/yr) — at the standard rent-burdened threshold; future hikes will face affordability resistance.
Forward outlook
- Local home prices are declining (-3.0%/yr); year-one equity from $2k of loan paydown is wiped out by about $8k of value loss. Plan a longer hold.
- Palm Beach County population projected at +30% by 2050 — long-run rental-demand tailwind backs the buy-and-hold thesis.
Negotiation context
- It's been on market 37 days — a 3% lower offer ($242k) is reasonable based on typical stale-listing flexibility.
- Current owner paid $42k; list at $250k implies a 495% gain — meaningful room to come down on a strong offer.
Risks & watch-outs
- Climate carrying-cost: moderate flood risk; severe wind risk, 99% chance of damaging wind over 30y; extreme-heat days projected 7→23/yr by 2055 (HVAC capex compounding) — expect insurance premiums to compound above CPI over the hold.
Questions for the listing agent
- It's been on market 37 days. Have you received any prior offers? Is the seller open to a 9% concession, seller financing, or rate buy-down credit?
- Built in 1970 — when were the roof, HVAC, electrical panel, plumbing, and water heater last replaced?
- What does the HOA fee cover, when was the last increase, and are there any pending special assessments or reserve-fund shortfalls?
- Is there a deadline driving the sale (1031 exchange, divorce, estate, relocation)? That informs how much negotiation room exists.
- Crime grade is D in this area — have there been break-ins, vandalism, or insurance claims at this property in the last 3 years? What carrier currently insures it and at what premium?
- The area grade is low — what's the realistic commute time and amenity access for the typical tenant pool here? Any planned neighborhood developments (good or bad) we should know about?
- What's the average days-on-market for RENTAL listings here right now (not sales)? A rising rental-DOM trend means longer vacancies and softer asking-rent achievability than the comps imply.
- What's the recent tenant-quality profile in this submarket — average credit score on applications, eviction rate, late-payment / NSF rate, and stable-employment percentage? A property-management company in the area should have these aggregated.
- How much new for-sale + rental construction is in the pipeline within 1–3 miles? Heavy new supply typically softens prices + rents 12–24 months out; constrained supply supports both.
Investment metrics
- 1% rule
- 0.91% ✗
- Cap rate
- 6.93%
- Cash-on-cash
- 2.28%
- DSCR
- 1.10
- GRM
- 9.2
CMA / ARV
No comps found within radius.
Projected returns pro-forma
-3.0% appreciation · 0.93% rent growth · sell at horizon
- IRR
- -15.0%
- Equity multiple
- 0.48×
- Total profit
- $-36,678
- Equity at exit
- $37,276
- IRR
- -10.1%
- Equity multiple
- 0.44×
- Total profit
- $-39,290
- Equity at exit
- $21,615
Cash invested: $70,000 (down + closing). Projections, not guarantees.
Landlord ↔ Tenant lean methodology
- Overall (STATE)
- 87 Strongly Landlord-Friendly
- State Florida
- 87 Strongly Landlord-Friendly · R+3
- County
- — inherits STATE
- City
- — inherits STATE
ZIP-level market 33426
- Rents YoY
- 0.9%
- Active inventory
- 232
- Price-to-rent
- 9.2×
Monthly cashflow live
- Estimated rent
- $2,269 high interval (Pro) →
- Mortgage (P&I)
- −$1,311
- Tax from tax record
- −$57 /mo · $690/yr
- Insurance
- −$104
- HOA
- −$187
- Vacancy / Maint / Mgmt
- −$477
- Net cashflow
- $133
Break-even live
Sensitivity live
| Price | -10% $275 | -5% $204 | +0% $133 | +5% $62 | +10% $-9 |
|---|---|---|---|---|---|
| Rent | -10% $-46 | -5% $43 | +0% $133 | +5% $223 | +10% $312 |
| Rate | -1.0pp $259 | -0.5pp $197 | base $133 | +0.5pp $68 | +1.0pp $2 |
UW: 25.0% down · 7.5% · 30yr · 1.5% tax · 5.0% vac · 8.0% maint · 8.0% mgmt
Financing live
Cash to close
- Down payment
- $62,500
- Closing costs
- $7,500
- Reserves months
- —
- Total cash needed
- —
Loan-product check · same deal, 3 products live
Conventional
25% down · 7.5% · 30yr
- Down + closing
- —
- Monthly P&I
- —
- Monthly cashflow
- —
- DSCR
- —
- Eligible?
- —
Personal DTI + credit; lowest rate.
DSCR
20% down · 8.5% · 30yr
- Down + closing
- —
- Monthly P&I
- —
- Monthly cashflow
- —
- DSCR
- —
- Eligible?
- —
No personal income docs; deal must DSCR.
Hard money
10% down · 12.0% · 12mo
- Down + closing
- —
- Monthly P&I
- —
- Monthly cashflow
- —
- DSCR
- —
- Eligible?
- —
Short-term bridge; refi at stabilization.
Rent comps 40 comps
| Address | Beds | Baths | Sqft | Rent | $/sqft | DOM | Units | Dist |
|---|---|---|---|---|---|---|---|---|
| 108 SW 9th St Boynton Beach, FL | 2.0 | 1.5 | 1080 | $2,900 | $2.69 | 26d | 1 | 0.06mi |
| 1009 SW 3rd Way Boynton Beach, FL | 2.0 | 1.0 | 1050 | $2,200 | $2.10 | 7d | 1 | 0.11mi |
| 806 Ocean Dr Boynton Beach, FL | 2.0 | 1.0 | 1012 | $2,100 | $2.08 | 26d | 1 | 0.13mi |
| 123 SW 13th St Boynton Beach, FL | 2.0 | 1.0 | 1044 | $2,275 | $2.18 | 26d | 1 | 0.14mi |
| 1575 SW 8th St Boynton Beach, FL | 1.0–3.0 | 1.0–2.0 | 1104 | $2,288 | $2.07 | 0d | 23 | 0.36mi |
| 100 Newlake Dr Boynton Beach, FL | 1.0–3.0 | 1.0–2.0 | 1261 | $2,514 | $1.99 | 0d | 22 | 0.37mi |
| 815 Boynton Beach Blvd Unit 12-106 Boynton Beach, FL | 2.0 | 2.0 | 887 | $2,500 | $2.82 | 5d | 1 | 0.42mi |
| 815 W Boynton Beach Blvd Boynton Beach, FL | 2.0 | 2.0 | 885 | $2,250 | $2.54 | 4d | 4 | 0.43mi |
| 815 Boynton Beach Blvd Unit 2-106 Boynton Beach, FL | 2.0 | 2.0 | 887 | $1,800 | $2.03 | 9d | 1 | 0.43mi |
| 815 Boynton Beach Blvd Unit 10-203 Boynton Beach, FL | 2.0 | 2.0 | 1104 | $1,850 | $1.68 | 26d | 1 | 0.46mi |
| 815 Boynton Beach Blvd Unit 14-102 Boynton Beach, FL | 1.0 | 1.0 | 768 | $1,800 | $2.34 | 6d | 1 | 0.46mi |
| 815 Boynton Beach Blvd Unit 6-104 Boynton Beach, FL | 1.0 | 1.0 | 791 | $1,850 | $2.34 | 12d | 1 | 0.46mi |
| 815 Boynton Beach Blvd Unit 14-106 Boynton Beach, FL | 2.0 | 2.0 | 887 | $2,250 | $2.54 | 26d | 1 | 0.46mi |
| 815 Boynton Beach Blvd Unit 14-106 Boynton Beach, FL | 2.0 | 2.0 | 887 | $2,050 | $2.31 | 14d | 1 | 0.46mi |
| 815 Boynton Beach Blvd Unit 11-202 Boynton Beach, FL | 2.0 | 2.0 | 994 | $2,000 | $2.01 | 26d | 1 | 0.46mi |
| 815 Boynton Beach Blvd Unit 15-203 Boynton Beach, FL | 2.0 | 2.0 | 884 | $2,200 | $2.49 | 26d | 1 | 0.48mi |
| 815 Boynton Beach Blvd Unit 12-101 Boynton Beach, FL | 2.0 | 2.0 | 887 | $1,900 | $2.14 | 26d | 1 | 0.52mi |
| 815 Boynton Beach Blvd Unit 10-205 Boynton Beach, FL | 2.0 | 2.0 | 884 | $1,800 | $2.04 | 4d | 1 | 0.52mi |
| 815 Boynton Beach Blvd Unit 16-205 Boynton Beach, FL | 2.0 | 2.0 | 884 | $2,150 | $2.43 | 12d | 1 | 0.52mi |
| 815 Boynton Beach Blvd Unit 10-205 Boynton Beach, FL | 2.0 | 2.0 | 884 | $1,900 | $2.15 | 20d | 1 | 0.52mi |
| 2001 W Woolbright Rd Unit F204 Boynton Beach, FL | 2.0 | 2.0 | 986 | $1,975 | $2.00 | 26d | 1 | 0.65mi |
| 2141 W Woolbright Rd Unit L106 Boynton Beach, FL | 2.0 | 2.0 | 1000 | $1,900 | $1.90 | 15d | 1 | 0.71mi |
| 1561 Stonehaven Dr Boynton Beach, FL | 1.0–2.0 | 1.0–2.0 | 975 | $2,084 | $2.14 | 5d | 4 | 0.75mi |
| 600 Sealofts Dr Boynton Beach, FL | 1.0 | 1.0 | 882 | $2,476 | $2.81 | 5d | 1 | 0.76mi |
| 600 Sealofts Dr Boynton Beach, FL | 2.0 | 2.0 | 1066 | $2,716 | $2.55 | 4d | 1 | 0.76mi |
| 600 Sealofts Dr Boynton Beach, FL | 1.0–3.0 | 1.0–2.5 | 1217 | $2,849 | $2.34 | 0d | 15 | 0.76mi |
| 600 Sealofts Dr Boynton Beach, FL | 1.0 | 1.0 | 882 | $2,360 | $2.68 | 3d | 1 | 0.76mi |
| 255 South Blvd Unit D Boynton Beach, FL | 2.0 | 2.0 | 1104 | $1,975 | $1.79 | 4d | 1 | 1.01mi |
| 255 South Blvd Unit D Boynton Beach, FL | 2.0 | 2.0 | 1104 | $2,100 | $1.90 | 26d | 1 | 1.01mi |
| 127 SW 10th Ave Boynton Beach, FL | 2.0 | 1.5 | 754 | $3,500 | $4.64 | 16d | 1 | 1.03mi |
| 115 SW 1st Ave Boynton Beach, FL | 1.0–2.0 | 1.0–2.0 | 804 | $2,250 | $2.80 | 16d | 2 | 1.04mi |
| 1000 Audace Ave Boynton Beach, FL | 1.0 | 1.0 | 800 | $2,180 | $2.73 | 18d | 1 | 1.08mi |
| 1000 Audace Ave Boynton Beach, FL | 1.0 | 1.0 | 800 | $2,180 | $2.73 | 23d | 1 | 1.08mi |
| 204 Belmont Pl Boynton Beach, FL | 1.0 | 1.0 | 878 | $2,200 | $2.51 | 26d | 1 | 1.09mi |
| 1100 Audace Ave Boynton Beach, FL | 1.0–3.0 | 1.0–2.0 | 1021 | $2,646 | $2.59 | 0d | 22 | 1.10mi |
| 113 SE 8th Ave Boynton Beach, FL | 3.0 | 2.0 | 1002 | $3,050 | $3.04 | 23d | 1 | 1.11mi |
| 525 NW 10th Ave Boynton Beach, FL | 3.0 | 1.0 | 836 | $2,300 | $2.75 | 26d | 1 | 1.11mi |
| 519 Martin Luther King Junior Blvd Unit B Boynton Beach, FL | 2.0 | 1.0 | 800 | $1,950 | $2.44 | 26d | 1 | 1.12mi |
| 2301 S Congress Ave Boynton Beach, FL | 1.0–3.0 | 1.0–2.0 | 1033 | $2,156 | $2.09 | 1d | 16 | 1.19mi |
| 207 SE 4th Ave Boynton Beach, FL | 1.0 | 1.0 | 650 | $1,795 | $2.76 | 3d | 1 | 1.20mi |
HOA detail
- Monthly dues
- $187 · $2,244/yr
- Likely covers
- pool
Listing history 16 events
-
2026-06-21days on market $250,000 Active 37 DOM
-
2026-06-18days on market $250,000 Active 34 DOM
-
2026-06-17days on market $250,000 Active 33 DOM
-
2026-06-16days on market $250,000 Active 32 DOM
-
2026-06-15days on market $250,000 Active 31 DOM
-
2026-06-13days on market $250,000 Active 29 DOM
-
2026-06-09days on market $250,000 Active 25 DOM
-
2026-06-08days on market $250,000 Active 24 DOM
-
2026-06-07days on market $250,000 Active 23 DOM
-
2026-06-04days on market $250,000 Active 20 DOM
-
2026-06-03days on market $250,000 Active 19 DOM
-
2026-06-02days on market $250,000 Active 18 DOM
-
2026-06-01days on market $250,000 Active 17 DOM
-
2026-05-31days on market $250,000 Active 16 DOM
-
2026-05-15$250,000 Active
-
1997-10-29soldstatus $42,000
ⓘ Source: listings_history table (triggers on properties + properties_extension) + one-shot
backfill from property_details.listing_events for pre-trigger history.
Tax reassessment forecast FL · Resets to sale price
- Current annual tax
- $690 · $57/mo
- Projected year-2 tax
- $2,075 · $173/mo
- Expected delta
- +$1,385/yr (+$115/mo · 200.9%)
ⓘ Screening estimate from a state-policy table — verify with the county assessor before closing.
Climate risk First Street
- Flood 5/10 Major FEMA zone X (unshaded) · 36% chance over 30 yrs
- Wildfire 1/10 Low
- Heat 9/10 Extreme 7 d/yr ≥105°F today · 23 d/yr by 30 yrs out
- Wind 10/10 Extreme 99% chance of damaging wind over 30 yrs
- Air quality 2/10 Low 1 unhealthy d/yr today · 2 by 30 yrs out
Nearby sold comps map
Loading sold comps map…
Walkable amenities ~0.75 mi
Loading nearby amenities…
Taxation est. · year 1
- Rental income
- $27,231
- − Mortgage interest
- −$14,004
- − Property taxes
- −$690
- − Insurance
- −$1,250
- − Repairs & maintenance
- −$2,178
- − Management
- −$2,178
- − HOA
- −$2,244
- − Depreciation
- −$7,273
- Taxable loss
- −$2,587
- Est. tax savings @ 24.0%
- +$621
- After-tax cash flow
- $2,217/yr
For passive investors: Depreciation is non-cash, so a rental often shows a tax loss while cash-flowing — sheltering income. Rental losses are passive: they offset passive income freely, and up to $25,000/yr can offset ordinary (W-2) income if you actively participate and your MAGI is under $100k (phasing out to $0 by $150k); unused losses carry forward. On sale, claimed depreciation is recaptured at up to 25%, and gains may owe capital-gains tax (a 1031 exchange can defer both). Figures are a year-1 estimate at your 24.0% rate — not tax advice; consult a CPA.
Schools (NCES district)
- District
- Palm Beach
- NCES district ID
- 1201500
- Math proficiency
- 46% ▼ -16.00%
- Reading proficiency
- 53% ▼ -4.00%
- Median HH income
- $53,943
- Composite
- 42.72/100
- National rank
- #3160
- State rank
- #34 of 73 in FL
Livability — Boynton Beach
- Score
- 72/100
- State rank
- #351
- US rank
- #6098
Category grades
Schools grade is shown separately in the Schools card above.
Census & demographics
- Census place
- Boynton Beach, FL
- County
- Palm Beach County · 1,438,312 people
- City population
- 148,060
- Metro
- Miami-Fort Lauderdale-Pompano Beach, FL
- Population (ZIP)
- 24,255
- Household income
- $74,223
- Rent vs Own
- Severe rent burden
- 1417.0
Population outlook (Palm Beach County) Hauer SSP2
- Today (2025)
- 1,637,487 people
- By 2030
- 1,743,255 · +6.5%
- By 2040
- 1,948,712 · +19.0%
- By 2050
- 2,132,979 · +30.3%
- By 2075
- 2,530,027 · +54.5%
- By 2100
- 2,706,979 · +65.3%
Race, ethnicity, and origin ACS 2023
- Neighborhood character
- Diverse neighborhood (Simpson 0.66)
- Race & ethnicity
- White 51% Black 23% Hispanic / Latino 17% Two or more races 14% Asian 4%
- Hispanic origin (detail)
- Puerto Rican 3% Cuban 2%
- Common ancestry
- Hispanic 9% Romanian 2% Lithuanian 2%
- Foreign-born
- 29% · Canada, Jamaica, Vietnam
- Languages at home
- 66% English-only · Spanish 16% French/Haitian/Cajun 11% Other Indo-European 5%
Political lean MEDSL · Palm Beach
- 2024 margin
- Toss-up / Even · D 50.0% · R 49.2%
- 2008→2024 swing
- -22.1pp toward R · 2008: 22.9pp · 2024: 0.8pp
- All cycles
- 2024: D+0.8 2020: D+12.8 2016: D+15.3 2012: D+17.0 2008: D+22.9
Not yet ingested
- Civics
- —
Market trends
- HPI YoY
- ▼ -205.96%
- Current HPI
- 335.3805
- Rent YoY
- ▲ 0.93%
- Metro
- Miami-Fort Lauderdale-Pompano Beach, FL
- State GDP YoY
- ▲ 3.28%
- F500 in state
- 36
Industry mix (Fortune 500 HQ in FL)
| Industry | F500 HQs | Revenue |
|---|---|---|
| Industrial Technology | 2 | $29B |
|
||
| Insurance | 2 | $17B |
|
||
| Retail | 1 | $60B |
|
||
| Technology Distribution | 1 | $58B |
|
||
| Homebuilding | 1 | $35B |
|
||
| Technology Manufacturing | 1 | $35B |
|
||
Price history
+495.2% since first listed2 events — show timeline
- 2026-05-15 Listed $250,000 Beaches MLS
- 1997-10-29 Sold (Public Records) $42,000 Public Records
Property tax history
+0.6%/yrLatest (2025): $690 · +3.6% YoY. Source: county tax records.
Cash-flow waterfall
monthlySold comps — $/sqft
last 12 mo · ≤1 miLoading sold comps…