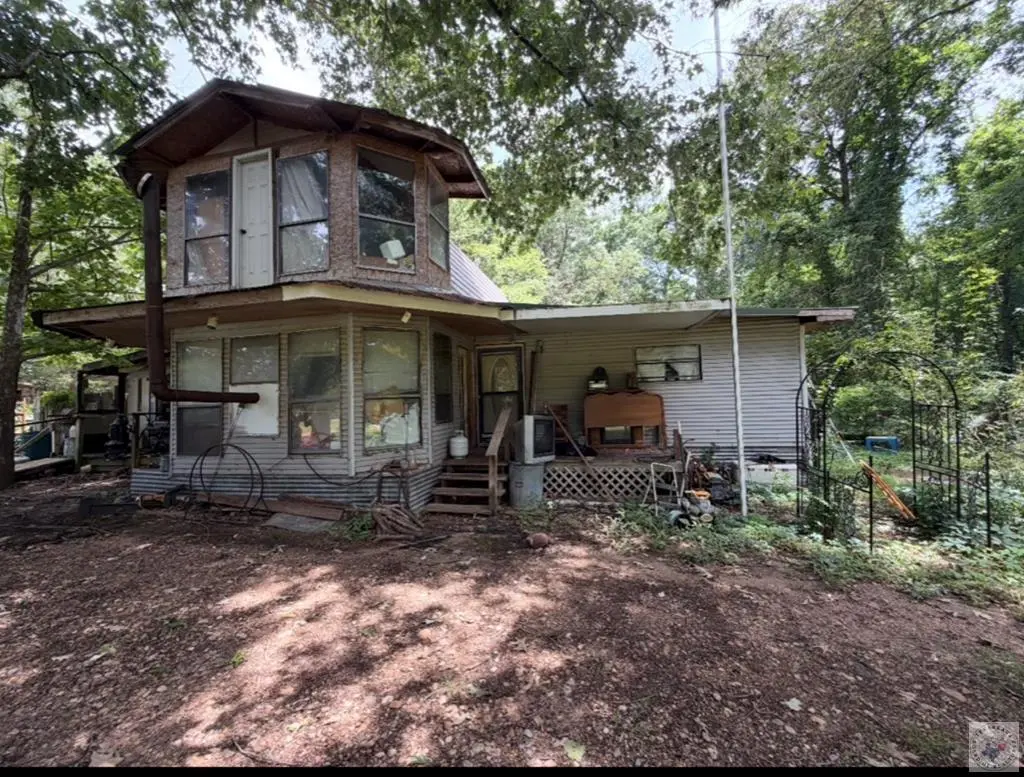
90 Knottingham St · Texarkana, TX
Flood risk 1/10 · Minimal
- FEMA flood zone
- X (unshaded)
- Chance of flooding over 30 yrs
- 0.0%
- Est. flood insurance / yr
- $507 – $1,088
Fire risk 7/10 · Major
- Est. fire insurance / yr
- $1,222 – $2,270
Heat risk 7/10 · Major
- Hot days now (above 112°F)
- 7 days/yr
- Hot days in 30 yrs
- 23 days/yr
Wind risk 6/10 · Moderate
- Chance of severe wind over 30 yrs
- 27.0%
Air-quality risk 2/10 · Minimal
- Unhealthy air days now
- 0 days/yr
- Unhealthy air days in 30 yrs
- 1 days/yr
Risk factors via First Street. Map © Google.
Why this score? — see what drove the B- grade
The composite is a weighted blend of 9 inputs, each scored 0–100. Each bar is that input's sub-score; the figure is the points it added to the 100-point composite (weight × sub-score).
- Cash flow +30.0/30.0
- 1% rule +10.0/10.0
- DSCR +10.0/10.0
- ARV discount +7.5/15.0
- Livability +3.9/5.0
- Rent growth +2.9/5.0
- Condition / age +2.5/5.0
- Schools +1.8/10.0
- Appreciation +0.0/10.0
$54,900
🖨 Deal sheet (PDF) 📄 Offer letter ✓ Due diligence
Listing remarks
Unique two-story home full of character and potential sitting on approximately 1 acre in Texarkana! This 1,870 sq ft, 3 bed/2.5 bath property built in 2004 features a 2-year-old water heater. Investors and visionary buyers, this is your chance to transform this property into something special! Plenty of space and a great lot to work with. Sold AS-IS. Don't miss this incredible opportunity to add value and make it your own at 90 Knottingham St!
Key facts
- 0.95 acre lot
- 2 garage spots
- Built 2004
Property features AI
Finance
- Other: Located in the GEORGE MORRIS A-372 HICKS subdivision; Directions: Going south on 59, turn right on Sherwood Forest, right on Knottingham St.; house on the right
Exterior
- Parking: Detached garage facing front; Two covered parking spaces (two total spaces)
- Home design: Single-family residence; Two-story
- Construction: Vinyl siding; Pillar/post/pier foundation; Built with residential construction materials
- Exterior features: Metal roof; Lot about 0.95 acre
Interior
- Flooring: Carpet
- Bathrooms: Two full bathrooms; One half bathroom
- Heating & cooling: Window unit(s) for cooling
- Interior features: Master bedroom on the main floor
- Laundry & utility: Washer hookup inside; Electric dryer hookup
Neighborhood map
What this means for you Summary
Snapshot
- This is a 3-bed/2.5-bath single-family listed at $55k.
Deal economics
- At list price, monthly cash flow is $644 ($8k/yr) — positive.
- The deal already cash-flows at list — no discount required.
- Meets the 1% rule at list price ($1k rent vs $55k).
- Cap rate 20.4% vs local median 4.3% in Texarkana — top-decile yield for the area; either an underpriced asset or a hidden risk that comps aren't pricing in. Stress-test before assuming the spread holds.
Location & tenants
- Location reads 77/100 on livability (#93 in TX, #3,241 nationally) — a middle-class / working-renter tenant base. Strengths: cost of living A+, housing A+, health & safety A+; Watch: amenities D+, crime D, employment D.
- Liberty-Eylau ISD (urban): math 19% / reading 23% proficiency, ranked #772 of 826 in TX (top 94%) — low school quality limits family demand, transient renter base, plan for 1-2y turnover; 68% free/reduced lunch — lower-income household profile, screen leases tightly.
- Zoned schools: Liberty-Eylau El (math 20% / reading 16%, grade F, #3,785 of 4,322 statewide, top 88%, 575 students, 90% FRL); Liberty-Eylau Middle (math 19% / reading 21%, grade F, #1,428 of 1,662 statewide, top 87%, 573 students, 89% FRL); Liberty-Eylau H S (math 17% / reading 37%, grade F, #1,204 of 1,632 statewide, top 75%, 532 students, 77% FRL) — zoned schools average 85% FRL vs 68% district-wide (18 pts higher); higher-poverty schools than district average — tighter screening recommended.
- Market conditions: Rents rising (+1.6%/yr); 326 active listings in the ZIP; 1 comparable units currently listed for rent nearby; 137 units permitted in Bowie County in 2024 (5 in 5+ unit buildings).
- This rent runs 33% of the median local income ($46k/yr) — at the standard rent-burdened threshold; future hikes will face affordability resistance.
Forward outlook
- Local home prices are declining (-3.0%/yr); year-one equity from $380 of loan paydown is wiped out by about $2k of value loss. Plan a longer hold.
- At projected returns (-3.0% appreciation + 1.6% rent growth), your $15k cash investment doubles in ~3 years — after that, you're playing with house money.
Negotiation context
- Only 9 days on market — expect competitive offers; lowballing is unlikely to land.
Risks & watch-outs
- Climate carrying-cost: major wind risk, 27% chance of damaging wind over 30y; major wildfire risk; extreme-heat days projected 7→23/yr by 2055 (HVAC capex compounding) — expect insurance premiums to compound above CPI over the hold.
Questions for the listing agent
- Is there a deadline driving the sale (1031 exchange, divorce, estate, relocation)? That informs how much negotiation room exists.
- Schools are D-rated, which usually means shorter tenancies and higher turnover. Who's the typical renter profile here, and what's been the actual vacancy rate?
- Crime grade is D in this area — have there been break-ins, vandalism, or insurance claims at this property in the last 3 years? What carrier currently insures it and at what premium?
- What's the average days-on-market for RENTAL listings here right now (not sales)? A rising rental-DOM trend means longer vacancies and softer asking-rent achievability than the comps imply.
- What's the recent tenant-quality profile in this submarket — average credit score on applications, eviction rate, late-payment / NSF rate, and stable-employment percentage? A property-management company in the area should have these aggregated.
- How much new for-sale + rental construction is in the pipeline within 1–3 miles? Heavy new supply typically softens prices + rents 12–24 months out; constrained supply supports both.
Investment metrics
- 1% rule
- 2.29% ✓
- Cap rate
- 20.38%
- Cash-on-cash
- 50.30%
- DSCR
- 3.24
- GRM
- 3.6
CMA / ARV
No comps found within radius.
Projected returns pro-forma
-3.0% appreciation · 1.63% rent growth · sell at horizon
- IRR
- 46.5%
- Equity multiple
- 2.98×
- Total profit
- $30,431
- Equity at exit
- $8,186
- IRR
- 51.7%
- Equity multiple
- 5.72×
- Total profit
- $72,519
- Equity at exit
- $4,747
Cash invested: $15,372 (down + closing). Projections, not guarantees.
Landlord ↔ Tenant lean methodology
- Overall (STATE)
- 87 Strongly Landlord-Friendly
- State Texas
- 87 Strongly Landlord-Friendly · R+5
- County
- — inherits STATE
- City
- — inherits STATE
ZIP-level market 75501
- Home prices YoY
- -34.9%
- Rents YoY
- 1.6%
- Active inventory
- 326
- Price-to-rent
- 3.6×
Monthly cashflow live
- Estimated rent
- $1,256 medium interval (Pro) →
- Mortgage (P&I)
- −$288
- Tax from tax record
- −$37 /mo · $446/yr
- Insurance
- −$23
- HOA
- −$0
- Vacancy / Maint / Mgmt
- −$264
- Net cashflow
- $644
Break-even live
Sensitivity live
| Price | -10% $675 | -5% $660 | +0% $644 | +5% $629 | +10% $613 |
|---|---|---|---|---|---|
| Rent | -10% $545 | -5% $595 | +0% $644 | +5% $694 | +10% $744 |
| Rate | -1.0pp $672 | -0.5pp $658 | base $644 | +0.5pp $630 | +1.0pp $616 |
UW: 25.0% down · 7.5% · 30yr · 1.5% tax · 5.0% vac · 8.0% maint · 8.0% mgmt
Financing live
Cash to close
- Down payment
- $13,725
- Closing costs
- $1,647
- Reserves months
- —
- Total cash needed
- —
Loan-product check · same deal, 3 products live
Conventional
25% down · 7.5% · 30yr
- Down + closing
- —
- Monthly P&I
- —
- Monthly cashflow
- —
- DSCR
- —
- Eligible?
- —
Personal DTI + credit; lowest rate.
DSCR
20% down · 8.5% · 30yr
- Down + closing
- —
- Monthly P&I
- —
- Monthly cashflow
- —
- DSCR
- —
- Eligible?
- —
No personal income docs; deal must DSCR.
Hard money
10% down · 12.0% · 12mo
- Down + closing
- —
- Monthly P&I
- —
- Monthly cashflow
- —
- DSCR
- —
- Eligible?
- —
Short-term bridge; refi at stabilization.
Rent comps 1 comps
| Address | Beds | Baths | Sqft | Rent | $/sqft | DOM | Units | Dist |
|---|---|---|---|---|---|---|---|---|
| 22 Private Road 25161 Texarkana, TX | 1.0–3.0 | 1.0–2.0 | 933 | $1,150 | $1.23 | 45d | 1 | 1.14mi |
Listing history 8 events
-
2026-06-21days on market $54,900 Active 9 DOM
-
2026-06-19days on market $54,900 Active 7 DOM
-
2026-06-18days on market $54,900 Active 6 DOM
-
2026-06-17days on market $54,900 Active 5 DOM
-
2026-06-16days on market $54,900 Active 4 DOM
-
2026-06-15days on market $54,900 Active 3 DOM
-
2026-06-13remarks 447-char remark
-
2026-06-13$54,900 Active 1 DOM
ⓘ Source: listings_history table (triggers on properties + properties_extension) + one-shot
backfill from property_details.listing_events for pre-trigger history.
Tax reassessment forecast TX · Resets to sale price
- Current annual tax
- $446 · $37/mo
- Projected year-2 tax
- $1,005 · $84/mo
- Expected delta
- +$559/yr (+$47/mo · 125.4%)
ⓘ Screening estimate from a state-policy table — verify with the county assessor before closing.
Climate risk First Street
- Flood 1/10 Low FEMA zone X (unshaded) · 0% chance over 30 yrs
- Wildfire 7/10 Severe
- Heat 7/10 Severe 7 d/yr ≥112°F today · 23 d/yr by 30 yrs out
- Wind 6/10 Major 27% chance of damaging wind over 30 yrs
- Air quality 2/10 Low 0 unhealthy d/yr today · 1 by 30 yrs out
Nearby sold comps map
Loading sold comps map…
Walkable amenities ~0.75 mi
Loading nearby amenities…
Taxation est. · year 1
- Rental income
- $15,072
- − Mortgage interest
- −$3,075
- − Property taxes
- −$446
- − Insurance
- −$274
- − Repairs & maintenance
- −$1,206
- − Management
- −$1,206
- − Depreciation
- −$1,597
- Taxable income
- $7,268
- Est. tax owed @ 24.0%
- −$1,744
- After-tax cash flow
- $5,987/yr
For passive investors: Depreciation is non-cash, so a rental often shows a tax loss while cash-flowing — sheltering income. Rental losses are passive: they offset passive income freely, and up to $25,000/yr can offset ordinary (W-2) income if you actively participate and your MAGI is under $100k (phasing out to $0 by $150k); unused losses carry forward. On sale, claimed depreciation is recaptured at up to 25%, and gains may owe capital-gains tax (a 1031 exchange can defer both). Figures are a year-1 estimate at your 24.0% rate — not tax advice; consult a CPA.
Schools (NCES district)
- District
- Liberty-Eylau ISD
- NCES district ID
- 4827390
- Math proficiency
- 19% ▼ -11.00%
- Reading proficiency
- 23% ▼ -8.00%
- Median HH income
- $38,285
- Composite
- 17.61/100
- National rank
- #9037
- State rank
- #772 of 826 in TX
Livability — Texarkana
- Score
- 77/100
- State rank
- #93
- US rank
- #3241
Category grades
Schools grade is shown separately in the Schools card above.
Census & demographics
- County
- Bowie County · 61,238 people
- City population
- 61,238
- Metro
- Texarkana, TX-AR
- Population (ZIP)
- 34,866
- Household income
- $45,995
- Rent vs Own
- Severe rent burden
- 1289.0
Population outlook (Bowie County) Hauer SSP2
- Today (2025)
- 94,699 people
- By 2030
- 94,824 · +0.1%
- By 2040
- 94,870 · +0.2%
- By 2050
- 93,686 · -1.1%
- By 2075
- 90,082 · -4.9%
- By 2100
- 76,579 · -19.1%
Race, ethnicity, and origin ACS 2023
- Neighborhood character
- Diverse neighborhood (Simpson 0.59)
- Race & ethnicity
- White 54% Black 33% Hispanic / Latino 9% Two or more races 5%
- Hispanic origin (detail)
- Mexican 7%
- Common ancestry
- Italian 1% Lithuanian 1% Portuguese 1%
- Foreign-born
- 5% · Canada
- Languages at home
- 92% English-only · Spanish 6% Other Indo-European 1%
Political lean MEDSL · Bowie
- 2024 margin
- Solid R (+48.7) · D 25.3% · R 74.0%
- 2008→2024 swing
- -10.8pp toward R · 2008: -37.9pp · 2024: -48.7pp
- All cycles
- 2024: R+48.7 2020: R+42.8 2016: R+46.6 2012: R+41.5 2008: R+37.9
Not yet ingested
- Civics
- —
Market trends
- HPI YoY
- ▼ -79.14%
- Current HPI
- 147.9402
- Rent YoY
- ▲ 1.63%
- Metro
- Texarkana, TX-AR
- State GDP YoY
- ▲ 3.95%
- F500 in state
- 110
Industry mix (Fortune 500 HQ in TX)
| Industry | F500 HQs | Revenue |
|---|---|---|
| Energy | 16 | $1,198B |
|
||
| Technology | 5 | $198B |
|
||
| Engineering / Construction | 4 | $72B |
|
||
| Energy Services | 3 | $60B |
|
||
| Utilities | 3 | $41B |
|
||
| Healthcare | 2 | $330B |
|
||
Price history
2 events — show timeline
- 2026-06-12 Listed $54,900 TBOR
- 2002-09-25 Sold (Public Records) — Public Records
Property tax history
-1.0%/yrLatest (2025): $446 · +11.4% YoY. Source: county tax records.
Cash-flow waterfall
monthlySold comps — $/sqft
last 12 mo · ≤1 miLoading sold comps…