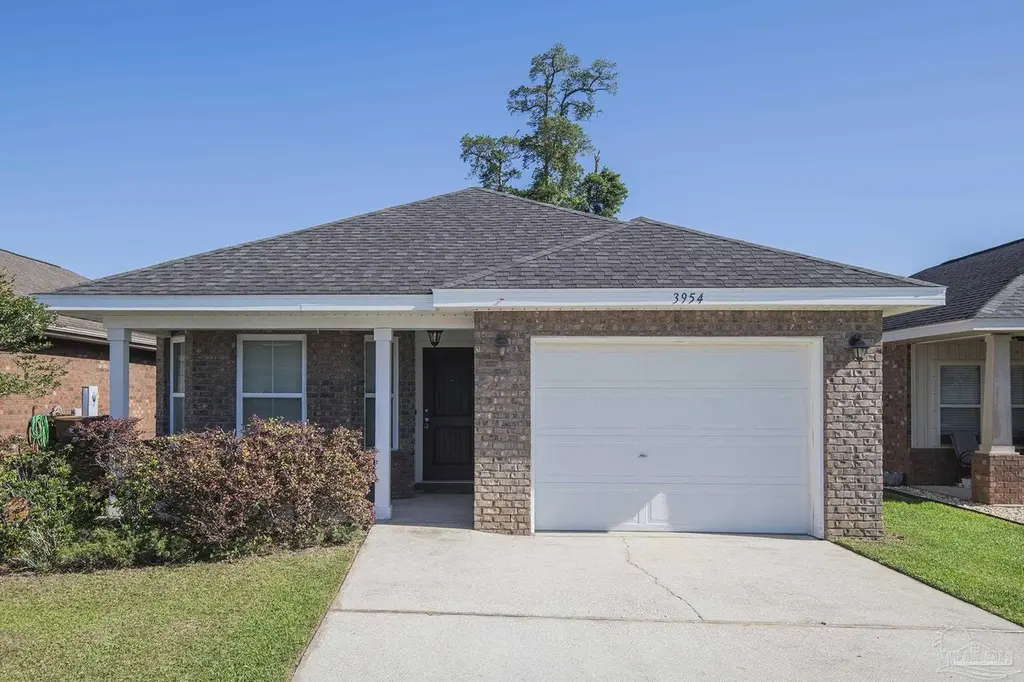
3954 Willow Glen Dr · Pace, FL
Flood risk 1/10 · Minimal
- FEMA flood zone
- X (unshaded)
- Chance of flooding over 30 yrs
- 0.0%
- Est. flood insurance / yr
- $507 – $1,088
Fire risk 5/10 · Moderate
- Est. fire insurance / yr
- $947 – $1,759
Heat risk 10/10 · Severe
- Hot days now (above 106°F)
- 8 days/yr
- Hot days in 30 yrs
- 24 days/yr
Wind risk 9/10 · Severe
- Chance of severe wind over 30 yrs
- 99.0%
Air-quality risk 2/10 · Minimal
- Unhealthy air days now
- 0 days/yr
- Unhealthy air days in 30 yrs
- 1 days/yr
Risk factors via First Street. Map © Google.
Why this score? — see what drove the D grade
The composite is a weighted blend of 9 inputs, each scored 0–100. Each bar is that input's sub-score; the figure is the points it added to the 100-point composite (weight × sub-score).
- Cash flow +12.2/30.0
- ARV discount +9.3/15.0
- Schools +5.3/10.0
- DSCR +3.6/10.0
- Livability +3.5/5.0
- Rent growth +3.2/5.0
- 1% rule +3.0/10.0
- Condition / age +2.5/5.0
- Appreciation +0.0/10.0
$269,900
🖨 Deal sheet (PDF) 📄 Offer letter ✓ Due diligence
Listing remarks MLS
3 Bedroom/2 Bath/1 car garage located in the Willow Glen S/D in Pace! Wood look vinyl flooring throughout. Open kitchen with stainless appliances and room for an eat in kitchen. Combination Living room/formal dining room. Tray ceilings in the living room and Master bedroom gives a more open feel to the home. Newer home, great location. Very nice! Call for your appointment today!
Key facts
- Large eat-in kitchen
- Large bayed windows
- Large breakfast bar
Tags
Property features AI
Finance
- Other: County-maintained road access
- HOA & community: HOA present with an annual fee of $186 (fee covers association)
Exterior
- Parking: Attached garage (1 covered garage space; total 1 parking space)
- Utilities: Public water; Public sewer; Copper wiring
- Home design: Single-story home; Resale property; Not attached to another property; Ridge vent (energy efficient feature)
- Construction: Frame construction; Slab foundation; Composition roof; Built as one level
- Exterior features: Privacy fencing; Interior lot
Interior
- Kitchen: Built-in microwave; Dishwasher; Refrigerator; Electric water heater
- Bedrooms: Primary bedroom on the first floor; Additional bedrooms on the first floor
- Bathrooms: 2 full bathrooms
- Heating & cooling: Central heating; Central air conditioning
- Interior features: Ceiling fan(s); Double-pane windows with blinds and shutters
- Laundry & utility: Laundry inside
Neighborhood map
What this means for you Summary
Snapshot
- This is a 3-bed/2.0-bath single-family listed at $270k.
Deal economics
- At list price, monthly cash flow is $-56 ($-673/yr) — negative.
- To cash-flow at today's rent, offer at most $260k (3.7% below list).
- To meet the 1% rule (rent ≥ 1% of price), the offer needs to be $217k (19.6% below list).
- Recommended offer: $217k (19.6% below list) — sets the bar for 1% rule.
- Cap rate 6.0% vs local median 4.4% in Pace — top-decile yield for the area; either an underpriced asset or a hidden risk that comps aren't pricing in. Stress-test before assuming the spread holds.
Location & tenants
- Location reads 69/100 on livability (#475 in FL) — a middle-class / working-renter tenant base. Strengths: cost of living A+, housing A+, crime B; Watch: amenities F, commute F, health & safety F.
- Santa Rosa (suburban): math 63% / reading 60% proficiency, ranked #8 of 73 in FL (top 11%) — acceptable for families but not a draw, mixed tenant base, ~2y average lease.
- Zoned schools: S. S. Dixon Intermediate School (math 73% / reading 67%, grade A-, #345 of 2,144 statewide, top 17%, 920 students, 40% FRL); Thomas L Sims Middle School (math 77% / reading 65%, grade A, #59 of 571 statewide, top 11%, 1,098 students, 34% FRL); Pace High School (math 63% / reading 62%, grade B-, #93 of 667 statewide, top 14%, 2,240 students, 34% FRL) — zoned schools at 36% FRL track the district average.
- Market conditions: Rents rising (+2.7%/yr); 674 active listings in the ZIP; 6 comparable units currently listed for rent nearby; rentals at typical pace (median 25d on market — plan ~3-4 weeks tenant-placement turnaround); solid renter incomes; 1,983 units permitted in Santa Rosa County in 2024 (128 in 5+ unit buildings).
Forward outlook
- Local home prices are declining (-3.0%/yr); year-one equity from $2k of loan paydown is wiped out by about $8k of value loss. Plan a longer hold.
- Santa Rosa County population projected at +31% by 2050 — long-run rental-demand tailwind backs the buy-and-hold thesis.
Negotiation context
- It's been on market 67 days — a 6% lower offer ($254k) is reasonable based on typical stale-listing flexibility.
- 4 sale attempts since 13y ago with the ask held roughly flat each time — persistent listings suggest the price (not the market) is what's stuck; bring a comps-based counter.
- Current owner paid $175k; list at $270k implies a 54% gain — meaningful room to come down on a strong offer.
Risks & watch-outs
- Climate carrying-cost: severe wind risk, 99% chance of damaging wind over 30y; moderate wildfire risk; extreme-heat days projected 8→24/yr by 2055 (HVAC capex compounding) — expect insurance premiums to compound above CPI over the hold.
Questions for the listing agent
- What do current leases actually rent for vs. the listed asking? Can we see a recent rent roll and the last 12 months of T-12 income?
- It's been on market 67 days. Have you received any prior offers? Is the seller open to a 20% concession, seller financing, or rate buy-down credit?
- What does the HOA fee cover, when was the last increase, and are there any pending special assessments or reserve-fund shortfalls?
- Why hasn't it sold? Are there any deal-killer items the seller is aware of (foundation, flood, title, zoning, code violations)?
- Is there a deadline driving the sale (1031 exchange, divorce, estate, relocation)? That informs how much negotiation room exists.
- Schools are B-rated — typically a magnet for longer-tenancy family renters. What's the average tenant stay here, and is there a school-zone premium baked into asking?
- The area grade is low — what's the realistic commute time and amenity access for the typical tenant pool here? Any planned neighborhood developments (good or bad) we should know about?
- What's the average days-on-market for RENTAL listings here right now (not sales)? A rising rental-DOM trend means longer vacancies and softer asking-rent achievability than the comps imply.
- What's the recent tenant-quality profile in this submarket — average credit score on applications, eviction rate, late-payment / NSF rate, and stable-employment percentage? A property-management company in the area should have these aggregated.
- How much new for-sale + rental construction is in the pipeline within 1–3 miles? Heavy new supply typically softens prices + rents 12–24 months out; constrained supply supports both.
Investment metrics
- 1% rule
- 0.80% ✗
- Cap rate
- 6.04%
- Cash-on-cash
- -0.89%
- DSCR
- 0.96
- GRM
- 10.4
CMA / ARV
- ARV (on-the-fly)
- $281,061
- Comps found
- 12
Show comp detail 12 sales within ~0.75 mi
| Address | Dist | Beds/Ba | Sqft | Sold | Price | $/sf | Match |
|---|---|---|---|---|---|---|---|
| 5797 Corkscrew Ct | 0.11mi | 3/2.0 | 1,486 (-1%) | 1mo | $260,000 | $175 | 92 |
| 5800 Glenby Ct | 0.04mi | 3/2.0 | 1,483 (-1%) | 9mo | $258,700 | $174 | 88 |
| 3952 Willow Glen Dr | 0.01mi | 3/2.0 | 1,392 (-7%) | 2mo | $259,900 | $187 | 86 |
| 5960 Palermo Dr | 0.17mi | 3/2.0 | 1,521 (+1%) | 9mo | $289,900 | $191 | 83 |
| 3966 Willow Glen Dr | 0.05mi | 3/2.0 | 1,398 (-7%) | 10mo | $279,000 | $200 | 78 |
| 5939 Jameson Crk | 0.33mi | 3/2.0 | 1,628 (+8%) | 9mo | $251,000 | $154 | 63 |
| 4100 Berry Cir | 0.48mi | 3/2.0 | 1,628 (+8%) | 10mo | $300,000 | $184 | 55 |
| 3951 Tuscany Way | 0.05mi | 4/2.0 (+1) | 1,690 (+12%) | 21mo | $350,000 | $207 | 55 |
| 5946 Greenfield St | 0.47mi | 3/3.0 | 1,687 (+12%) | 1mo | $325,000 | $193 | 53 |
| 5685 Todd St | 0.45mi | 3/2.0 | 1,624 (+8%) | 18mo | $472,000 | $291 | 51 |
| 3849 Luther Fowler Rd | 0.73mi | 3/2.0 | 1,602 (+7%) | 9mo | $280,000 | $175 | 47 |
| 3691 Gardenview St | 0.69mi | 2/2.0 (-1) | 1,344 (-11%) | 11mo | $220,000 | $164 | 36 |
Match score weights: distance 35% · size 25% · config 20% · recency 20%. Top-matched comps best support the ARV.
Projected returns pro-forma
-3.0% appreciation · 2.72% rent growth · sell at horizon
- IRR
- -18.1%
- Equity multiple
- 0.37×
- Total profit
- $-47,944
- Equity at exit
- $40,243
- IRR
- -10.9%
- Equity multiple
- 0.35×
- Total profit
- $-48,940
- Equity at exit
- $23,336
Cash invested: $75,572 (down + closing). Projections, not guarantees.
Landlord ↔ Tenant lean methodology
- Overall (STATE)
- 87 Strongly Landlord-Friendly
- State Florida
- 87 Strongly Landlord-Friendly · R+3
- County
- — inherits STATE
- City
- — inherits STATE
ZIP-level market 32571
- Home prices YoY
- -17.7%
- Rents YoY
- 2.7%
- Active inventory
- 674
- Price-to-rent
- 10.4×
Monthly cashflow live
- Estimated rent
- $2,170 high interval (Pro) →
- Mortgage (P&I)
- −$1,415
- Tax from tax record
- −$227 /mo · $2,723/yr
- Insurance
- −$112
- HOA
- −$16
- Vacancy / Maint / Mgmt
- −$456
- Net cashflow
- $-56
Break-even live
Sensitivity live
| Price | -10% $97 | -5% $20 | +0% $-56 | +5% $-132 | +10% $-209 |
|---|---|---|---|---|---|
| Rent | -10% $-228 | -5% $-142 | +0% $-56 | +5% $30 | +10% $115 |
| Rate | -1.0pp $80 | -0.5pp $13 | base $-56 | +0.5pp $-126 | +1.0pp $-197 |
UW: 25.0% down · 7.5% · 30yr · 1.5% tax · 5.0% vac · 8.0% maint · 8.0% mgmt
Financing live
Cash to close
- Down payment
- $67,475
- Closing costs
- $8,097
- Reserves months
- —
- Total cash needed
- —
Loan-product check · same deal, 3 products live
Conventional
25% down · 7.5% · 30yr
- Down + closing
- —
- Monthly P&I
- —
- Monthly cashflow
- —
- DSCR
- —
- Eligible?
- —
Personal DTI + credit; lowest rate.
DSCR
20% down · 8.5% · 30yr
- Down + closing
- —
- Monthly P&I
- —
- Monthly cashflow
- —
- DSCR
- —
- Eligible?
- —
No personal income docs; deal must DSCR.
Hard money
10% down · 12.0% · 12mo
- Down + closing
- —
- Monthly P&I
- —
- Monthly cashflow
- —
- DSCR
- —
- Eligible?
- —
Short-term bridge; refi at stabilization.
Rent comps 6 comps
| Address | Beds | Baths | Sqft | Rent | $/sqft | DOM | Units | Dist |
|---|---|---|---|---|---|---|---|---|
| 3927 Tuscany Way Milton, FL | 3.0 | 2.0 | 1850 | $2,075 | $1.12 | 25d | 1 | 0.06mi |
| 5849 Danbury Blvd Milton, FL | 3.0 | 2.0 | 1736 | $2,100 | $1.21 | 25d | 1 | 0.66mi |
| 5857 Danbury Blvd Milton, FL | 3.0 | 2.0 | 1658 | $2,145 | $1.29 | 15d | 1 | 0.68mi |
| 6169 Autumn Pines Cir Milton, FL | 3.0 | 2.0 | 1577 | $1,895 | $1.20 | 15d | 1 | 0.71mi |
| 5768 Conley Ct Milton, FL | 4.0 | 2.0 | 2017 | $2,100 | $1.04 | 15d | 1 | 0.71mi |
| 3614 Hawks Landing Cir Milton, FL | 4.0 | 2.0 | 1953 | $2,100 | $1.08 | 25d | 1 | 1.45mi |
HOA detail
- Monthly dues
- $16 · $192/yr
Listing history 25 events
-
2026-06-22days on market $269,900 Active 67 DOM
-
2026-06-18days on market $269,900 Active 64 DOM
-
2026-06-17days on market $269,900 Active 63 DOM
-
2026-06-16days on market $269,900 Active 62 DOM
-
2026-06-15days on market $269,900 Active 61 DOM
-
2026-06-14days on market $269,900 Active 59 DOM
-
2026-06-10days on market $269,900 Active 56 DOM
-
2026-06-09days on market $269,900 Active 55 DOM
-
2026-06-08days on market $269,900 Active 54 DOM
-
2026-06-07days on market $269,900 Active 53 DOM
-
2026-06-05days on market $269,900 Active 50 DOM
-
2026-06-03days on market $269,900 Active 49 DOM
-
2026-06-02days on market $269,900 Active 48 DOM
-
2026-06-01days on market $269,900 Active 47 DOM
-
2026-05-31days on market $269,900 Active 46 DOM
-
2026-05-31days on market $269,900 Active 45 DOM
-
2026-05-23price $269,900
-
2026-04-15$279,000 Active
-
2019-08-09soldstatus $175,000
-
2019-08-02soldstatus $175,000 382-char remark
Show marketing remark (382 chars)
3 Bedroom/2 Bath/1 car garage located in the Willow Glen S/D in Pace! Wood look vinyl flooring throughout. Open kitchen with stainless appliances and room for an eat in kitchen. Combination Living room/formal dining room. Tray ceilings in the living room and Master bedroom gives a more open feel to the home. Newer home, great location. Very nice! Call for your appointment today!
-
2019-05-03$174,500 382-char remark
Show marketing remark (382 chars)
3 Bedroom/2 Bath/1 car garage located in the Willow Glen S/D in Pace! Wood look vinyl flooring throughout. Open kitchen with stainless appliances and room for an eat in kitchen. Combination Living room/formal dining room. Tray ceilings in the living room and Master bedroom gives a more open feel to the home. Newer home, great location. Very nice! Call for your appointment today!
-
2015-11-18historical
-
2015-10-13$160,000
-
2014-01-14soldstatus $138,536
-
2013-05-06$136,900
ⓘ Source: listings_history table (triggers on properties + properties_extension) + one-shot
backfill from property_details.listing_events for pre-trigger history.
Tax reassessment forecast FL · Resets to sale price
- Current annual tax
- $2,723 · $227/mo
- Projected year-2 tax
- $2,723 · $227/mo
- Expected delta
- $0/yr ($0/mo · 0.0%)
ⓘ Screening estimate from a state-policy table — verify with the county assessor before closing.
Climate risk First Street
- Flood 1/10 Low FEMA zone X (unshaded) · 0% chance over 30 yrs
- Wildfire 5/10 Major
- Heat 10/10 Extreme 8 d/yr ≥106°F today · 24 d/yr by 30 yrs out
- Wind 9/10 Extreme 99% chance of damaging wind over 30 yrs
- Air quality 2/10 Low 0 unhealthy d/yr today · 1 by 30 yrs out
Nearby sold comps map
Loading sold comps map…
Walkable amenities ~0.75 mi
Loading nearby amenities…
Taxation est. · year 1
- Rental income
- $26,046
- − Mortgage interest
- −$15,119
- − Property taxes
- −$2,723
- − Insurance
- −$1,350
- − Repairs & maintenance
- −$2,084
- − Management
- −$2,084
- − HOA
- −$192
- − Depreciation
- −$7,852
- Taxable loss
- −$5,357
- Est. tax savings @ 24.0%
- +$1,286
- After-tax cash flow
- $612/yr
For passive investors: Depreciation is non-cash, so a rental often shows a tax loss while cash-flowing — sheltering income. Rental losses are passive: they offset passive income freely, and up to $25,000/yr can offset ordinary (W-2) income if you actively participate and your MAGI is under $100k (phasing out to $0 by $150k); unused losses carry forward. On sale, claimed depreciation is recaptured at up to 25%, and gains may owe capital-gains tax (a 1031 exchange can defer both). Figures are a year-1 estimate at your 24.0% rate — not tax advice; consult a CPA.
Schools (NCES district)
- District
- Santa Rosa
- NCES district ID
- 1201650
- Math proficiency
- 63% ▼ -6.00%
- Reading proficiency
- 60% ▼ -5.00%
- Median HH income
- $58,161
- Composite
- 53.12/100
- National rank
- #1511
- State rank
- #8 of 73 in FL
Livability — Pace
- Score
- 69/100
- State rank
- #475
- US rank
- #8593
Category grades
Schools grade is shown separately in the Schools card above.
Census & demographics
- County
- Santa Rosa County · 194,764 people
- City population
- 42,171
- Metro
- Pensacola-Ferry Pass-Brent, FL
- Population (ZIP)
- 42,171
- Household income
- $87,617
- Rent vs Own
- Severe rent burden
- 301.0
Population outlook (Santa Rosa County) Hauer SSP2
- Today (2025)
- 195,978 people
- By 2030
- 209,782 · +7.0%
- By 2040
- 235,293 · +20.1%
- By 2050
- 256,408 · +30.8%
- By 2075
- 298,074 · +52.1%
- By 2100
- 303,216 · +54.7%
Race, ethnicity, and origin ACS 2023
- Neighborhood character
- Predominantly White (80%)
- Race & ethnicity
- White 80% Two or more races 9% Hispanic / Latino 6% Black 4% Asian 2%
- Hispanic origin (detail)
- Mexican 3%
- Common ancestry
- Lithuanian 4% Italian 3% Slovak 2%
- Foreign-born
- 6% · Canada, South Korea
- Languages at home
- 93% English-only · Spanish 2% Other Indo-European 1% Russian/Polish/Slavic 1%
Political lean MEDSL · Santa Rosa
- 2024 margin
- Solid R (+51.0) · D 24.1% · R 75.0%
- 2008→2024 swing
- -3.0pp toward R · 2008: -47.9pp · 2024: -51.0pp
- All cycles
- 2024: R+51.0 2020: R+46.5 2016: R+53.5 2012: R+52.6 2008: R+47.9
Not yet ingested
- Civics
- —
Market trends
- HPI YoY
- ▼ -62.39%
- Current HPI
- 290.2953
- Rent YoY
- ▲ 2.72%
- Metro
- Pensacola-Ferry Pass-Brent, FL
- State GDP YoY
- ▲ 3.28%
- F500 in state
- 36
Industry mix (Fortune 500 HQ in FL)
| Industry | F500 HQs | Revenue |
|---|---|---|
| Industrial Technology | 2 | $29B |
|
||
| Insurance | 2 | $17B |
|
||
| Retail | 1 | $60B |
|
||
| Technology Distribution | 1 | $58B |
|
||
| Homebuilding | 1 | $35B |
|
||
| Technology Manufacturing | 1 | $35B |
|
||
Price history
+97.2% since first listed9 events — show timeline
- 2026-05-23 Price Changed $269,900 PARMLS
- 2026-04-15 Listed $279,000 PARMLS
- 2019-08-09 Sold (Public Records) $175,000 Public Records
- 2019-08-02 Sold (MLS) $175,000 PARMLS
- 2019-05-03 Listed $174,500 PARMLS
- 2015-11-18 Listing Removed — PARMLS
- 2015-10-13 Listed $160,000 PARMLS
- 2014-01-14 Sold (MLS) $138,536 PARMLS
- 2013-05-06 Listed $136,900 PARMLS
Property tax history
+5.4%/yrLatest (2025): $2,723 · +45.6% YoY. Source: county tax records.
Cash-flow waterfall
monthlySold comps — $/sqft
last 12 mo · ≤1 miLoading sold comps…