13612 N Pomelo Rd · Santa Rosa, TX
Flood risk 5/10 · Moderate
- FEMA flood zone
- X (unshaded)
- Chance of flooding over 30 yrs
- 0.67%
- Est. flood insurance / yr
- $507 – $1,088
Fire risk 3/10 · Minor
- Est. fire insurance / yr
- $1,222 – $2,270
Heat risk 9/10 · Severe
- Hot days now (above 111°F)
- 7 days/yr
- Hot days in 30 yrs
- 20 days/yr
Wind risk 9/10 · Severe
- Chance of severe wind over 30 yrs
- 99.0%
Air-quality risk 1/10 · Minimal
- Unhealthy air days now
- 0 days/yr
- Unhealthy air days in 30 yrs
- 0 days/yr
Risk factors via First Street. Map © Google.
Why this score? — see what drove the D grade
The composite is a weighted blend of 9 inputs, each scored 0–100. Each bar is that input's sub-score; the figure is the points it added to the 100-point composite (weight × sub-score).
- Cash flow +15.0/30.0
- Appreciation +7.9/10.0
- DSCR +4.6/10.0
- 1% rule +4.1/10.0
- Livability +3.2/5.0
- Rent growth +2.5/5.0
- Condition / age +2.2/5.0
- Schools +1.9/10.0
- ARV discount +0.0/15.0
$160,000
🖨 Deal sheet (PDF) 📄 Offer letter ✓ Due diligence
Listing remarks MLS
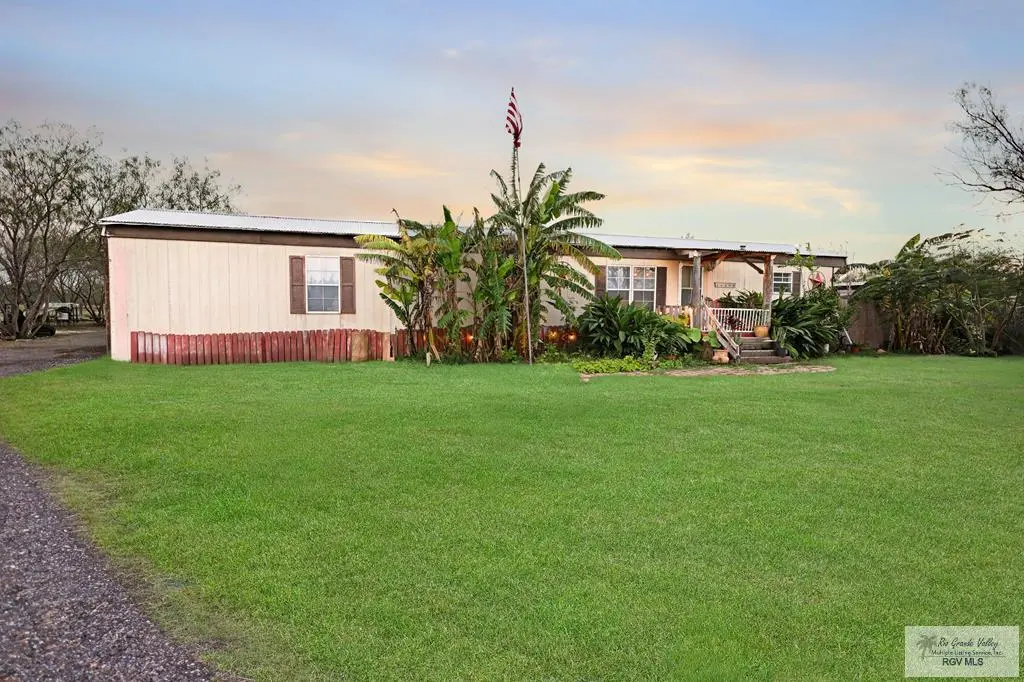
Charming 2-bedroom, 1.5 -bath home in Santa Rosa, nestled on 1.22 acres at the end of a quiet cul-de-sac. Enjoy privacy, a 2-car rear entry carport, and an extra port for parking or projects. Surrounded by natural beauty, this peaceful retreat is perfect as a full-time residence or weekend getaway.
Key facts
- Quiet cul-de-sac
- 1.22 acre lot
- Built 1984
Tags
Neighborhood map
What this means for you Summary
Snapshot
- This is a 2-bed/2.0-bath single-family listed at $160k. Condition is rated fair.
Deal economics
- At list price, monthly cash flow is $50 ($604/yr) — positive.
- The deal already cash-flows at list — no discount required.
- To meet the 1% rule (rent ≥ 1% of price), the offer needs to be $146k (8.5% below list).
- Recommended offer: $141k (12.0% below list) — sets the bar for market timing.
Location & tenants
- Location reads 64/100 on livability (#774 in TX) — a middle-class / working-renter tenant base. Strengths: cost of living A+, housing A+, health & safety A+; Watch: amenities F, commute F, employment F.
- Santa Rosa ISD (suburban): math 17% / reading 30% proficiency, ranked #760 of 826 in TX (top 92%) — low school quality limits family demand, transient renter base, plan for 1-2y turnover; 81% free/reduced lunch — lower-income household profile, screen leases tightly.
- Zoned schools: Elma E Barrera El (math 22% / reading 27%, grade F, #3,052 of 4,322 statewide, top 74%, 402 students, 90% FRL); Jo Nelson Middle (math 13% / reading 30%, grade F, #1,378 of 1,662 statewide, top 83%, 224 students, 86% FRL); Santa Rosa H S (math 22% / reading 37%, grade F, #1,112 of 1,632 statewide, top 70%, 289 students, 86% FRL).
- Market conditions: 51 active listings in the ZIP; 2,326 units permitted in Cameron County in 2024 (503 in 5+ unit buildings).
Forward outlook
- In year one you build about $10k of equity ($1k loan paydown + $9k appreciation (5.8% local appreciation)).
- Cameron County population projected at +3% by 2050 — modest demand growth; plan on rents tracking national, not racing it.
- At projected returns (5.8% appreciation + 3.0% rent growth), your $45k cash investment doubles in ~4 years — after that, you're playing with house money.
- By year 4, paydown + projected appreciation supports a ~$35k cash-out refi (75% LTV) — recoverable capital for the next deal without selling this one.
Negotiation context
- It's been on market 163 days — a 12% lower offer ($141k) is reasonable based on typical stale-listing flexibility.
- 6 sale attempts since 2y ago with the ask held roughly flat each time — persistent listings suggest the price (not the market) is what's stuck; bring a comps-based counter.
Risks & watch-outs
- Climate carrying-cost: moderate flood risk; severe wind risk, 99% chance of damaging wind over 30y; extreme-heat days projected 7→20/yr by 2055 (HVAC capex compounding) — expect insurance premiums to compound above CPI over the hold.
Questions for the listing agent
- It's been on market 163 days. Have you received any prior offers? Is the seller open to a 12% concession, seller financing, or rate buy-down credit?
- Have any recent inspections been done? Can we get a copy of the seller's disclosures and any deferred-maintenance estimates?
- Why hasn't it sold? Are there any deal-killer items the seller is aware of (foundation, flood, title, zoning, code violations)?
- Is there a deadline driving the sale (1031 exchange, divorce, estate, relocation)? That informs how much negotiation room exists.
- Schools are F-rated, which usually means shorter tenancies and higher turnover. Who's the typical renter profile here, and what's been the actual vacancy rate?
- The area grade is low — what's the realistic commute time and amenity access for the typical tenant pool here? Any planned neighborhood developments (good or bad) we should know about?
- What's the average days-on-market for RENTAL listings here right now (not sales)? A rising rental-DOM trend means longer vacancies and softer asking-rent achievability than the comps imply.
- What's the recent tenant-quality profile in this submarket — average credit score on applications, eviction rate, late-payment / NSF rate, and stable-employment percentage? A property-management company in the area should have these aggregated.
- How much new for-sale + rental construction is in the pipeline within 1–3 miles? Heavy new supply typically softens prices + rents 12–24 months out; constrained supply supports both.
Investment metrics
- 1% rule
- 0.91% ✗
- Cap rate
- 6.67%
- Cash-on-cash
- 1.35%
- DSCR
- 1.06
- GRM
- 9.1
CMA / ARV
- ARV (median comp)
- $109,552
- List price
- $160,000
- Delta
- 46.05%
- Verdict
- OVERPRICED
- Comps
- 8 within 2.0 mi
Projected returns pro-forma
5.83% appreciation · 3.0% rent growth · sell at horizon
- IRR
- 16.1%
- Equity multiple
- 2.07×
- Total profit
- $47,784
- Equity at exit
- $98,841
- IRR
- 16.1%
- Equity multiple
- 4.09×
- Total profit
- $138,536
- Equity at exit
- $177,758
Cash invested: $44,800 (down + closing). Projections, not guarantees.
Landlord ↔ Tenant lean methodology
- Overall (STATE)
- 87 Strongly Landlord-Friendly
- State Texas
- 87 Strongly Landlord-Friendly · R+5
- County
- — inherits STATE
- City
- — inherits STATE
ZIP-level market 78593
- Home prices YoY
- 2.9%
- Active inventory
- 51
- Price-to-rent
- 9.1×
Monthly cashflow live
- Estimated rent
- $1,463 medium interval (Pro) →
- Mortgage (P&I)
- −$839
- Tax est. 1.5%
- −$200 /mo · $2,400/yr
- Insurance
- −$67
- HOA
- −$0
- Vacancy / Maint / Mgmt
- −$307
- Net cashflow
- $50
Break-even live
Sensitivity live
| Price | -10% $161 | -5% $106 | +0% $50 | +5% $-5 | +10% $-60 |
|---|---|---|---|---|---|
| Rent | -10% $-65 | -5% $-8 | +0% $50 | +5% $108 | +10% $166 |
| Rate | -1.0pp $131 | -0.5pp $91 | base $50 | +0.5pp $9 | +1.0pp $-33 |
UW: 25.0% down · 7.5% · 30yr · 1.5% tax · 5.0% vac · 8.0% maint · 8.0% mgmt
Financing live
Cash to close
- Down payment
- $40,000
- Closing costs
- $4,800
- Reserves months
- —
- Total cash needed
- —
Loan-product check · same deal, 3 products live
Conventional
25% down · 7.5% · 30yr
- Down + closing
- —
- Monthly P&I
- —
- Monthly cashflow
- —
- DSCR
- —
- Eligible?
- —
Personal DTI + credit; lowest rate.
DSCR
20% down · 8.5% · 30yr
- Down + closing
- —
- Monthly P&I
- —
- Monthly cashflow
- —
- DSCR
- —
- Eligible?
- —
No personal income docs; deal must DSCR.
Hard money
10% down · 12.0% · 12mo
- Down + closing
- —
- Monthly P&I
- —
- Monthly cashflow
- —
- DSCR
- —
- Eligible?
- —
Short-term bridge; refi at stabilization.
Listing history 22 events
-
2026-06-22days on market $160,000 Active 163 DOM
-
2026-06-18days on market $160,000 Active 160 DOM
-
2026-06-17days on market $160,000 Active 159 DOM
-
2026-06-16days on market $160,000 Active 158 DOM
-
2026-06-15days on market $160,000 Active 157 DOM
-
2026-06-14days on market $160,000 Active 155 DOM
-
2026-06-10days on market $160,000 Active 152 DOM
-
2026-06-09days on market $160,000 Active 151 DOM
-
2026-06-08days on market $160,000 Active 150 DOM
-
2026-06-07days on market $160,000 Active 149 DOM
-
2026-06-03days on market $160,000 Active 145 DOM
-
2026-06-02days on market $160,000 Active 144 DOM
-
2026-06-01days on market $160,000 Active 143 DOM
-
2026-05-31days on market $160,000 Active 142 DOM
-
2026-05-30days on market $160,000 Active 141 DOM
-
2026-01-08$160,000 Active 299-char remark
Show marketing remark (299 chars)
Charming 2-bedroom, 1.5 -bath home in Santa Rosa, nestled on 1.22 acres at the end of a quiet cul-de-sac. Enjoy privacy, a 2-car rear entry carport, and an extra port for parking or projects. Surrounded by natural beauty, this peaceful retreat is perfect as a full-time residence or weekend getaway.
-
2025-10-03$160,000 Active
-
2025-02-03$165,000 Active
-
2024-08-29$165,000 Active
-
2024-08-28price $165,000
-
2024-07-24$175,000 Active
-
2024-07-13$185,000 Active
ⓘ Source: listings_history table (triggers on properties + properties_extension) + one-shot
backfill from property_details.listing_events for pre-trigger history.
Climate risk First Street
- Flood 5/10 Major FEMA zone X (unshaded) · 67% chance over 30 yrs
- Wildfire 3/10 Moderate
- Heat 9/10 Extreme 7 d/yr ≥111°F today · 20 d/yr by 30 yrs out
- Wind 9/10 Extreme 99% chance of damaging wind over 30 yrs
- Air quality 1/10 Low 0 unhealthy d/yr today · 0 by 30 yrs out
Nearby sold comps map
Loading sold comps map…
Walkable amenities ~0.75 mi
Loading nearby amenities…
Taxation est. · year 1
- Rental income
- $17,560
- − Mortgage interest
- −$8,962
- − Property taxes
- −$2,400
- − Insurance
- −$800
- − Repairs & maintenance
- −$1,405
- − Management
- −$1,405
- − Depreciation
- −$4,655
- Taxable loss
- −$2,067
- Est. tax savings @ 24.0%
- +$496
- After-tax cash flow
- $1,100/yr
For passive investors: Depreciation is non-cash, so a rental often shows a tax loss while cash-flowing — sheltering income. Rental losses are passive: they offset passive income freely, and up to $25,000/yr can offset ordinary (W-2) income if you actively participate and your MAGI is under $100k (phasing out to $0 by $150k); unused losses carry forward. On sale, claimed depreciation is recaptured at up to 25%, and gains may owe capital-gains tax (a 1031 exchange can defer both). Figures are a year-1 estimate at your 24.0% rate — not tax advice; consult a CPA.
Condition & rehab AI · 12 photos
This property requires significant repairs and updates to improve its condition and value. The exterior and interior need fresh paint, the flooring and appliances need replacing, and the bathrooms need updating. With these improvements, the property can be transformed into a move-in-ready home with increased resale and rental value.
Repairs flagged
- Major Exterior siding — Significant damage and exposure
- Major Roof — Metal panels are visibly damaged
- Major Flooring — Worn and in need of replacement
- Major Interior walls/paint — Worn wallpaper and peeling paint
- Major Bathrooms — Outdated fixtures and tiles
- Major Kitchen — Cluttered countertops and outdated appliances
- Major HVAC — Exposed unit and electrical wiring
Value-add opportunities
- Resale Paint exterior — Enhances curb appeal and property value
- Resale Replace flooring — Improves living space and adds value
- Resale Paint interior walls — Freshens up the interior and adds value
- Resale Update bathrooms — Modernizes the space and adds value
- Resale Replace kitchen appliances — Modernizes the kitchen and adds value
Renovation cost estimate screening
| Repair item | Severity | Est. cost |
|---|---|---|
| Exterior siding · Significant damage and exposure | Major | $15,000–50,000 |
| Roof · Metal panels are visibly damaged | Major | $15,000–50,000 |
| Flooring · Worn and in need of replacement | Major | $15,000–50,000 |
| Interior walls/paint · Worn wallpaper and peeling paint | Major | $15,000–50,000 |
| Bathrooms · Outdated fixtures and tiles | Major | $15,000–50,000 |
| Kitchen · Cluttered countertops and outdated appliances | Major | $15,000–50,000 |
| HVAC · Exposed unit and electrical wiring | Major | $15,000–50,000 |
| Total estimated repair cost · 7 items | $105,000–350,000 |
Value-add ROI direction
- Resale Paint exterior — Enhances curb appeal and property value ↑
- Resale Replace flooring — Improves living space and adds value ↑
- Resale Paint interior walls — Freshens up the interior and adds value ↑
- Resale Update bathrooms — Modernizes the space and adds value ↑
- Resale Replace kitchen appliances — Modernizes the kitchen and adds value ↑
ⓘ Cost ranges are severity-bucket heuristics (US national rule-of-thumb). Get contractor quotes + a written scope before underwriting a rehab budget.
Schools (NCES district)
- District
- Santa Rosa ISD
- NCES district ID
- 4839360
- Math proficiency
- 17% ▼ -28.00%
- Reading proficiency
- 30% ▼ -10.00%
- Median HH income
- $27,649
- Composite
- 18.63/100
- National rank
- #8896
- State rank
- #760 of 826 in TX
Livability — Santa Rosa
- Score
- 64/100
- State rank
- #774
- US rank
- #14097
Category grades
Schools grade is shown separately in the Schools card above.
Census & demographics
- Population (ZIP)
- 5,030
Population outlook (Cameron County) Hauer SSP2
- Today (2025)
- 441,603 people
- By 2030
- 448,113 · +1.5%
- By 2040
- 456,385 · +3.3%
- By 2050
- 456,294 · +3.3%
- By 2075
- 423,851 · -4.0%
- By 2100
- 342,787 · -22.4%
Race, ethnicity, and origin ACS 2023
- Neighborhood character
- Predominantly Hispanic (97%)
- Race & ethnicity
- Hispanic / Latino 97% Two or more races 39% Native American 4% White 3%
- Hispanic origin (detail)
- Mexican 95%
- Foreign-born
- 12% · Canada
- Languages at home
- 45% English-only · Spanish 55%
Political lean MEDSL · Cameron
- 2024 margin
- Lean R (+5.8) · D 46.7% · R 52.5%
- 2008→2024 swing
- -34.6pp toward R · 2008: 28.8pp · 2024: -5.8pp
- All cycles
- 2024: R+5.8 2020: D+13.2 2016: D+32.5 2012: D+32.4 2008: D+28.8
Not yet ingested
- Civics
- —
Market trends
- HPI YoY
- ▲ 5.83%
- Current HPI
- 210.4254
- Rent YoY
- —
- Metro
- —
- State GDP YoY
- ▲ 3.95%
- F500 in state
- 110
Industry mix (Fortune 500 HQ in TX)
| Industry | F500 HQs | Revenue |
|---|---|---|
| Energy | 16 | $1,198B |
|
||
| Technology | 5 | $198B |
|
||
| Engineering / Construction | 4 | $72B |
|
||
| Energy Services | 3 | $60B |
|
||
| Utilities | 3 | $41B |
|
||
| Healthcare | 2 | $330B |
|
||
Price history
-13.5% since first listed7 events — show timeline
- 2026-01-08 Listed $160,000 RGVMLS
- 2025-10-03 Listed $160,000 MCALLENMLS
- 2025-02-03 Listed $165,000 MCALLENMLS
- 2024-08-29 Listed $165,000 MCALLENMLS
- 2024-08-28 Price Changed $165,000 MCALLENMLS
- 2024-07-24 Listed $175,000 MCALLENMLS
- 2024-07-13 Listed $185,000 MCALLENMLS
Cash-flow waterfall
monthlySold comps — $/sqft
last 12 mo · ≤1 miLoading sold comps…