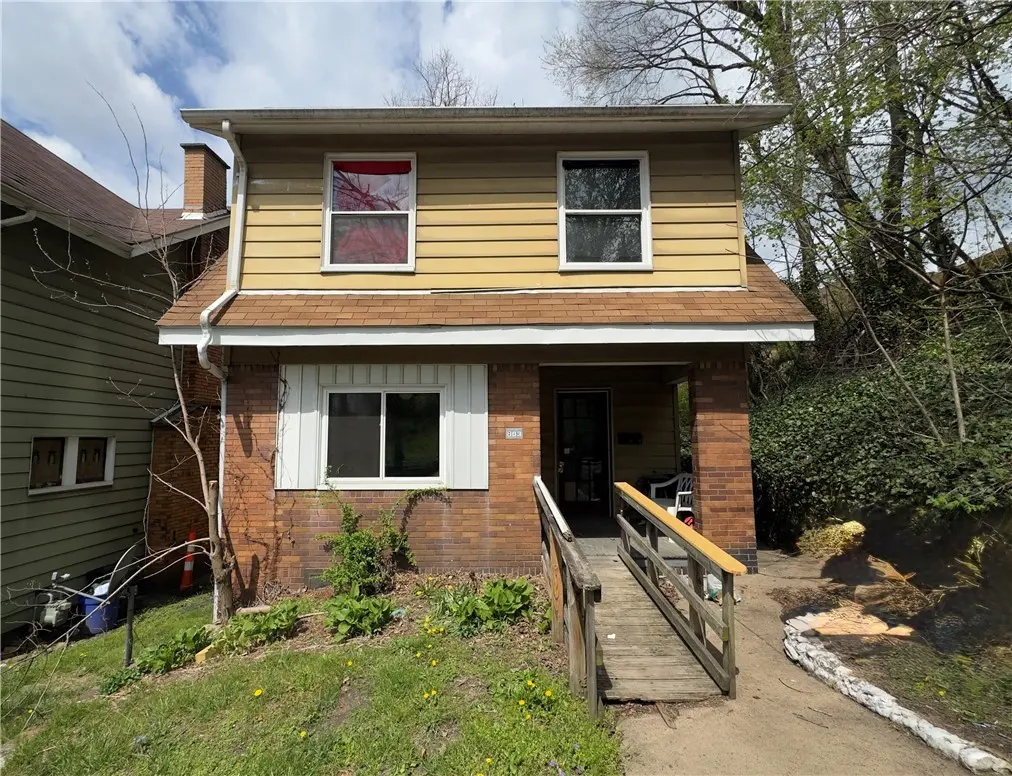
803 6th St · New Brighton, PA
Flood risk 1/10 · Minimal
- FEMA flood zone
- X (unshaded)
- Chance of flooding over 30 yrs
- 0.0%
- Est. flood insurance / yr
- $473 – $860
Fire risk 1/10 · Minimal
- Est. fire insurance / yr
- $511 – $949
Heat risk 4/10 · Minor
- Hot days now (above 97°F)
- 7 days/yr
- Hot days in 30 yrs
- 18 days/yr
Wind risk 2/10 · Minimal
- Chance of severe wind over 30 yrs
- 0.0%
Air-quality risk 3/10 · Minor
- Unhealthy air days now
- 2 days/yr
- Unhealthy air days in 30 yrs
- 4 days/yr
Risk factors via First Street. Map © Google.
Why this score? — see what drove the B- grade
The composite is a weighted blend of 9 inputs, each scored 0–100. Each bar is that input's sub-score; the figure is the points it added to the 100-point composite (weight × sub-score).
- Cash flow +25.8/30.0
- ARV discount +15.0/15.0
- DSCR +8.6/10.0
- 1% rule +7.4/10.0
- Livability +4.1/5.0
- Rent growth +2.5/5.0
- Condition / age +2.5/5.0
- Schools +2.3/10.0
- Appreciation +0.0/10.0
$105,000
🖨 Deal sheet 📄 Offer letter ✓ Due diligence
Listing remarks MLS
Great investor or rental duplex in New Brighton within walking distance to schools, shopping, and dining. Main level unit Master Bedroom has ensuite bathroom. Unit has nice layout. Upper level has 2 bedrooms or use one bedroom as office. Easy access to useable attic space.
Key facts
- Two-unit property
- Local attractions
- Walkable downtown
Tags
Property features AI
Finance
- Financial info: Property is a 2-unit building; Unit rents: one unit currently rented for $750; the other unit listed as vacant
Exterior
- Parking: On-street parking
- Utilities: Electricity available; Natural gas available; Public sewer available; Public water available
- Home design: Frame construction
- Construction: Frame construction
- Exterior features: Residential zoning; Lot approximately 0.07 acres
Interior
- Bedrooms: One unit with 3 bedrooms; One unit with 1 bedroom
- Bathrooms: Each unit includes 1 full bathroom
- Interior features: Basement present
Neighborhood map
What this means for you Summary
Snapshot
- This is a 3-bed/2.0-bath single-family listed at $105k.
Deal economics
- At list price, monthly cash flow is $254 ($3k/yr) — positive.
- The deal already cash-flows at list — no discount required.
- Meets the 1% rule at list price ($1k rent vs $105k).
- Recommended offer: $103k (1.5% below list) — sets the bar for market timing.
Location & tenants
- Location reads 82/100 on livability (#153 in PA, #1,275 nationally) — a professional / high-income tenant draw. Strengths: commute A+, cost of living A+, housing A+; Watch: amenities F, employment D-.
- New Brighton Area SD (suburban): math 17% / reading 37% proficiency, ranked #458 of 539 in PA (top 85%) — low school quality limits family demand, transient renter base, plan for 1-2y turnover.
- Market conditions: 42 active listings in the ZIP; 7 comparable units currently listed for rent nearby; rentals leasing fast (median 13d on market — plan ~1-2 weeks tenant-placement turnaround); 272 units permitted in Beaver County in 2024 (80 in 5+ unit buildings).
Forward outlook
- Local home prices are declining (-3.0%/yr); year-one equity from $726 of loan paydown is wiped out by about $3k of value loss. Plan a longer hold.
- Beaver County population projected at -14% by 2050 — secular population decline; favor cash flow + early exit over multi-decade hold.
Negotiation context
- It's been on market 30 days — a 2% lower offer ($103k) is reasonable based on typical stale-listing flexibility.
- 3 sale attempts since 9y ago with the ask held roughly flat each time — persistent listings suggest the price (not the market) is what's stuck; bring a comps-based counter.
- Current owner paid $30k; list at $105k implies a 250% gain — meaningful room to come down on a strong offer.
Risks & watch-outs
- Watch-outs: built in 1900 — expect roof / HVAC / electrical / plumbing capex.
Questions for the listing agent
- Built in 1900 — when were the roof, HVAC, electrical panel, plumbing, and water heater last replaced?
- Is there a deadline driving the sale (1031 exchange, divorce, estate, relocation)? That informs how much negotiation room exists.
- What's the average days-on-market for RENTAL listings here right now (not sales)? A rising rental-DOM trend means longer vacancies and softer asking-rent achievability than the comps imply.
- What's the recent tenant-quality profile in this submarket — average credit score on applications, eviction rate, late-payment / NSF rate, and stable-employment percentage? A property-management company in the area should have these aggregated.
- How much new for-sale + rental construction is in the pipeline within 1–3 miles? Heavy new supply typically softens prices + rents 12–24 months out; constrained supply supports both.
Investment metrics
- 1% rule
- 1.24% ✓
- Cap rate
- 9.20%
- Cash-on-cash
- 10.37%
- DSCR
- 1.46
- GRM
- 6.7
CMA / ARV
- ARV (on-the-fly)
- $137,640
- Comps found
- 12
Show comp detail 12 sales within ~0.75 mi
| Address | Dist | Beds/Ba | Sqft | Sold | Price | $/sf | Match |
|---|---|---|---|---|---|---|---|
| 1011 5th St | 0.18mi | 3/2.0 | 1,533 (+4%) | 2mo | $132,000 | $86 | 84 |
| 722 6th Ave | 0.18mi | 3/1.0 | 1,446 (-2%) | 1mo | $105,000 | $73 | 83 |
| 626 10th Ave | 0.09mi | 4/1.5 (+1) | 1,588 (+7%) | 1mo | $195,597 | $123 | 76 |
| 715 5th St | 0.09mi | 2/2.0 (-1) | 1,292 (-13%) | 1mo | $175,111 | $136 | 69 |
| 317 19th Ave | 0.51mi | 3/1.5 | 1,542 (+4%) | 3mo | $125,000 | $81 | 65 |
| 906 11th St | 0.44mi | 3/2.5 | 1,396 (-6%) | 4mo | $194,000 | $139 | 64 |
| 812 2nd Ave | 0.65mi | 3/2.0 | 1,496 (+1%) | 6mo | $22,000 | $15 | 63 |
| 498 Blockhouse Run Rd | 0.56mi | 3/1.0 | 1,536 (+4%) | 2mo | $119,000 | $77 | 62 |
| 912 Penn Ave | 0.37mi | 3/1.5 | 1,320 (-11%) | 3mo | $63,000 | $48 | 60 |
| 1618 3rd St | 0.43mi | 3/1.0 | 1,344 (-9%) | 2mo | $169,900 | $126 | 59 |
| 210 N 16th Ave | 0.57mi | 2/2.0 (-1) | 1,377 (-7%) | 0mo | $200,000 | $145 | 56 |
| 1416 5th Ave | 0.74mi | 4/1.0 (+1) | 1,506 (+2%) | 4mo | $139,900 | $93 | 50 |
Match score weights: distance 35% · size 25% · config 20% · recency 20%. Top-matched comps best support the ARV.
Projected returns pro-forma
-3.0% appreciation · 3.0% rent growth · sell at horizon
- IRR
- -0.7%
- Equity multiple
- 0.97×
- Total profit
- $-783
- Equity at exit
- $15,656
- IRR
- 9.0%
- Equity multiple
- 1.69×
- Total profit
- $20,348
- Equity at exit
- $9,078
Cash invested: $29,400 (down + closing). Projections, not guarantees.
Landlord ↔ Tenant lean methodology
- Overall (STATE)
- 62 Landlord-Friendly
- State Pennsylvania
- 62 Landlord-Friendly · EVEN
- County
- — inherits STATE
- City
- — inherits STATE
ZIP-level market 15066
- Home prices YoY
- -26.8%
- Active inventory
- 42
- Price-to-rent
- 6.7×
Monthly cashflow live
- Estimated rent
- $1,297 high interval (Pro) →
- Mortgage (P&I)
- −$551
- Tax from tax record
- −$176 /mo · $2,112/yr
- Insurance
- −$44
- HOA
- −$0
- Vacancy / Maint / Mgmt
- −$272
- Net cashflow
- $254
Break-even live
UW: 25.0% down · 7.5% · 30yr · 1.5% tax · 5.0% vac · 8.0% maint · 8.0% mgmt
Financing live
Cash to close
- Down payment
- $26,250
- Closing costs
- $3,150
- Reserves months
- —
- Total cash needed
- —
Loan-product check · same deal, 3 products live
Conventional
25% down · 7.5% · 30yr
- Down + closing
- —
- Monthly P&I
- —
- Monthly cashflow
- —
- DSCR
- —
- Eligible?
- —
Personal DTI + credit; lowest rate.
DSCR
20% down · 8.5% · 30yr
- Down + closing
- —
- Monthly P&I
- —
- Monthly cashflow
- —
- DSCR
- —
- Eligible?
- —
No personal income docs; deal must DSCR.
Hard money
10% down · 12.0% · 12mo
- Down + closing
- —
- Monthly P&I
- —
- Monthly cashflow
- —
- DSCR
- —
- Eligible?
- —
Short-term bridge; refi at stabilization.
Rent comps 7 comps
| Address | Beds | Baths | Sqft | Rent | $/sqft | DOM | Units | Dist |
|---|---|---|---|---|---|---|---|---|
| 1459 4th St New Brighton, PA | 3.0 | 2.0 | 1312 | $1,625 | $1.24 | 14d | 1 | 0.36mi |
| 904 Penn Ave Unit 1 New Brighton, PA | 2.0 | 1.0 | 1300 | $995 | $0.77 | 17d | 1 | 0.36mi |
| 1620 6th Ave New Brighton, PA | 2.0 | 1.0 | 1260 | $975 | $0.77 | 44d | 1 | 0.98mi |
| 418 Darlington Rd Beaver Falls, PA | 2.0 | 1.5 | 975 | $1,350 | $1.38 | 12d | 1 | 1.17mi |
| 1503 3rd Ave Beaver Falls, PA | 3.0 | 1.0 | 1200 | $1,350 | $1.12 | 2d | 1 | 1.18mi |
| 1909 5th Ave New Brighton, PA | 2.0–3.0 | 1.0–2.0 | 807 | $1,523 | $1.89 | 2d | 3 | 1.20mi |
| 1613 4th Ave Beaver Falls, PA | 2.0 | 1.0 | 1016 | $1,200 | $1.18 | 2d | 1 | 1.27mi |
Listing history 24 events
-
2026-06-18days on market $105,000 Active 30 DOM
-
2026-06-17days on market $105,000 Active 29 DOM
-
2026-06-16days on market $105,000 Active 28 DOM
-
2026-06-15days on market $105,000 Active 27 DOM
-
2026-06-13days on market $105,000 Active 25 DOM
-
2026-06-13days on market $105,000 Active 24 DOM
-
2026-06-09days on market $105,000 Active 21 DOM
-
2026-06-08days on market $105,000 Active 20 DOM
-
2026-06-07days on market $105,000 Active 19 DOM
-
2026-06-03days on market $105,000 Active 15 DOM
-
2026-06-02days on market $105,000 Active 14 DOM
-
2026-06-01days on market $105,000 Active 13 DOM
-
2026-05-31days on market $105,000 Active 12 DOM
-
2026-05-15$105,000 Active
-
2017-07-13soldstatus $30,000 Sold 273-char remark
Show marketing remark (273 chars)
Great investor or rental duplex in New Brighton within walking distance to schools, shopping, and dining. Main level unit Master Bedroom has ensuite bathroom. Unit has nice layout. Upper level has 2 bedrooms or use one bedroom as office. Easy access to useable attic space.
-
2017-06-25status Under Contract 273-char remark
Show marketing remark (264 chars)
Great starter home or investor property located in New Brighton! Currently used as duplex. Could be converted back to Single Family Residence. Main level Master Bedroom with ensuite bathroom. Walking distance to schools, shopping, and dining. Appliances included.
-
2017-06-25status Under Contract 264-char remark
Show marketing remark (264 chars)
Great starter home or investor property located in New Brighton! Currently used as duplex. Could be converted back to Single Family Residence. Main level Master Bedroom with ensuite bathroom. Walking distance to schools, shopping, and dining. Appliances included.
-
2017-06-24historical Expired 264-char remark
Show marketing remark (264 chars)
Great starter home or investor property located in New Brighton! Currently used as duplex. Could be converted back to Single Family Residence. Main level Master Bedroom with ensuite bathroom. Walking distance to schools, shopping, and dining. Appliances included.
-
2017-06-06$39,900 Active 273-char remark
Show marketing remark (264 chars)
Great starter home or investor property located in New Brighton! Currently used as duplex. Could be converted back to Single Family Residence. Main level Master Bedroom with ensuite bathroom. Walking distance to schools, shopping, and dining. Appliances included.
-
2017-06-06$39,900 Active 264-char remark
Show marketing remark (264 chars)
Great starter home or investor property located in New Brighton! Currently used as duplex. Could be converted back to Single Family Residence. Main level Master Bedroom with ensuite bathroom. Walking distance to schools, shopping, and dining. Appliances included.
-
2016-08-10soldstatus $15,000
-
2001-08-09soldstatus $72,000
-
1993-03-27soldstatus $50,000
-
1973-11-01soldstatus $11,500
ⓘ Source: listings_history table (triggers on properties + properties_extension) + one-shot
backfill from property_details.listing_events for pre-trigger history.
Tax reassessment forecast PA · Partial reset (capped growth)
- Current annual tax
- $2,112 · $176/mo
- Projected year-2 tax
- $2,112 · $176/mo
- Expected delta
- $0/yr ($0/mo · 0.0%)
ⓘ Screening estimate from a state-policy table — verify with the county assessor before closing.
Climate risk First Street
- Flood 1/10 Low FEMA zone X (unshaded) · 0% chance over 30 yrs
- Wildfire 1/10 Low
- Heat 4/10 Moderate 7 d/yr ≥97°F today · 18 d/yr by 30 yrs out
- Wind 2/10 Low 0% chance of damaging wind over 30 yrs
- Air quality 3/10 Moderate 2 unhealthy d/yr today · 4 by 30 yrs out
Nearby sold comps map
Loading sold comps map…
Walkable amenities ~0.75 mi
Loading nearby amenities…
Taxation est. · year 1
- Rental income
- $15,562
- − Mortgage interest
- −$5,882
- − Property taxes
- −$2,112
- − Insurance
- −$525
- − Repairs & maintenance
- −$1,245
- − Management
- −$1,245
- − Depreciation
- −$3,055
- Taxable income
- $1,499
- Est. tax owed @ 24.0%
- −$360
- After-tax cash flow
- $2,690/yr
For passive investors: Depreciation is non-cash, so a rental often shows a tax loss while cash-flowing — sheltering income. Rental losses are passive: they offset passive income freely, and up to $25,000/yr can offset ordinary (W-2) income if you actively participate and your MAGI is under $100k (phasing out to $0 by $150k); unused losses carry forward. On sale, claimed depreciation is recaptured at up to 25%, and gains may owe capital-gains tax (a 1031 exchange can defer both). Figures are a year-1 estimate at your 24.0% rate — not tax advice; consult a CPA.
Schools (NCES district)
- District
- New Brighton Area SD
- NCES district ID
- 4216530
- Math proficiency
- 17% ▼ -17.00%
- Reading proficiency
- 37% ▼ -22.00%
- Median HH income
- $41,579
- Composite
- 22.83/100
- National rank
- #8014
- State rank
- #458 of 539 in PA
Livability — New Brighton
- Score
- 82/100
- State rank
- #153
- US rank
- #1275
Category grades
Schools grade is shown separately in the Schools card above.
Census & demographics
- Census place
- New Brighton, PA
- County
- Beaver County · 116,001 people
- City population
- 12,048
- Metro
- Pittsburgh, PA
- Population (ZIP)
- 12,048
- Household income
- $63,836
- Rent vs Own
- Severe rent burden
- 187.0
Population outlook (Beaver County) Hauer SSP2
- Today (2025)
- 164,976 people
- By 2030
- 161,449 · -2.1%
- By 2040
- 151,752 · -8.0%
- By 2050
- 141,155 · -14.4%
- By 2075
- 118,142 · -28.4%
- By 2100
- 91,740 · -44.4%
Race, ethnicity, and origin ACS 2023
- Neighborhood character
- Predominantly White (87%)
- Race & ethnicity
- White 87% Black 5% Two or more races 4% Hispanic / Latino 3%
- Common ancestry
- Romanian 6% Serbian 2% Lithuanian 2%
- Foreign-born
- 0%
- Languages at home
- 98% English-only · Spanish 2%
Political lean MEDSL · Beaver
- 2024 margin
- Strong R (+20.7) · D 39.2% · R 59.9%
- 2008→2024 swing
- -17.9pp toward R · 2008: -2.8pp · 2024: -20.7pp
- All cycles
- 2024: R+20.7 2020: R+17.7 2016: R+20.1 2012: R+6.6 2008: R+2.8
Not yet ingested
- Civics
- —
Market trends
- HPI YoY
- ▼ -67.49%
- Current HPI
- 184.7104
- Rent YoY
- —
- Metro
- Pittsburgh, PA
- State GDP YoY
- ▲ 1.68%
- F500 in state
- 34
Industry mix (Fortune 500 HQ in PA)
| Industry | F500 HQs | Revenue |
|---|---|---|
| Healthcare | 2 | $309B |
|
||
| Insurance | 2 | $27B |
|
||
| Telecommunications / Media | 1 | $124B |
|
||
| Industrial Distribution | 1 | $22B |
|
||
| Financial Services | 1 | $20B |
|
||
| Chemicals / Materials | 1 | $18B |
|
||
Price history
+813.0% since first listed11 events — show timeline
- 2026-05-15 Listed $105,000 West Penn MLS
- 2017-07-13 Sold (MLS) $30,000 West Penn MLS
- 2017-06-25 Pending — West Penn MLS
- 2017-06-25 Pending — West Penn MLS
- 2017-06-24 Delisted — West Penn MLS
- 2017-06-06 Listed $39,900 West Penn MLS
- 2017-06-06 Listed $39,900 West Penn MLS
- 2016-08-10 Sold (Public Records) $15,000 Public Records
- 2001-08-09 Sold (Public Records) $72,000 Public Records
- 1993-03-27 Sold (Public Records) $50,000 Public Records
- 1973-11-01 Sold (Public Records) $11,500 Public Records
Property tax history
+55.2%/yrLatest (2026): $2,112 · +4.7% YoY. Source: county tax records.
Cash-flow waterfall
monthlySold comps — $/sqft
last 12 mo · ≤1 miLoading sold comps…