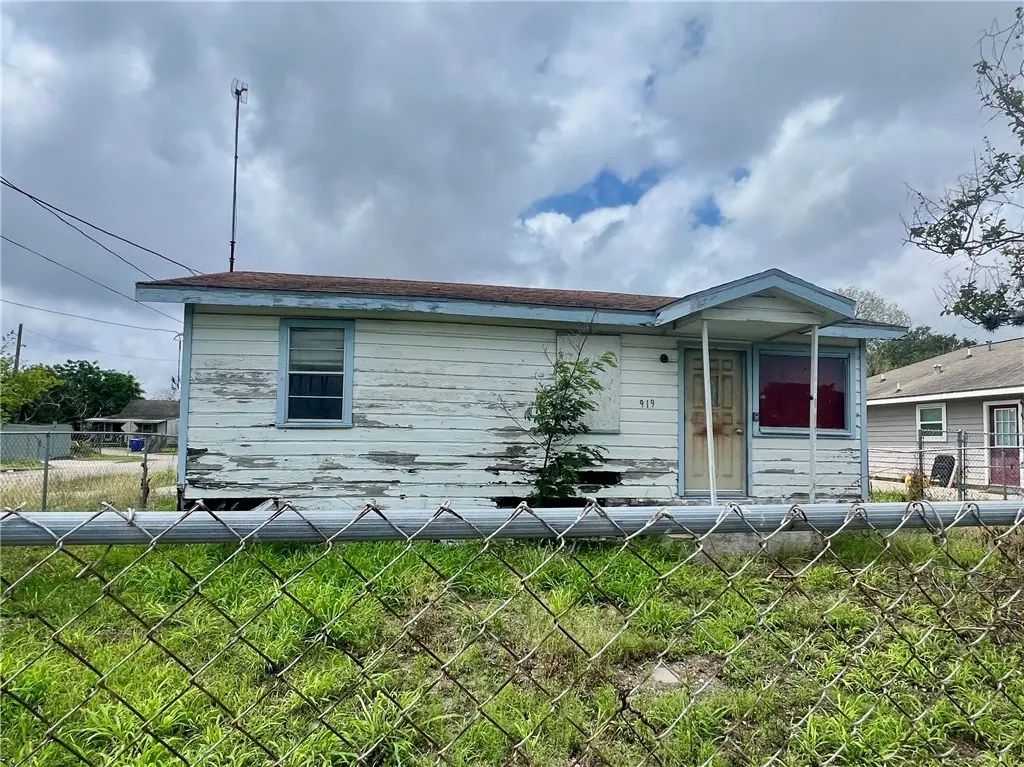
919 S Brownlee Blvd · Corpus Christi, TX
Flood risk 1/10 · Minimal
- FEMA flood zone
- X (unshaded)
- Chance of flooding over 30 yrs
- 0.0%
- Est. flood insurance / yr
- $507 – $1,088
Fire risk 1/10 · Minimal
- Est. fire insurance / yr
- $1,222 – $2,270
Heat risk 10/10 · Severe
- Hot days now (above 107°F)
- 7 days/yr
- Hot days in 30 yrs
- 26 days/yr
Wind risk 9/10 · Severe
- Chance of severe wind over 30 yrs
- 99.0%
Air-quality risk 1/10 · Minimal
- Unhealthy air days now
- 0 days/yr
- Unhealthy air days in 30 yrs
- 0 days/yr
Risk factors via First Street. Map © Google.
Why this score? — see what drove the B- grade
The composite is a weighted blend of 9 inputs, each scored 0–100. Each bar is that input's sub-score; the figure is the points it added to the 100-point composite (weight × sub-score).
- Cash flow +30.0/30.0
- 1% rule +10.0/10.0
- DSCR +10.0/10.0
- ARV discount +4.7/15.0
- Livability +3.9/5.0
- Rent growth +3.0/5.0
- Schools +2.8/10.0
- Condition / age +2.5/5.0
- Appreciation +0.0/10.0
$73,000
🖨 Deal sheet 📄 Offer letter ✓ Due diligence
Listing remarks MLS
Opportunity is knocking on a 7,227 sq ft lot with a 660 sq ft structure built in 1971, this is a full scale rehab or redevelopment play with serious potential. The existing home is in distressed condition and will require a complete overhaul from top to bottom. Exterior siding shows significant wear, interior ceilings and walls need attention, and the overall condition reflects years of deferred maintenance. This is not a lipstick job this is a clean slate investment where you control the outcome and the profit margin. Positioned on a corner lot with solid frontage and layout, the property offers multiple exit strategies. Renovate and hold as a rental with projected rents estimated around $800–$1,100/month, flip for resale, or clear and rebuild to maximize the lot value. The area supports strong rental demand and consistent appreciation trends, making this a strategic addition to any portfolio. Zoned A-2 and located within Corpus Christi city limits, utilities are in place, and the footprint allows for creative repositioning. With a high sell score and favorable cap rate indicators, this is exactly the kind of asset seasoned investors chase when they want to create equity, not wait for it. Cash or hard money only. Property sold as is, where is. No repairs, no concessions. .. .. priced to move and ready for someone who understands the game. If you’re looking for your next project with real upside, this is it.
Key facts
- Strong rental demand
- Utilities in place
- Zoned a-2
Tags
Neighborhood map
What this means for you Summary
Snapshot
- This is a 3-bed/1.0-bath single-family listed at $73k.
Deal economics
- At list price, monthly cash flow is $557 ($7k/yr) — positive.
- The deal already cash-flows at list — no discount required.
- Meets the 1% rule at list price ($1k rent vs $73k).
- Recommended offer: $69k (6.0% below list) — sets the bar for market timing.
- Cap rate 15.4% vs local median 3.6% in Corpus Christi — top-decile yield for the area; either an underpriced asset or a hidden risk that comps aren't pricing in. Stress-test before assuming the spread holds.
Location & tenants
- Location reads 78/100 on livability (#66 in TX, #2,404 nationally) — a middle-class / working-renter tenant base. Strengths: commute A+, cost of living A+, housing A+; Watch: crime F.
- Corpus Christi ISD (urban): math 31% / reading 35% proficiency, ranked #562 of 826 in TX (top 68%) — families likely to look elsewhere, expect single-tenant / working-renter base with shorter leases; 63% free/reduced lunch — lower-income household profile, screen leases tightly.
- Market conditions: Rents rising (+1.9%/yr); 141 active listings in the ZIP; 11 comparable units currently listed for rent nearby; rentals at typical pace (median 22d on market — plan ~3-4 weeks tenant-placement turnaround); 1,397 units permitted in Nueces County in 2024 (47 in 5+ unit buildings).
Forward outlook
- Local home prices are declining (-3.0%/yr); year-one equity from $505 of loan paydown is wiped out by about $2k of value loss. Plan a longer hold.
- Nueces County population projected at +36% by 2050 — long-run rental-demand tailwind backs the buy-and-hold thesis.
- At projected returns (-3.0% appreciation + 1.9% rent growth), your $20k cash investment doubles in ~4 years — after that, you're playing with house money.
Negotiation context
- It's been on market 63 days — a 6% lower offer ($69k) is reasonable based on typical stale-listing flexibility.
Risks & watch-outs
- Watch-outs: property tax is 3.1% of price.
- Climate carrying-cost: severe wind risk, 99% chance of damaging wind over 30y; extreme-heat days projected 7→26/yr by 2055 (HVAC capex compounding) — expect insurance premiums to compound above CPI over the hold.
Questions for the listing agent
- It's been on market 63 days. Have you received any prior offers? Is the seller open to a 6% concession, seller financing, or rate buy-down credit?
- Built in 1971 — when were the roof, HVAC, electrical panel, plumbing, and water heater last replaced?
- Property tax is high relative to price — has the assessment been appealed recently, and will the sale trigger a re-assessment?
- Why hasn't it sold? Are there any deal-killer items the seller is aware of (foundation, flood, title, zoning, code violations)?
- Is there a deadline driving the sale (1031 exchange, divorce, estate, relocation)? That informs how much negotiation room exists.
- Crime grade is F in this area — have there been break-ins, vandalism, or insurance claims at this property in the last 3 years? What carrier currently insures it and at what premium?
- What's the average days-on-market for RENTAL listings here right now (not sales)? A rising rental-DOM trend means longer vacancies and softer asking-rent achievability than the comps imply.
- What's the recent tenant-quality profile in this submarket — average credit score on applications, eviction rate, late-payment / NSF rate, and stable-employment percentage? A property-management company in the area should have these aggregated.
- How much new for-sale + rental construction is in the pipeline within 1–3 miles? Heavy new supply typically softens prices + rents 12–24 months out; constrained supply supports both.
Investment metrics
- 1% rule
- 2.01% ✓
- Cap rate
- 15.45%
- Cash-on-cash
- 32.70%
- DSCR
- 2.46
- GRM
- 4.2
CMA / ARV
- ARV (median comp)
- $68,691
- List price
- $73,000
- Delta
- 6.27%
- Verdict
- FAIR
- Comps
- 20 within 1.0 mi
Show comp detail 3 sales within ~0.75 mi
| Address | Dist | Beds/Ba | Sqft | Sold | Price | $/sf | Match |
|---|---|---|---|---|---|---|---|
| 2424 Ruth St | 0.53mi | 2/1.0 (-1) | 675 (+2%) | 2mo | $23,999 | $36 | 65 |
| 607 17th St | 0.29mi | 2/1.0 (-1) | 588 (-11%) | 5mo | $57,500 | $98 | 60 |
| 2507 Morris St | 0.57mi | 2/1.0 (-1) | 754 (+14%) | 5mo | $75,000 | $99 | 40 |
Match score weights: distance 35% · size 25% · config 20% · recency 20%. Top-matched comps best support the ARV.
Projected returns pro-forma
-3.0% appreciation · 1.87% rent growth · sell at horizon
- IRR
- 26.5%
- Equity multiple
- 2.08×
- Total profit
- $22,080
- Equity at exit
- $10,885
- IRR
- 33.4%
- Equity multiple
- 3.87×
- Total profit
- $58,629
- Equity at exit
- $6,312
Cash invested: $20,440 (down + closing). Projections, not guarantees.
Landlord ↔ Tenant lean methodology
- Overall (STATE)
- 87 Strongly Landlord-Friendly
- State Texas
- 87 Strongly Landlord-Friendly · R+5
- County
- — inherits STATE
- City
- — inherits STATE
ZIP-level market 78404
- Rents YoY
- 1.9%
- Active inventory
- 141
- Price-to-rent
- 4.2×
Monthly cashflow live
- Estimated rent
- $1,465 high interval (Pro) →
- Mortgage (P&I)
- −$383
- Tax from tax record
- −$187 /mo · $2,249/yr
- Insurance
- −$30
- HOA
- −$0
- Vacancy / Maint / Mgmt
- −$308
- Net cashflow
- $557
Break-even live
UW: 25.0% down · 7.5% · 30yr · 1.5% tax · 5.0% vac · 8.0% maint · 8.0% mgmt
Financing live
Cash to close
- Down payment
- $18,250
- Closing costs
- $2,190
- Reserves months
- —
- Total cash needed
- —
Loan-product check · same deal, 3 products live
Conventional
25% down · 7.5% · 30yr
- Down + closing
- —
- Monthly P&I
- —
- Monthly cashflow
- —
- DSCR
- —
- Eligible?
- —
Personal DTI + credit; lowest rate.
DSCR
20% down · 8.5% · 30yr
- Down + closing
- —
- Monthly P&I
- —
- Monthly cashflow
- —
- DSCR
- —
- Eligible?
- —
No personal income docs; deal must DSCR.
Hard money
10% down · 12.0% · 12mo
- Down + closing
- —
- Monthly P&I
- —
- Monthly cashflow
- —
- DSCR
- —
- Eligible?
- —
Short-term bridge; refi at stabilization.
Rent comps 11 comps
| Address | Beds | Baths | Sqft | Rent | $/sqft | DOM | Units | Dist |
|---|---|---|---|---|---|---|---|---|
| 1124 Morgan Ave Unit 1268437P Corpus Christi, TX | 2.0 | 1.0 | 721 | $2,081 | $2.89 | 44d | 1 | 0.40mi |
| 116 Lowell St Corpus Christi, TX | 2.0 | 1.0 | 628 | $995 | $1.58 | 21d | 1 | 0.57mi |
| 1603 Caldwell St Corpus Christi, TX | 2.0 | 1.0 | 628 | $995 | $1.58 | 21d | 1 | 0.59mi |
| 522 Hancock Ave Corpus Christi, TX | 1.0–2.0 | 1.0–2.0 | 915 | $2,000 | $2.18 | 14d | 10 | 0.65mi |
| 802 S Carancahua St Corpus Christi, TX | 2.0 | 1.0–2.0 | 869 | $1,770 | $2.04 | 14d | 68 | 0.65mi |
| 1114 25th St Corpus Christi, TX | 1.0–2.0 | 1.0 | 712 | $1,050 | $1.47 | 14d | 6 | 0.76mi |
| 2937 Ruth St Corpus Christi, TX | 2.0 | 1.0 | 676 | $950 | $1.41 | 44d | 1 | 1.02mi |
| 3115 Agnes St Corpus Christi, TX | 2.0 | 1.0 | 428 | $828 | $1.93 | 44d | 3 | 1.21mi |
| 317 Peoples St Corpus Christi, TX | 2.0 | 1.0–2.0 | 768 | $1,850 | $2.41 | 14d | 1 | 1.25mi |
| 815 Ohio Ave Unit 3 Corpus Christi, TX | 2.0 | 1.0 | 748 | $985 | $1.32 | 44d | 1 | 1.40mi |
| 3302 Up River Rd Corpus Christi, TX | 2.0 | 1.0 | 710 | $699 | $0.98 | 14d | 1 | 1.47mi |
Listing history 16 events
-
2026-06-18days on market $73,000 Active 63 DOM
-
2026-06-17days on market $73,000 Active 62 DOM
-
2026-06-16days on market $73,000 Active 61 DOM
-
2026-06-15days on market $73,000 Active 60 DOM
-
2026-06-14days on market $73,000 Active 58 DOM
-
2026-06-10days on market $73,000 Active 55 DOM
-
2026-06-09days on market $73,000 Active 54 DOM
-
2026-06-08days on market $73,000 Active 53 DOM
-
2026-06-07days on market $73,000 Active 52 DOM
-
2026-06-05days on market $73,000 Active 49 DOM
-
2026-06-03days on market $73,000 Active 48 DOM
-
2026-06-02days on market $73,000 Active 47 DOM
-
2026-06-01days on market $73,000 Active 46 DOM
-
2026-05-31days on market $73,000 Active 45 DOM
-
2026-05-30days on market $73,000 Active 44 DOM
-
2026-04-16$73,000 Active 1443-char remark
Show marketing remark (1443 chars)
Opportunity is knocking on a 7,227 sq ft lot with a 660 sq ft structure built in 1971, this is a full scale rehab or redevelopment play with serious potential. The existing home is in distressed condition and will require a complete overhaul from top to bottom. Exterior siding shows significant wear, interior ceilings and walls need attention, and the overall condition reflects years of deferred maintenance. This is not a lipstick job this is a clean slate investment where you control the outcome and the profit margin. Positioned on a corner lot with solid frontage and layout, the property offers multiple exit strategies. Renovate and hold as a rental with projected rents estimated around $800–$1,100/month, flip for resale, or clear and rebuild to maximize the lot value. The area supports strong rental demand and consistent appreciation trends, making this a strategic addition to any portfolio. Zoned A-2 and located within Corpus Christi city limits, utilities are in place, and the footprint allows for creative repositioning. With a high sell score and favorable cap rate indicators, this is exactly the kind of asset seasoned investors chase when they want to create equity, not wait for it. Cash or hard money only. Property sold as is, where is. No repairs, no concessions. .. .. priced to move and ready for someone who understands the game. If you’re looking for your next project with real upside, this is it.
ⓘ Source: listings_history table (triggers on properties + properties_extension) + one-shot
backfill from property_details.listing_events for pre-trigger history.
Tax reassessment forecast TX · Resets to sale price
- Current annual tax
- $2,249 · $187/mo
- Projected year-2 tax
- $2,249 · $187/mo
- Expected delta
- $0/yr ($0/mo · 0.0%)
ⓘ Screening estimate from a state-policy table — verify with the county assessor before closing.
Climate risk First Street
- Flood 1/10 Low FEMA zone X (unshaded) · 0% chance over 30 yrs
- Wildfire 1/10 Low
- Heat 10/10 Extreme 7 d/yr ≥107°F today · 26 d/yr by 30 yrs out
- Wind 9/10 Extreme 99% chance of damaging wind over 30 yrs
- Air quality 1/10 Low 0 unhealthy d/yr today · 0 by 30 yrs out
Nearby sold comps map
Loading sold comps map…
Walkable amenities ~0.75 mi
Loading nearby amenities…
Taxation est. · year 1
- Rental income
- $17,585
- − Mortgage interest
- −$4,089
- − Property taxes
- −$2,249
- − Insurance
- −$365
- − Repairs & maintenance
- −$1,407
- − Management
- −$1,407
- − Depreciation
- −$2,124
- Taxable income
- $5,944
- Est. tax owed @ 24.0%
- −$1,427
- After-tax cash flow
- $5,257/yr
For passive investors: Depreciation is non-cash, so a rental often shows a tax loss while cash-flowing — sheltering income. Rental losses are passive: they offset passive income freely, and up to $25,000/yr can offset ordinary (W-2) income if you actively participate and your MAGI is under $100k (phasing out to $0 by $150k); unused losses carry forward. On sale, claimed depreciation is recaptured at up to 25%, and gains may owe capital-gains tax (a 1031 exchange can defer both). Figures are a year-1 estimate at your 24.0% rate — not tax advice; consult a CPA.
Schools (NCES district)
- District
- Corpus Christi ISD
- NCES district ID
- 4815270
- Math proficiency
- 31% ▼ -18.00%
- Reading proficiency
- 35% ▼ -7.00%
- Median HH income
- $45,672
- Composite
- 28.27/100
- National rank
- #6793
- State rank
- #562 of 826 in TX
Livability — Corpus Christi
- Score
- 78/100
- State rank
- #66
- US rank
- #2404
Category grades
Schools grade is shown separately in the Schools card above.
Census & demographics
- Census place
- Corpus Christi, TX
- County
- Nueces County · 296,836 people
- City population
- 296,836
- Metro
- Corpus Christi, TX
- Population (ZIP)
- 12,635
- Household income
- $61,280
- Rent vs Own
- Severe rent burden
- 596.0
Population outlook (Nueces County) Hauer SSP2
- Today (2025)
- 418,037 people
- By 2030
- 447,123 · +7.0%
- By 2040
- 505,911 · +21.0%
- By 2050
- 567,522 · +35.8%
- By 2075
- 729,686 · +74.6%
- By 2100
- 847,087 · +102.6%
Race, ethnicity, and origin ACS 2023
- Neighborhood character
- Majority Hispanic (62%)
- Race & ethnicity
- Hispanic / Latino 62% White 32% Two or more races 29% Black 4%
- Hispanic origin (detail)
- Mexican 56%
- Common ancestry
- Slovak 3% Italian 2% Lithuanian 1%
- Foreign-born
- 9% · Canada
- Languages at home
- 61% English-only · Spanish 39%
Political lean MEDSL · Nueces
- 2024 margin
- R (+11.5) · D 43.8% · R 55.3%
- 2008→2024 swing
- -7.1pp toward R · 2008: -4.4pp · 2024: -11.5pp
- All cycles
- 2024: R+11.5 2020: R+2.9 2016: R+1.5 2012: R+3.2 2008: R+4.4
Not yet ingested
- Civics
- —
Market trends
- HPI YoY
- ▼ -211.10%
- Current HPI
- 177.4759
- Rent YoY
- ▲ 1.87%
- Metro
- Corpus Christi, TX
- State GDP YoY
- ▲ 3.95%
- F500 in state
- 110
Industry mix (Fortune 500 HQ in TX)
| Industry | F500 HQs | Revenue |
|---|---|---|
| Energy | 16 | $1,198B |
|
||
| Technology | 5 | $198B |
|
||
| Engineering / Construction | 4 | $72B |
|
||
| Energy Services | 3 | $60B |
|
||
| Utilities | 3 | $41B |
|
||
| Healthcare | 2 | $330B |
|
||
Price history
1 event — show timeline
- 2026-04-16 Listed $73,000 CBMLS
Property tax history
+9.5%/yrLatest (2025): $2,249 · +9.1% YoY. Source: county tax records.
Cash-flow waterfall
monthlySold comps — $/sqft
last 12 mo · ≤1 miLoading sold comps…