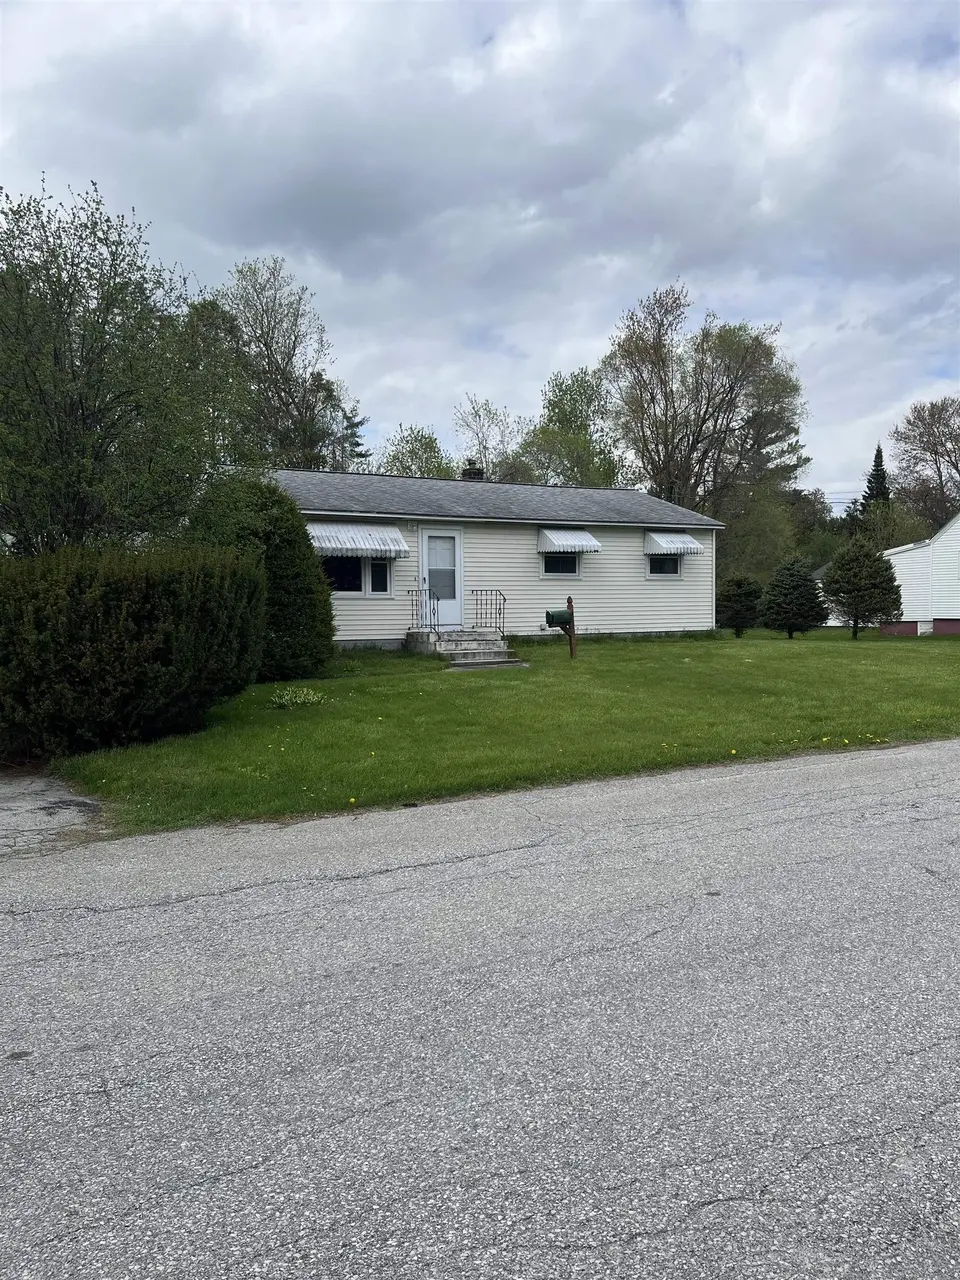
99 First St · Rutland, VT
Flood risk 1/10 · Minimal
- FEMA flood zone
- X (unshaded)
- Chance of flooding over 30 yrs
- 0.0%
- Est. flood insurance / yr
- $473 – $860
Fire risk 1/10 · Minimal
- Est. fire insurance / yr
- $480 – $892
Heat risk 2/10 · Minimal
- Hot days now (above 92°F)
- 7 days/yr
- Hot days in 30 yrs
- 17 days/yr
Wind risk 2/10 · Minimal
- Chance of severe wind over 30 yrs
- 4.0%
Air-quality risk 1/10 · Minimal
- Unhealthy air days now
- 0 days/yr
- Unhealthy air days in 30 yrs
- 0 days/yr
Risk factors via First Street. Map © Google.
Why this score? — see what drove the B- grade
The composite is a weighted blend of 9 inputs, each scored 0–100. Each bar is that input's sub-score; the figure is the points it added to the 100-point composite (weight × sub-score).
- Cash flow +23.3/30.0
- ARV discount +15.0/15.0
- DSCR +7.5/10.0
- 1% rule +5.5/10.0
- Schools +5.0/10.0
- Livability +4.0/5.0
- Rent growth +2.5/5.0
- Condition / age +2.5/5.0
- Appreciation +0.0/10.0
$175,000
🖨 Deal sheet (PDF) 📄 Offer letter ✓ Due diligence
Listing remarks
Welcome to 99 First Street, a cute and well built home located just steps from downtown Rutland’s shops, dining, hospital, and activities. The current owners have lived here since 1998 and so the home has definitely been lived in and loved and will require some TLC to bring it back to life. The main floor features hardwood floors throughout, three nice size bedrooms, one full bath and a welcoming living room—perfect for gatherings and everyday living. The partially finished basement offers a great space to finish and make into a family room, game room, or bonus room. A large, private backyard bordered by trees all around, is ideal for enjoying summer nights by a fire, gardening
Key facts
- Steps from downtown
- Private backyard
- Hardwood floors
Tags
Property features AI
Exterior
- Parking: 2-car garage; Paved driveway
- Utilities: Public water; Public sewer; Circuit breaker electrical service; High-speed internet available; Cable available; Telephone service available
- Home design: Ranch-style home; Existing construction; Cream exterior color; Shingle roof
- Construction: Built in 1957; Vinyl siding
- Exterior features: City lot, level yard; Near golf course, shopping, public transportation, and hospital; Neighborhood setting
Interior
- Kitchen: Electric range; Refrigerator; Exhaust hood; Garbage disposal
- Bedrooms: Three bedrooms (all on main level)
- Flooring: Hardwood floors; Vinyl floors
- Bathrooms: One full bathroom
- Heating & cooling: Baseboard heating
- Interior features: 6 total rooms; Partially finished, climate-controlled basement with concrete floor, storage space, and interior stair access
- Laundry & utility: Washer; Dryer
Neighborhood map
What this means for you Summary
Snapshot
- This is a 3-bed/1.0-bath single-family listed at $175k.
Deal economics
- At list price, monthly cash flow is $321 ($4k/yr) — positive.
- The deal already cash-flows at list — no discount required.
- Meets the 1% rule at list price ($2k rent vs $175k).
- Cap rate 8.5% vs local median 4.4% in Rutland — top-decile yield for the area; either an underpriced asset or a hidden risk that comps aren't pricing in. Stress-test before assuming the spread holds.
Location & tenants
- Location reads 81/100 on livability (#6 in VT, #1,410 nationally) — a professional / high-income tenant draw. Strengths: commute A+, cost of living A+, health & safety A+; Watch: employment C-, crime F.
- Zoned schools: Rutland Intermediate School (math 22% / reading 32%, grade F, #151 of 192 statewide, top 82%, 493 students, 54% FRL); Rutland Middle School (math 11% / reading 22%, grade F, #26 of 26 statewide, top 100%, 254 students, 49% FRL); Rutland Senior High School (math 37% / reading 47%, grade F, #18 of 48 statewide, top 38%, 752 students, 33% FRL).
- Market conditions: 97 active listings in the ZIP; 90 units permitted in Rutland County in 2024 (0 in 5+ unit buildings).
Forward outlook
- Local home prices are declining (-3.0%/yr); year-one equity from $1k of loan paydown is wiped out by about $5k of value loss. Plan a longer hold.
- Rutland County population projected at -28% by 2050 — secular population decline; favor cash flow + early exit over multi-decade hold.
Negotiation context
- Only 9 days on market — expect competitive offers; lowballing is unlikely to land.
Risks & watch-outs
- Watch-outs: built in 1957 — expect roof / HVAC / electrical / plumbing capex.
Questions for the listing agent
- Built in 1957 — when were the roof, HVAC, electrical panel, plumbing, and water heater last replaced?
- Is there a deadline driving the sale (1031 exchange, divorce, estate, relocation)? That informs how much negotiation room exists.
- Schools are A-rated — typically a magnet for longer-tenancy family renters. What's the average tenant stay here, and is there a school-zone premium baked into asking?
- Crime grade is F in this area — have there been break-ins, vandalism, or insurance claims at this property in the last 3 years? What carrier currently insures it and at what premium?
- What's the average days-on-market for RENTAL listings here right now (not sales)? A rising rental-DOM trend means longer vacancies and softer asking-rent achievability than the comps imply.
- What's the recent tenant-quality profile in this submarket — average credit score on applications, eviction rate, late-payment / NSF rate, and stable-employment percentage? A property-management company in the area should have these aggregated.
- How much new for-sale + rental construction is in the pipeline within 1–3 miles? Heavy new supply typically softens prices + rents 12–24 months out; constrained supply supports both.
Investment metrics
- 1% rule
- 1.05% ✓
- Cap rate
- 8.50%
- Cash-on-cash
- 7.86%
- DSCR
- 1.35
- GRM
- 7.9
CMA / ARV
- ARV (median comp)
- $214,303
- List price
- $175,000
- Delta
- -18.34%
- Verdict
- UNDERPRICED
- Comps
- 20 within 1.0 mi
Show comp detail 2 sales within ~0.75 mi
| Address | Dist | Beds/Ba | Sqft | Sold | Price | $/sf | Match |
|---|---|---|---|---|---|---|---|
| 133 Dorr Dr | 0.63mi | 4/2.0 (+1) | 2,136 (+3%) | 6mo | $315,000 | $147 | 52 |
| 50 Morse Pl | 0.56mi | 4/1.5 (+1) | 2,256 (+9%) | 6mo | $262,400 | $116 | 47 |
Match score weights: distance 35% · size 25% · config 20% · recency 20%. Top-matched comps best support the ARV.
Projected returns pro-forma
-3.0% appreciation · 3.0% rent growth · sell at horizon
- IRR
- -4.3%
- Equity multiple
- 0.84×
- Total profit
- $-7,925
- Equity at exit
- $26,093
- IRR
- 5.3%
- Equity multiple
- 1.39×
- Total profit
- $19,351
- Equity at exit
- $15,131
Cash invested: $49,000 (down + closing). Projections, not guarantees.
Landlord ↔ Tenant lean methodology
- Overall (STATE)
- 41 Moderately Tenant-Leaning
- State Vermont
- 41 Moderately Tenant-Leaning · D+15
- County
- — inherits STATE
- City
- — inherits STATE
ZIP-level market 05701
- Home prices YoY
- -18.1%
- Active inventory
- 97
- Price-to-rent
- 7.9×
Monthly cashflow live
- Estimated rent
- $1,837 medium interval (Pro) →
- Mortgage (P&I)
- −$918
- Tax from tax record
- −$139 /mo · $1,673/yr
- Insurance
- −$73
- HOA
- −$0
- Vacancy / Maint / Mgmt
- −$386
- Net cashflow
- $321
Break-even live
Sensitivity live
| Price | -10% $420 | -5% $371 | +0% $321 | +5% $272 | +10% $222 |
|---|---|---|---|---|---|
| Rent | -10% $176 | -5% $249 | +0% $321 | +5% $394 | +10% $466 |
| Rate | -1.0pp $409 | -0.5pp $366 | base $321 | +0.5pp $276 | +1.0pp $230 |
UW: 25.0% down · 7.5% · 30yr · 1.5% tax · 5.0% vac · 8.0% maint · 8.0% mgmt
Financing live
Cash to close
- Down payment
- $43,750
- Closing costs
- $5,250
- Reserves months
- —
- Total cash needed
- —
Loan-product check · same deal, 3 products live
Conventional
25% down · 7.5% · 30yr
- Down + closing
- —
- Monthly P&I
- —
- Monthly cashflow
- —
- DSCR
- —
- Eligible?
- —
Personal DTI + credit; lowest rate.
DSCR
20% down · 8.5% · 30yr
- Down + closing
- —
- Monthly P&I
- —
- Monthly cashflow
- —
- DSCR
- —
- Eligible?
- —
No personal income docs; deal must DSCR.
Hard money
10% down · 12.0% · 12mo
- Down + closing
- —
- Monthly P&I
- —
- Monthly cashflow
- —
- DSCR
- —
- Eligible?
- —
Short-term bridge; refi at stabilization.
Listing history 2 events
-
2026-05-18status Pending 999-char remark
-
2026-05-09$175,000 Active 999-char remark
ⓘ Source: listings_history table (triggers on properties + properties_extension) + one-shot
backfill from property_details.listing_events for pre-trigger history.
Tax reassessment forecast VT · Partial reset (capped growth)
- Current annual tax
- $1,673 · $139/mo
- Projected year-2 tax
- $2,499 · $208/mo
- Expected delta
- +$826/yr (+$69/mo · 49.4%)
ⓘ Screening estimate from a state-policy table — verify with the county assessor before closing.
Climate risk First Street
- Flood 1/10 Low FEMA zone X (unshaded) · 0% chance over 30 yrs
- Wildfire 1/10 Low
- Heat 2/10 Low 7 d/yr ≥92°F today · 17 d/yr by 30 yrs out
- Wind 2/10 Low 4% chance of damaging wind over 30 yrs
- Air quality 1/10 Low 0 unhealthy d/yr today · 0 by 30 yrs out
Nearby sold comps map
Loading sold comps map…
Walkable amenities ~0.75 mi
Loading nearby amenities…
Taxation est. · year 1
- Rental income
- $22,043
- − Mortgage interest
- −$9,803
- − Property taxes
- −$1,673
- − Insurance
- −$875
- − Repairs & maintenance
- −$1,763
- − Management
- −$1,763
- − Depreciation
- −$5,091
- Taxable income
- $1,075
- Est. tax owed @ 24.0%
- −$258
- After-tax cash flow
- $3,596/yr
For passive investors: Depreciation is non-cash, so a rental often shows a tax loss while cash-flowing — sheltering income. Rental losses are passive: they offset passive income freely, and up to $25,000/yr can offset ordinary (W-2) income if you actively participate and your MAGI is under $100k (phasing out to $0 by $150k); unused losses carry forward. On sale, claimed depreciation is recaptured at up to 25%, and gains may owe capital-gains tax (a 1031 exchange can defer both). Figures are a year-1 estimate at your 24.0% rate — not tax advice; consult a CPA.
Schools (NCES district)
No district data.
Livability — Rutland
- Score
- 81/100
- State rank
- #6
- US rank
- #1410
Category grades
Schools grade is shown separately in the Schools card above.
Census & demographics
- Census place
- Rutland, VT
- Population (ZIP)
- 20,142
Population outlook (Rutland County) Hauer SSP2
- Today (2025)
- 55,307 people
- By 2030
- 52,364 · -5.3%
- By 2040
- 45,751 · -17.3%
- By 2050
- 39,627 · -28.4%
- By 2075
- 29,080 · -47.4%
- By 2100
- 20,673 · -62.6%
Race, ethnicity, and origin ACS 2023
- Neighborhood character
- Predominantly White (94%)
- Race & ethnicity
- White 94% Two or more races 4% Hispanic / Latino 2%
- Common ancestry
- Lithuanian 14% Romanian 6% Slovak 3%
- Foreign-born
- 2% · Canada
- Languages at home
- 94% English-only · Spanish 3% French/Haitian/Cajun 1% Other Asian/Pacific 1%
Political lean MEDSL · Rutland
- 2024 margin
- Lean D (+5.3) · D 51.3% · R 46.0% · Other 2.7%
- 2008→2024 swing
- -19.3pp toward R · 2008: 24.6pp · 2024: 5.3pp
- All cycles
- 2024: D+5.3 2020: D+10.5 2016: D+4.2 2012: D+22.0 2008: D+24.6
Not yet ingested
- Civics
- —
Market trends
- HPI YoY
- ▼ -63.90%
- Current HPI
- 288.4214
- Rent YoY
- —
- Metro
- —
- State GDP YoY
- —
- F500 in state
- 0
Price history
2 events — show timeline
- 2026-05-18 Pending — PrimeMLS
- 2026-05-09 Listed $175,000 PrimeMLS
Property tax history
+16.3%/yrLatest (2024): $1,673 · +6.3% YoY. Source: county tax records.
Cash-flow waterfall
monthlySold comps — $/sqft
last 12 mo · ≤1 miLoading sold comps…