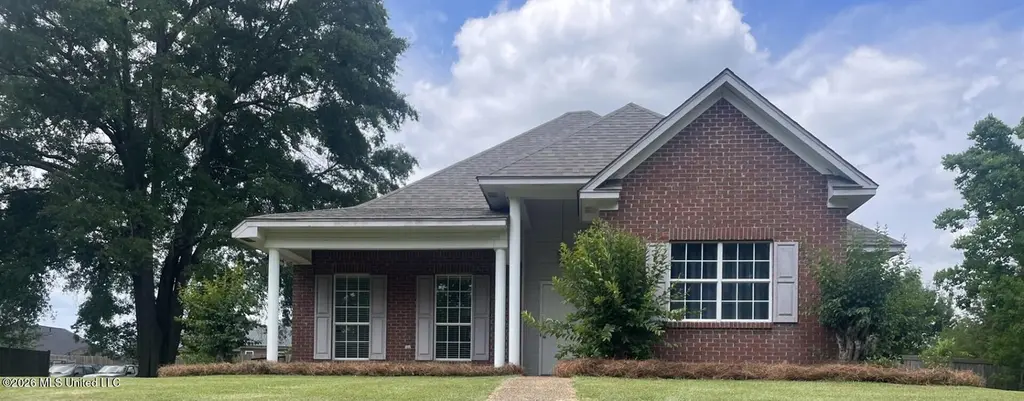
119 Arrow Dr · Clinton, MS
Flood risk 1/10 · Minimal
- FEMA flood zone
- X (unshaded)
- Chance of flooding over 30 yrs
- 0.0%
- Est. flood insurance / yr
- $507 – $1,088
Fire risk 3/10 · Minor
- Est. fire insurance / yr
- $1,241 – $2,305
Heat risk 7/10 · Major
- Hot days now (above 108°F)
- 7 days/yr
- Hot days in 30 yrs
- 20 days/yr
Wind risk 8/10 · Major
- Chance of severe wind over 30 yrs
- 80.0%
Air-quality risk 1/10 · Minimal
- Unhealthy air days now
- 0 days/yr
- Unhealthy air days in 30 yrs
- 0 days/yr
Risk factors via First Street. Map © Google.
Why this score? — see what drove the D grade
The composite is a weighted blend of 9 inputs, each scored 0–100. Each bar is that input's sub-score; the figure is the points it added to the 100-point composite (weight × sub-score).
- Cash flow +14.8/30.0
- ARV discount +8.6/15.0
- Schools +4.8/10.0
- DSCR +4.5/10.0
- 1% rule +3.5/10.0
- Livability +3.5/5.0
- Condition / age +2.5/5.0
- Rent growth +1.6/5.0
- Appreciation +0.0/10.0
$259,500
🖨 Deal sheet (PDF) 📄 Offer letter ✓ Due diligence
Listing remarks MLS
Great buy in one of Clinton's newest neighborhoods. Nice open plan with Fireplace. Patio and Deck.
Key facts
- Open floor plan
- Deck
- Patio
Tags
Property features AI
Finance
- Other: Property size listed as 1,750 (source: builder); Lot approximately 0.47 acre
- HOA & community: Homeowners association with an annual fee of $300; Community sidewalks; Hiking/walking trails
Exterior
- Parking: Attached 2-car garage; Garage door opener; Garage faces rear; 2 total parking spaces
- Utilities: Public water; Public sewer; Electricity connected; Natural gas connected
- Home design: Single family residence (house); One level; Move-in ready; Brick exterior; Faces unspecified direction
- Construction: Built by builder (year source: builder); Slab foundation; Asphalt shingle roof; Brick construction
- Exterior features: Deck; Private yard; Fenced backyard
Interior
- Kitchen: Dishwasher; Disposal; Microwave; Refrigerator; Eat-in kitchen
- Flooring: Luxury vinyl
- Bathrooms: 2 full bathrooms
- Heating & cooling: Central heating (natural gas); Fireplace heating; Central air; Ceiling fan(s)
- Interior features: Bookcases; Ceiling fan(s); Eat-in kitchen; Entrance foyer; Soaking tub; Vaulted ceilings; Walk-in closet(s); Double vanity; Insulated windows; Window treatments; Gas log fireplace in living room
- Laundry & utility: Gas water heater
Neighborhood map
What this means for you Summary
Snapshot
- This is a 3-bed/2.0-bath single-family listed at $260k.
Deal economics
- At list price, monthly cash flow is $69 ($829/yr) — positive.
- The deal already cash-flows at list — no discount required.
- To meet the 1% rule (rent ≥ 1% of price), the offer needs to be $220k (15.4% below list).
- Recommended offer: $220k (15.4% below list) — sets the bar for 1% rule.
- Cap rate 6.6% vs local median 4.4% in Clinton — top-decile yield for the area; either an underpriced asset or a hidden risk that comps aren't pricing in. Stress-test before assuming the spread holds.
Location & tenants
- Location reads 69/100 on livability (#49 in MS) — a middle-class / working-renter tenant base. Strengths: crime A+, cost of living A+, housing A+; Watch: amenities F, commute F, health & safety F.
- Clinton Public School District (rural): math 58% / reading 53% proficiency, ranked #4 of 130 in MS (top 3%) — acceptable for families but not a draw, mixed tenant base, ~2y average lease.
- Zoned schools: Clinton Park Elem School (712 students, 100% FRL); Clinton Jr Hi School (math 69% / reading 54%, grade B+, #6 of 179 statewide, top 3%, 871 students, 100% FRL) — zoned schools average 100% FRL vs 38% district-wide (61 pts higher); higher-poverty schools than district average — tighter screening recommended.
- Market conditions: Rents falling (-3.7%/yr); 236 active listings in the ZIP; 2 comparable units currently listed for rent nearby; solid renter incomes; 167 units permitted in Hinds County in 2024 (0 in 5+ unit buildings).
- This rent runs 35% of the median local income ($75k/yr) — at the standard rent-burdened threshold; future hikes will face affordability resistance.
Forward outlook
- Local home prices are declining (-3.0%/yr); year-one equity from $2k of loan paydown is wiped out by about $8k of value loss. Plan a longer hold.
- Hinds County population projected to shrink 6% by 2050 — rents likely to lag national; underwrite the cash flow, not the appreciation.
Negotiation context
- It's been on market 30 days — a 2% lower offer ($256k) is reasonable based on typical stale-listing flexibility.
- 2 sale attempts since 24y ago with the ask held roughly flat each time — persistent listings suggest the price (not the market) is what's stuck; bring a comps-based counter.
Risks & watch-outs
- Climate carrying-cost: severe wind risk, 80% chance of damaging wind over 30y; extreme-heat days projected 7→20/yr by 2055 (HVAC capex compounding) — expect insurance premiums to compound above CPI over the hold.
Questions for the listing agent
- What does the HOA fee cover, when was the last increase, and are there any pending special assessments or reserve-fund shortfalls?
- Is there a deadline driving the sale (1031 exchange, divorce, estate, relocation)? That informs how much negotiation room exists.
- Schools are B-rated — typically a magnet for longer-tenancy family renters. What's the average tenant stay here, and is there a school-zone premium baked into asking?
- The area grade is low — what's the realistic commute time and amenity access for the typical tenant pool here? Any planned neighborhood developments (good or bad) we should know about?
- What's the average days-on-market for RENTAL listings here right now (not sales)? A rising rental-DOM trend means longer vacancies and softer asking-rent achievability than the comps imply.
- What's the recent tenant-quality profile in this submarket — average credit score on applications, eviction rate, late-payment / NSF rate, and stable-employment percentage? A property-management company in the area should have these aggregated.
- How much new for-sale + rental construction is in the pipeline within 1–3 miles? Heavy new supply typically softens prices + rents 12–24 months out; constrained supply supports both.
Investment metrics
- 1% rule
- 0.85% ✗
- Cap rate
- 6.61%
- Cash-on-cash
- 1.14%
- DSCR
- 1.05
- GRM
- 9.8
CMA / ARV
- ARV (on-the-fly)
- $265,980
- Comps found
- 12
Show comp detail 12 sales within ~0.75 mi
| Address | Dist | Beds/Ba | Sqft | Sold | Price | $/sf | Match |
|---|---|---|---|---|---|---|---|
| 172 Navajo Cir | 0.08mi | 3/2.0 | 1,706 (-1%) | 8mo | $279,900 | $164 | 88 |
| 149 Navajo Cir | 0.11mi | 3/2.0 | 1,876 (+9%) | 7mo | $289,900 | $155 | 73 |
| 314 Hunters Ridge Dr | 0.21mi | 3/2.0 | 1,888 (+10%) | 1mo | $289,000 | $153 | 73 |
| 128 Warrior Ln | 0.17mi | 4/2.0 (+1) | 1,866 (+9%) | 1mo | $289,000 | $155 | 72 |
| 1203 Rockingham Dr | 0.57mi | 3/2.0 | 1,729 (+1%) | 5mo | $225,000 | $130 | 67 |
| 1214 Pineview Dr | 0.49mi | 3/2.0 | 1,628 (-5%) | 3mo | $209,900 | $129 | 66 |
| 112 Trace Pointe Pl | 0.41mi | 3/3.0 | 1,806 (+5%) | 9mo | $359,900 | $199 | 61 |
| 1221 Huntcliff Way | 0.69mi | 3/2.0 | 1,807 (+5%) | 5mo | $215,000 | $119 | 55 |
| 908 Live Oak Dr | 0.69mi | 3/2.0 | 1,822 (+6%) | 4mo | $210,000 | $115 | 54 |
| 1012 Briarwood Dr | 0.74mi | 3/2.0 | 1,676 (-2%) | 9mo | $199,500 | $119 | 54 |
| 110 Trace Pointe Pl | 0.41mi | 4/3.0 (+1) | 1,964 (+14%) | 0mo | $389,900 | $199 | 47 |
| 120 Trace Pointe Pl | 0.41mi | 4/3.0 (+1) | 1,940 (+13%) | 9mo | $374,900 | $193 | 43 |
Match score weights: distance 35% · size 25% · config 20% · recency 20%. Top-matched comps best support the ARV.
Projected returns pro-forma
-3.0% appreciation · 0.0% rent growth · sell at horizon
- IRR
- -17.7%
- Equity multiple
- 0.39×
- Total profit
- $-44,129
- Equity at exit
- $38,692
- IRR
- -16.3%
- Equity multiple
- 0.20×
- Total profit
- $-57,815
- Equity at exit
- $22,437
Cash invested: $72,660 (down + closing). Projections, not guarantees.
Landlord ↔ Tenant lean methodology
- Overall (STATE)
- 90 Strongly Landlord-Friendly
- State Mississippi
- 90 Strongly Landlord-Friendly · R+11
- County
- — inherits STATE
- City
- — inherits STATE
ZIP-level market 39056
- Rents YoY
- -3.7%
- Active inventory
- 236
- Price-to-rent
- 9.8×
Monthly cashflow live
- Estimated rent
- $2,196 medium interval (Pro) →
- Mortgage (P&I)
- −$1,361
- Tax from tax record
- −$172 /mo · $2,061/yr
- Insurance
- −$108
- HOA
- −$25
- Vacancy / Maint / Mgmt
- −$461
- Net cashflow
- $69
Break-even live
Sensitivity live
| Price | -10% $216 | -5% $143 | +0% $69 | +5% $-4 | +10% $-78 |
|---|---|---|---|---|---|
| Rent | -10% $-104 | -5% $-18 | +0% $69 | +5% $156 | +10% $243 |
| Rate | -1.0pp $200 | -0.5pp $135 | base $69 | +0.5pp $2 | +1.0pp $-67 |
UW: 25.0% down · 7.5% · 30yr · 1.5% tax · 5.0% vac · 8.0% maint · 8.0% mgmt
Financing live
Cash to close
- Down payment
- $64,875
- Closing costs
- $7,785
- Reserves months
- —
- Total cash needed
- —
Loan-product check · same deal, 3 products live
Conventional
25% down · 7.5% · 30yr
- Down + closing
- —
- Monthly P&I
- —
- Monthly cashflow
- —
- DSCR
- —
- Eligible?
- —
Personal DTI + credit; lowest rate.
DSCR
20% down · 8.5% · 30yr
- Down + closing
- —
- Monthly P&I
- —
- Monthly cashflow
- —
- DSCR
- —
- Eligible?
- —
No personal income docs; deal must DSCR.
Hard money
10% down · 12.0% · 12mo
- Down + closing
- —
- Monthly P&I
- —
- Monthly cashflow
- —
- DSCR
- —
- Eligible?
- —
Short-term bridge; refi at stabilization.
Rent comps 2 comps
| Address | Beds | Baths | Sqft | Rent | $/sqft | DOM | Units | Dist |
|---|---|---|---|---|---|---|---|---|
| 106 Horseshoe Blvd Clinton, MS | 4.0 | 2.0 | 2091 | $2,800 | $1.34 | 45d | 1 | 1.17mi |
| 112 E Sproles St Clinton, MS | 2.0 | 1.0 | 1068 | $1,500 | $1.40 | 15d | 1 | 1.46mi |
HOA detail
- Monthly dues
- $25 · $300/yr
Listing history 24 events
-
2026-06-21days on market $259,500 Active 30 DOM
-
2026-06-18days on market $259,500 Active 27 DOM
-
2026-06-17days on market $259,500 Active 26 DOM
-
2026-06-16days on market $259,500 Active 25 DOM
-
2026-06-15price $259,500 Active 24 DOM
-
2026-06-15days on market $269,500 Active 24 DOM
-
2026-06-14days on market $269,500 Active 22 DOM
-
2026-06-13days on market $269,500 Active 21 DOM
-
2026-06-10days on market $269,500 Active 19 DOM
-
2026-06-09days on market $269,500 Active 18 DOM
-
2026-06-08days on market $269,500 Active 17 DOM
-
2026-06-07days on market $269,500 Active 16 DOM
-
2026-06-05days on market $269,500 Active 13 DOM
-
2026-06-03days on market $269,500 Active 12 DOM
-
2026-06-02days on market $269,500 Active 11 DOM
-
2026-06-01days on market $269,500 Active 10 DOM
-
2026-05-31days on market $269,500 Active 9 DOM
-
2026-05-30days on market $269,500 Active 8 DOM
-
2026-05-22$269,500 Active
-
2018-12-21soldstatus
-
2002-04-29soldstatus 98-char remark
Show marketing remark (98 chars)
Great buy in one of Clinton's newest neighborhoods. Nice open plan with Fireplace. Patio and Deck.
-
2002-04-23soldstatus
-
2002-03-19$139,000 98-char remark
Show marketing remark (98 chars)
Great buy in one of Clinton's newest neighborhoods. Nice open plan with Fireplace. Patio and Deck.
-
1998-08-17soldstatus
ⓘ Source: listings_history table (triggers on properties + properties_extension) + one-shot
backfill from property_details.listing_events for pre-trigger history.
Tax reassessment forecast MS · Resets to sale price
- Current annual tax
- $2,061 · $172/mo
- Projected year-2 tax
- $2,061 · $172/mo
- Expected delta
- $0/yr ($0/mo · 0.0%)
ⓘ Screening estimate from a state-policy table — verify with the county assessor before closing.
Climate risk First Street
- Flood 1/10 Low FEMA zone X (unshaded) · 0% chance over 30 yrs
- Wildfire 3/10 Moderate
- Heat 7/10 Severe 7 d/yr ≥108°F today · 20 d/yr by 30 yrs out
- Wind 8/10 Severe 80% chance of damaging wind over 30 yrs
- Air quality 1/10 Low 0 unhealthy d/yr today · 0 by 30 yrs out
Nearby sold comps map
Loading sold comps map…
Walkable amenities ~0.75 mi
Loading nearby amenities…
Taxation est. · year 1
- Rental income
- $26,352
- − Mortgage interest
- −$14,536
- − Property taxes
- −$2,061
- − Insurance
- −$1,298
- − Repairs & maintenance
- −$2,108
- − Management
- −$2,108
- − HOA
- −$300
- − Depreciation
- −$7,549
- Taxable loss
- −$3,608
- Est. tax savings @ 24.0%
- +$866
- After-tax cash flow
- $1,695/yr
For passive investors: Depreciation is non-cash, so a rental often shows a tax loss while cash-flowing — sheltering income. Rental losses are passive: they offset passive income freely, and up to $25,000/yr can offset ordinary (W-2) income if you actively participate and your MAGI is under $100k (phasing out to $0 by $150k); unused losses carry forward. On sale, claimed depreciation is recaptured at up to 25%, and gains may owe capital-gains tax (a 1031 exchange can defer both). Figures are a year-1 estimate at your 24.0% rate — not tax advice; consult a CPA.
Schools (NCES district)
- District
- Clinton Public School District
- NCES district ID
- 2801090
- Math proficiency
- 58% ▼ -9.00%
- Reading proficiency
- 53% ▼ -7.00%
- Median HH income
- $55,993
- Composite
- 47.95/100
- National rank
- #2205
- State rank
- #4 of 130 in MS
Livability — Clinton
- Score
- 69/100
- State rank
- #49
- US rank
- #8341
Category grades
Schools grade is shown separately in the Schools card above.
Census & demographics
- Census place
- Clinton, MS
- County
- Hinds County · 167,040 people
- City population
- 26,836
- Metro
- Jackson, MS
- Population (ZIP)
- 26,836
- Household income
- $75,110
- Rent vs Own
- Severe rent burden
- 780.0
Population outlook (Hinds County) Hauer SSP2
- Today (2025)
- 242,528 people
- By 2030
- 241,113 · -0.6%
- By 2040
- 235,557 · -2.9%
- By 2050
- 226,946 · -6.4%
- By 2075
- 199,995 · -17.5%
- By 2100
- 164,165 · -32.3%
Race, ethnicity, and origin ACS 2023
- Neighborhood character
- Diverse neighborhood (Simpson 0.58)
- Race & ethnicity
- White 50% Black 40% Asian 4% Two or more races 3% Hispanic / Latino 2%
- Common ancestry
- Slovak 4% Italian 2% Serbian 1%
- Foreign-born
- 6% · Canada, Vietnam, China
- Languages at home
- 92% English-only · Other Indo-European 2% Spanish 1% Vietnamese 1%
Political lean MEDSL · Hinds
- 2024 margin
- Solid D (+46.1) · D 72.4% · R 26.3% · Other 1.4%
- 2008→2024 swing
- +7.1pp toward D · 2008: 39.0pp · 2024: 46.1pp
- All cycles
- 2024: D+46.1 2020: D+48.3 2016: D+43.7 2012: D+45.1 2008: D+39.0
Not yet ingested
- Civics
- —
Market trends
- HPI YoY
- ▼ -148.13%
- Current HPI
- 176.266
- Rent YoY
- ▼ -3.70%
- Metro
- Jackson, MS
- State GDP YoY
- —
- F500 in state
- 0
Price history
+93.9% since first listed6 events — show timeline
- 2026-05-22 Listed $269,500 MLSU
- 2018-12-21 Sold (Public Records) — Public Records
- 2002-04-29 Sold (MLS) — MLSU
- 2002-04-23 Sold (Public Records) — Public Records
- 2002-03-19 Listed $139,000 MLSU
- 1998-08-17 Sold (Public Records) — Public Records
Property tax history
+1.2%/yrLatest (2025): $2,061 · +3.9% YoY. Source: county tax records.
Cash-flow waterfall
monthlySold comps — $/sqft
last 12 mo · ≤1 miLoading sold comps…