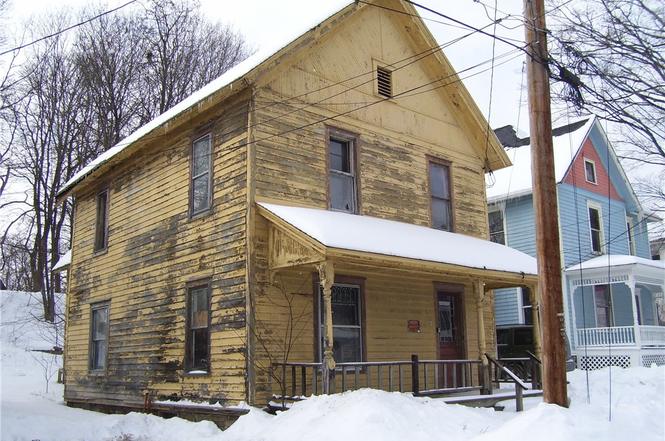
11 Taylor St · Oxford, NY
Flood risk 9/10 · Severe
- FEMA flood zone
- X (unshaded)
- Chance of flooding over 30 yrs
- 0.99%
- Est. flood insurance / yr
- $473 – $860
Fire risk 2/10 · Minimal
- Est. fire insurance / yr
- $691 – $1,283
Heat risk 3/10 · Minor
- Hot days now (above 92°F)
- 7 days/yr
- Hot days in 30 yrs
- 18 days/yr
Wind risk 2/10 · Minimal
- Chance of severe wind over 30 yrs
- 1.0%
Air-quality risk 2/10 · Minimal
- Unhealthy air days now
- 0 days/yr
- Unhealthy air days in 30 yrs
- 1 days/yr
Risk factors via First Street. Map © Google.
Why this score? — see what drove the C- grade
The composite is a weighted blend of 9 inputs, each scored 0–100. Each bar is that input's sub-score; the figure is the points it added to the 100-point composite (weight × sub-score).
- Cash flow +15.0/30.0
- Appreciation +10.0/10.0
- ARV discount +7.5/15.0
- 1% rule +5.0/10.0
- DSCR +5.0/10.0
- Schools +3.3/10.0
- Livability +3.2/5.0
- Rent growth +2.5/5.0
- Condition / age +2.5/5.0
$29,900
🖨 Deal sheet 📄 Offer letter ✓ Due diligence
Listing remarks
This is definitely a project house. Bring your tools and ideas!
Key facts
- 5,227 sq ft lot
- Parking
- Built 1883
Property features AI
Exterior
- Parking: No garage; Shared driveway
- Utilities: Public water available; Sewer connected
- Home design: 2-story frame house; Existing structure
- Construction: Frame construction; Stone foundation
- Exterior features: Rectangular residential lot; City street frontage
Interior
- Kitchen: See remarks for kitchen details
- Bedrooms: One main-level bedroom
- Flooring: Hardwood; Varies by area
- Bathrooms: One full bathroom on the main level
- Heating & cooling: Forced air heating; Heating present (see remarks)
- Interior features: Hardwood and varying flooring throughout; Partial basement
Neighborhood map
What this means for you Summary
Snapshot
- This is a 3-bed/1.0-bath single-family listed at $30k.
Deal economics
- At list price, monthly cash flow is $727 ($9k/yr) — positive.
- The deal already cash-flows at list — no discount required.
- Meets the 1% rule at list price ($1k rent vs $30k).
- Recommended offer: $26k (12.0% below list) — sets the bar for market timing.
Location & tenants
- Location reads 64/100 on livability (#766 in NY) — a middle-class / working-renter tenant base. Strengths: cost of living A+, housing A+, crime A-; Watch: health & safety D, amenities F, commute F.
- Oxford Academy And Central School District (rural): math 36% / reading 42% proficiency, ranked #533 of 590 in NY (top 90%) — families likely to look elsewhere, expect single-tenant / working-renter base with shorter leases.
- Market conditions: 26 active listings in the ZIP; 151 units permitted in Chenango County in 2024 (96 in 5+ unit buildings).
Forward outlook
- In year one you build about $3k of equity ($207 loan paydown + $3k appreciation (10.0% local appreciation)).
- Chenango County population projected at -26% by 2050 — secular population decline; favor cash flow + early exit over multi-decade hold.
- At projected returns (10.0% appreciation + 3.0% rent growth), your $8k cash investment doubles in ~1 year — after that, you're playing with house money.
- By year 9, paydown + projected appreciation supports a ~$33k cash-out refi (75% LTV) — recoverable capital for the next deal without selling this one.
Negotiation context
- It's been on market 132 days — a 12% lower offer ($26k) is reasonable based on typical stale-listing flexibility.
- 2 sale attempts since 2y ago with the ask held roughly flat each time — persistent listings suggest the price (not the market) is what's stuck; bring a comps-based counter.
- Current owner paid $17k; list at $30k implies a 76% gain — meaningful room to come down on a strong offer.
Risks & watch-outs
- Watch-outs: flood insurance adds $56/mo; built in 1883 — expect roof / HVAC / electrical / plumbing capex.
- Climate carrying-cost: severe flood risk — expect insurance premiums to compound above CPI over the hold.
Questions for the listing agent
- It's been on market 132 days. Have you received any prior offers? Is the seller open to a 12% concession, seller financing, or rate buy-down credit?
- Built in 1883 — when were the roof, HVAC, electrical panel, plumbing, and water heater last replaced?
- What's the actual annual flood-insurance premium (NFIP or private), and is the property in a SFHA with mandatory coverage?
- Why hasn't it sold? Are there any deal-killer items the seller is aware of (foundation, flood, title, zoning, code violations)?
- Is there a deadline driving the sale (1031 exchange, divorce, estate, relocation)? That informs how much negotiation room exists.
- Schools are B-rated — typically a magnet for longer-tenancy family renters. What's the average tenant stay here, and is there a school-zone premium baked into asking?
- What's the average days-on-market for RENTAL listings here right now (not sales)? A rising rental-DOM trend means longer vacancies and softer asking-rent achievability than the comps imply.
- What's the recent tenant-quality profile in this submarket — average credit score on applications, eviction rate, late-payment / NSF rate, and stable-employment percentage? A property-management company in the area should have these aggregated.
- How much new for-sale + rental construction is in the pipeline within 1–3 miles? Heavy new supply typically softens prices + rents 12–24 months out; constrained supply supports both.
Investment metrics
- 1% rule
- 4.19% ✓
- Cap rate
- 37.72%
- Cash-on-cash
- 112.23%
- DSCR
- 5.99
- GRM
- 2.0
CMA / ARV
- ARV (on-the-fly)
- $145,904
- Comps found
- 6
Show comp detail 6 sales within ~0.75 mi
| Address | Dist | Beds/Ba | Sqft | Sold | Price | $/sf | Match |
|---|---|---|---|---|---|---|---|
| 35 State St | 0.25mi | 3/2.0 | 1,596 (-4%) | 4mo | $139,900 | $88 | 74 |
| 2 Mechanic St | 0.33mi | 3/1.0 | 1,650 (-0%) | 14mo | $126,500 | $77 | 73 |
| 25 State St | 0.17mi | 3/2.0 | 1,624 (-2%) | 18mo | $55,000 | $34 | 70 |
| 42 State St | 0.37mi | 2/2.0 (-1) | 1,711 (+3%) | 12mo | $400,000 | $234 | 58 |
| 11 S Canal St | 0.20mi | 3/1.5 | 1,450 (-12%) | 12mo | $56,000 | $39 | 58 |
| 54 N Washington Ave | 0.53mi | 3/1.5 | 1,796 (+8%) | 5mo | $185,000 | $103 | 55 |
Match score weights: distance 35% · size 25% · config 20% · recency 20%. Top-matched comps best support the ARV.
Projected returns pro-forma
10.0% appreciation · 3.0% rent growth · sell at horizon
- IRR
- —
- Equity multiple
- 8.49×
- Total profit
- $62,669
- Equity at exit
- $26,936
- IRR
- —
- Equity multiple
- 18.70×
- Total profit
- $148,220
- Equity at exit
- $58,089
Cash invested: $8,372 (down + closing). Projections, not guarantees.
Landlord ↔ Tenant lean methodology
- Overall (STATE)
- 15 Strongly Tenant-Friendly
- State New York
- 15 Strongly Tenant-Friendly · D+10
- County
- — inherits STATE
- City
- — inherits STATE
ZIP-level market 13830
- Home prices YoY
- 4.4%
- Active inventory
- 26
- Price-to-rent
- 2.0×
Monthly cashflow live
- Estimated rent
- $1,253 medium interval (Pro) →
- Mortgage (P&I)
- −$157
- Tax est. 1.5%
- −$37 /mo · $448/yr
- Insurance
- −$12
- Flood insurance flood zone
- −$56 /mo · $666/yr
- HOA
- −$0
- Vacancy / Maint / Mgmt
- −$263
- Net cashflow
- $727
Break-even live
UW: 25.0% down · 7.5% · 30yr · 1.5% tax · 5.0% vac · 8.0% maint · 8.0% mgmt
Financing live
Cash to close
- Down payment
- $7,475
- Closing costs
- $897
- Reserves months
- —
- Total cash needed
- —
Loan-product check · same deal, 3 products live
Conventional
25% down · 7.5% · 30yr
- Down + closing
- —
- Monthly P&I
- —
- Monthly cashflow
- —
- DSCR
- —
- Eligible?
- —
Personal DTI + credit; lowest rate.
DSCR
20% down · 8.5% · 30yr
- Down + closing
- —
- Monthly P&I
- —
- Monthly cashflow
- —
- DSCR
- —
- Eligible?
- —
No personal income docs; deal must DSCR.
Hard money
10% down · 12.0% · 12mo
- Down + closing
- —
- Monthly P&I
- —
- Monthly cashflow
- —
- DSCR
- —
- Eligible?
- —
Short-term bridge; refi at stabilization.
Listing history 17 events
-
2026-06-18days on market $29,900 Active 132 DOM
-
2026-06-17days on market $29,900 Active 131 DOM
-
2026-06-16days on market $29,900 Active 130 DOM
-
2026-06-15days on market $29,900 Active 129 DOM
-
2026-06-13days on market $29,900 Active 127 DOM
-
2026-06-12days on market $29,900 Active 126 DOM
-
2026-06-09days on market $29,900 Active 123 DOM
-
2026-06-08days on market $29,900 Active 122 DOM
-
2026-06-07days on market $29,900 Active 121 DOM
-
2026-06-07days on market $29,900 Active 120 DOM
-
2026-06-04days on market $29,900 Active 117 DOM
-
2026-06-02days on market $29,900 Active 116 DOM
-
2026-06-01days on market $29,900 Active 115 DOM
-
2026-05-31days on market $29,900 Active 114 DOM
-
2026-02-05$29,900 Active
-
2024-03-13$19,999 Active
-
2005-09-30soldstatus $17,000
ⓘ Source: listings_history table (triggers on properties + properties_extension) + one-shot
backfill from property_details.listing_events for pre-trigger history.
Climate risk First Street
- Flood 9/10 Extreme FEMA zone X (unshaded) · 99% chance over 30 yrs
- Wildfire 2/10 Low
- Heat 3/10 Moderate 7 d/yr ≥92°F today · 18 d/yr by 30 yrs out
- Wind 2/10 Low 100% chance of damaging wind over 30 yrs
- Air quality 2/10 Low 0 unhealthy d/yr today · 1 by 30 yrs out
Nearby sold comps map
Loading sold comps map…
Walkable amenities ~0.75 mi
Loading nearby amenities…
Taxation est. · year 1
- Rental income
- $15,032
- − Mortgage interest
- −$1,675
- − Property taxes
- −$448
- − Insurance
- −$816
- − Repairs & maintenance
- −$1,203
- − Management
- −$1,203
- − Depreciation
- −$870
- Taxable income
- $8,818
- Est. tax owed @ 24.0%
- −$2,116
- After-tax cash flow
- $6,613/yr
For passive investors: Depreciation is non-cash, so a rental often shows a tax loss while cash-flowing — sheltering income. Rental losses are passive: they offset passive income freely, and up to $25,000/yr can offset ordinary (W-2) income if you actively participate and your MAGI is under $100k (phasing out to $0 by $150k); unused losses carry forward. On sale, claimed depreciation is recaptured at up to 25%, and gains may owe capital-gains tax (a 1031 exchange can defer both). Figures are a year-1 estimate at your 24.0% rate — not tax advice; consult a CPA.
Schools (NCES district)
- District
- Oxford Academy And Central School District
- NCES district ID
- 3622260
- Math proficiency
- 36% ▼ -13.00%
- Reading proficiency
- 42% ▬ 0.00%
- Median HH income
- $45,916
- Composite
- 33.26/100
- National rank
- #5513
- State rank
- #533 of 590 in NY
Livability — Oxford
- Score
- 64/100
- State rank
- #766
- US rank
- #14698
Category grades
Schools grade is shown separately in the Schools card above.
Census & demographics
- Census place
- Oxford, NY
- Population (ZIP)
- 4,826
Population outlook (Chenango County) Hauer SSP2
- Today (2025)
- 45,669 people
- By 2030
- 43,484 · -4.8%
- By 2040
- 38,774 · -15.1%
- By 2050
- 34,000 · -25.6%
- By 2075
- 24,637 · -46.1%
- By 2100
- 16,452 · -64.0%
Race, ethnicity, and origin ACS 2023
- Neighborhood character
- Predominantly White (95%)
- Race & ethnicity
- White 95% Two or more races 2% Hispanic / Latino 2%
- Common ancestry
- Italian 5% Romanian 4% Iranian 2%
- Foreign-born
- 2% · Canada
- Languages at home
- 98% English-only · Spanish 1%
Political lean MEDSL · Chenango
- 2024 margin
- Strong R (+27.2) · D 36.4% · R 63.6%
- 2008→2024 swing
- -26.1pp toward R · 2008: -1.1pp · 2024: -27.2pp
- All cycles
- 2024: R+27.2 2020: R+23.3 2016: R+28.1 2012: R+3.4 2008: R+1.1
Not yet ingested
- Civics
- —
Market trends
- HPI YoY
- ▲ 13.35%
- Current HPI
- 318.8185
- Rent YoY
- —
- Metro
- —
- State GDP YoY
- ▲ 2.60%
- F500 in state
- 92
Industry mix (Fortune 500 HQ in NY)
| Industry | F500 HQs | Revenue |
|---|---|---|
| Financial Services | 10 | $950B |
|
||
| Consumer Goods | 9 | $162B |
|
||
| Insurance | 4 | $225B |
|
||
| Telecommunications | 2 | $144B |
|
||
| Pharmaceuticals | 2 | $112B |
|
||
| Media / Entertainment | 2 | $69B |
|
||
Price history
+75.9% since first listed3 events — show timeline
- 2026-02-05 Listed $29,900 UNYREIS
- 2024-03-13 Listed $19,999 GBAOR
- 2005-09-30 Sold (Public Records) $17,000 Public Records
Property tax history
+2.4%/yrLatest (2025): $2,122 · +5.9% YoY. Source: county tax records.
Cash-flow waterfall
monthlySold comps — $/sqft
last 12 mo · ≤1 miLoading sold comps…