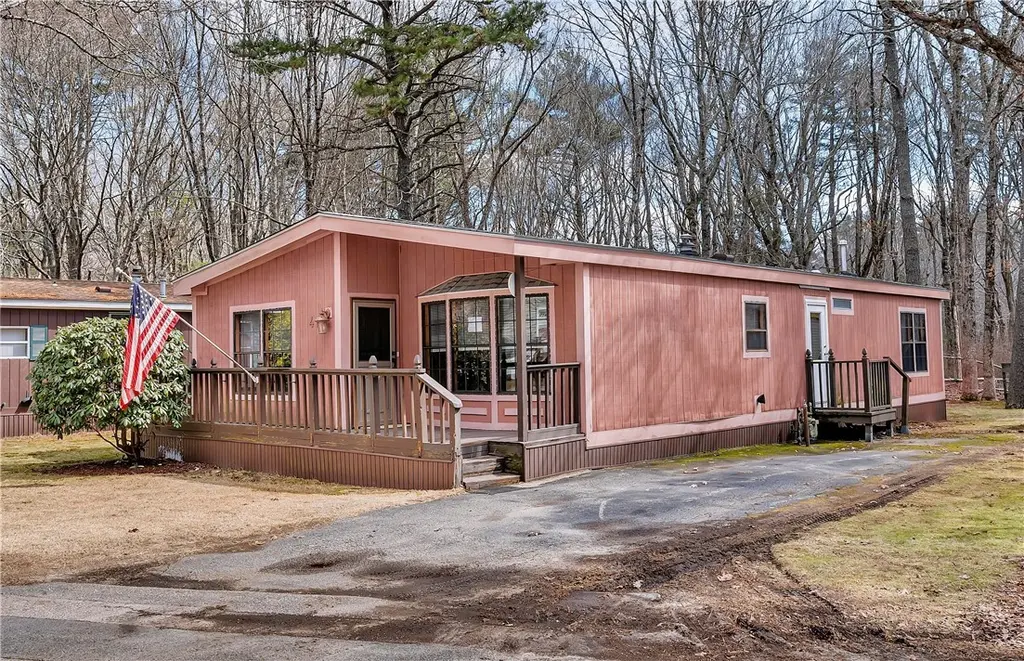
41 Leisure Way · Cranston, RI
Flood risk 1/10 · Minimal
- FEMA flood zone
- X (unshaded)
- Chance of flooding over 30 yrs
- 0.0%
- Est. flood insurance / yr
- $507 – $1,088
Fire risk 3/10 · Minor
- Est. fire insurance / yr
- $835 – $1,551
Heat risk 4/10 · Minor
- Hot days now (above 95°F)
- 7 days/yr
- Hot days in 30 yrs
- 16 days/yr
Wind risk 8/10 · Major
- Chance of severe wind over 30 yrs
- 80.0%
Air-quality risk 2/10 · Minimal
- Unhealthy air days now
- 2 days/yr
- Unhealthy air days in 30 yrs
- 2 days/yr
Risk factors via First Street. Map © Google.
Why this score? — see what drove the D grade
The composite is a weighted blend of 9 inputs, each scored 0–100. Each bar is that input's sub-score; the figure is the points it added to the 100-point composite (weight × sub-score).
- Cash flow +12.3/30.0
- 1% rule +8.4/10.0
- ARV discount +7.5/15.0
- Livability +4.4/5.0
- DSCR +3.6/10.0
- Schools +3.0/10.0
- Rent growth +2.5/5.0
- Condition / age +2.5/5.0
- Appreciation +0.0/10.0
$160,000
🖨 Deal sheet (PDF) 📄 Offer letter ✓ Due diligence
Listing remarks
Room to grow in this Double Wide mobile home with big rooms and an open floor plan located in the over 55 community of Leisure Village. Step in to the expansive vaulted ceilinged Great Room (Living, Dining and Kitchen) with new laminent flooring, breakfast bar and fully applianced kitchen with abundant cabinets and counter space. Walk down the hallway, past your laundry room to the oversized primary bedroom suite offering a large 11 foot Walkin closet and through double doors to the spacious primary bath with sunken jetted tub and double vanities. The second large bedroom also offers a full Walkin closet next door to the main bath with tub and shower. Newly striped and reshingled roof (last
Key facts
- Open floor plan
- Abundant cabinets
- Large walkin closet
Tags
Property features AI
Finance
- Financial info: Has land lease
- HOA & community: Monthly association fee of $631; Senior community
Exterior
- Parking: No garage; Space for 2 vehicles
- Utilities: Public water; Public sewer; Electric with circuit breakers
- Home design: Single-story home; Wood siding construction
- Construction: Wood siding
- Exterior features: Porch
Interior
- Kitchen: Kitchen with island, breakfast bar, and vaulted ceiling
- Bedrooms: Two bedrooms with ceiling fans and walk-in closets (both on the first floor)
- Flooring: Carpet; Laminate
- Bathrooms: Two full bathrooms; Main bath with double vanity and soaking tub (first floor)
- Heating & cooling: Forced air gas heating; Central air conditioning
- Interior features: Storm windows; Storm doors; Tub/shower
- Laundry & utility: First-floor laundry room with storage; Water heater
Neighborhood map
What this means for you Summary
Snapshot
- This is a 2-bed/2.0-bath manufactured listed at $160k.
Deal economics
- At list price, monthly cash flow is $-30 ($-358/yr) — negative.
- To cash-flow at today's rent, offer at most $155k (3.3% below list).
- Meets the 1% rule at list price ($2k rent vs $160k).
- Recommended offer: $155k (3.3% below list) — sets the bar for cash-flow.
- Cap rate 6.1% vs local median 3.2% in Cranston — top-decile yield for the area; either an underpriced asset or a hidden risk that comps aren't pricing in. Stress-test before assuming the spread holds.
Location & tenants
- Location reads 87/100 on livability (#1 in RI, #323 nationally) — a professional / high-income tenant draw. Strengths: crime A+, employment A+, housing A+.
- Coventry (suburban): math 25% / reading 41% proficiency, ranked #19 of 39 in RI (top 49%) — families likely to look elsewhere, expect single-tenant / working-renter base with shorter leases.
- Zoned schools: Alan Shawn Feinstein Ms of Cov (math 18% / reading 31%, grade F, #28 of 57 statewide, top 48%, 974 students, 29% FRL).
- Market conditions: 177 active listings in the ZIP; solid renter incomes; 471 units permitted in Kent County in 2024 (240 in 5+ unit buildings).
Forward outlook
- Local home prices are declining (-3.0%/yr); year-one equity from $1k of loan paydown is wiped out by about $5k of value loss. Plan a longer hold.
- Kent County population projected at -14% by 2050 — secular population decline; favor cash flow + early exit over multi-decade hold.
Negotiation context
- It's been on market 46 days — a 3% lower offer ($155k) is reasonable based on typical stale-listing flexibility.
- 2 sale attempts with the ask held roughly flat each time — persistent listings suggest the price (not the market) is what's stuck; bring a comps-based counter.
Risks & watch-outs
- Watch-outs: HOA is 30% of rent.
- Climate carrying-cost: severe wind risk, 80% chance of damaging wind over 30y — expect insurance premiums to compound above CPI over the hold.
Questions for the listing agent
- What do current leases actually rent for vs. the listed asking? Can we see a recent rent roll and the last 12 months of T-12 income?
- It's been on market 46 days. Have you received any prior offers? Is the seller open to a 3% concession, seller financing, or rate buy-down credit?
- What does the HOA fee cover, when was the last increase, and are there any pending special assessments or reserve-fund shortfalls?
- Is there a deadline driving the sale (1031 exchange, divorce, estate, relocation)? That informs how much negotiation room exists.
- The area grade is low — what's the realistic commute time and amenity access for the typical tenant pool here? Any planned neighborhood developments (good or bad) we should know about?
- What's the average days-on-market for RENTAL listings here right now (not sales)? A rising rental-DOM trend means longer vacancies and softer asking-rent achievability than the comps imply.
- What's the recent tenant-quality profile in this submarket — average credit score on applications, eviction rate, late-payment / NSF rate, and stable-employment percentage? A property-management company in the area should have these aggregated.
- How much new for-sale + rental construction is in the pipeline within 1–3 miles? Heavy new supply typically softens prices + rents 12–24 months out; constrained supply supports both.
Investment metrics
- 1% rule
- 1.34% ✓
- Cap rate
- 6.07%
- Cash-on-cash
- -0.80%
- DSCR
- 0.96
- GRM
- 6.2
CMA / ARV
No comps found within radius.
Projected returns pro-forma
-3.0% appreciation · 3.0% rent growth · sell at horizon
- IRR
- -17.3%
- Equity multiple
- 0.39×
- Total profit
- $-27,417
- Equity at exit
- $23,857
- IRR
- -8.7%
- Equity multiple
- 0.45×
- Total profit
- $-24,659
- Equity at exit
- $13,834
Cash invested: $44,800 (down + closing). Projections, not guarantees.
Landlord ↔ Tenant lean methodology
- Overall (STATE)
- 31 Tenant-Leaning
- State Rhode Island
- 31 Tenant-Leaning · D+8
- County
- — inherits STATE
- City
- — inherits STATE
ZIP-level market 02816
- Active inventory
- 177
- Price-to-rent
- 6.2×
Monthly cashflow live
- Estimated rent
- $2,137 medium interval (Pro) →
- Mortgage (P&I)
- −$839
- Tax from tax record
- −$182 /mo · $2,180/yr
- Insurance
- −$67
- HOA
- −$631
- Vacancy / Maint / Mgmt
- −$449
- Net cashflow
- $-30
Break-even live
Sensitivity live
| Price | -10% $61 | -5% $15 | +0% $-30 | +5% $-75 | +10% $-120 |
|---|---|---|---|---|---|
| Rent | -10% $-199 | -5% $-114 | +0% $-30 | +5% $55 | +10% $139 |
| Rate | -1.0pp $51 | -0.5pp $11 | base $-30 | +0.5pp $-71 | +1.0pp $-113 |
UW: 25.0% down · 7.5% · 30yr · 1.5% tax · 5.0% vac · 8.0% maint · 8.0% mgmt
Financing live
Cash to close
- Down payment
- $40,000
- Closing costs
- $4,800
- Reserves months
- —
- Total cash needed
- —
Loan-product check · same deal, 3 products live
Conventional
25% down · 7.5% · 30yr
- Down + closing
- —
- Monthly P&I
- —
- Monthly cashflow
- —
- DSCR
- —
- Eligible?
- —
Personal DTI + credit; lowest rate.
DSCR
20% down · 8.5% · 30yr
- Down + closing
- —
- Monthly P&I
- —
- Monthly cashflow
- —
- DSCR
- —
- Eligible?
- —
No personal income docs; deal must DSCR.
Hard money
10% down · 12.0% · 12mo
- Down + closing
- —
- Monthly P&I
- —
- Monthly cashflow
- —
- DSCR
- —
- Eligible?
- —
Short-term bridge; refi at stabilization.
HOA detail
- Monthly dues
- $631 · $7,572/yr
Listing history 15 events
-
2026-06-15status $160,000 Pending 46 DOM
-
2026-06-15days on market $160,000 Active 46 DOM
-
2026-06-13days on market $160,000 Active 44 DOM
-
2026-06-13days on market $160,000 Active 43 DOM
-
2026-06-09days on market $160,000 Active 40 DOM
-
2026-06-08days on market $160,000 Active 39 DOM
-
2026-06-07days on market $160,000 Active 38 DOM
-
2026-06-03days on market $160,000 Active 34 DOM
-
2026-06-02days on market $160,000 Active 33 DOM
-
2026-06-01days on market $160,000 Active 32 DOM
-
2026-05-31days on market $160,000 Active 31 DOM
-
2026-04-30historical
-
2026-04-30$160,000 Active
-
2026-04-14price $170,000
-
2026-03-07$180,000 Active
ⓘ Source: listings_history table (triggers on properties + properties_extension) + one-shot
backfill from property_details.listing_events for pre-trigger history.
Tax reassessment forecast RI · Partial reset (capped growth)
- Current annual tax
- $2,180 · $182/mo
- Projected year-2 tax
- $2,394 · $200/mo
- Expected delta
- +$214/yr (+$18/mo · 9.8%)
ⓘ Screening estimate from a state-policy table — verify with the county assessor before closing.
Climate risk First Street
- Flood 1/10 Low FEMA zone X (unshaded) · 0% chance over 30 yrs
- Wildfire 3/10 Moderate
- Heat 4/10 Moderate 7 d/yr ≥95°F today · 16 d/yr by 30 yrs out
- Wind 8/10 Severe 80% chance of damaging wind over 30 yrs
- Air quality 2/10 Low 2 unhealthy d/yr today · 2 by 30 yrs out
Nearby sold comps map
Loading sold comps map…
Walkable amenities ~0.75 mi
Loading nearby amenities…
Taxation est. · year 1
- Rental income
- $25,649
- − Mortgage interest
- −$8,962
- − Property taxes
- −$2,180
- − Insurance
- −$800
- − Repairs & maintenance
- −$2,052
- − Management
- −$2,052
- − HOA
- −$7,572
- − Depreciation
- −$4,655
- Taxable loss
- −$2,624
- Est. tax savings @ 24.0%
- +$630
- After-tax cash flow
- $272/yr
For passive investors: Depreciation is non-cash, so a rental often shows a tax loss while cash-flowing — sheltering income. Rental losses are passive: they offset passive income freely, and up to $25,000/yr can offset ordinary (W-2) income if you actively participate and your MAGI is under $100k (phasing out to $0 by $150k); unused losses carry forward. On sale, claimed depreciation is recaptured at up to 25%, and gains may owe capital-gains tax (a 1031 exchange can defer both). Figures are a year-1 estimate at your 24.0% rate — not tax advice; consult a CPA.
Schools (NCES district)
- District
- Coventry
- NCES district ID
- 4400210
- Math proficiency
- 25% ▼ -10.00%
- Reading proficiency
- 41% ▼ -10.00%
- Median HH income
- $66,277
- Composite
- 30.18/100
- National rank
- #6317
- State rank
- #19 of 39 in RI
Livability — Cranston
- Score
- 87/100
- State rank
- #1
- US rank
- #323
Category grades
Schools grade is shown separately in the Schools card above.
Census & demographics
- County
- Kent County · 90,904 people
- City population
- 72,803
- Metro
- Providence-Warwick, RI-MA
- Population (ZIP)
- 33,298
- Household income
- $101,431
- Rent vs Own
- Severe rent burden
- 667.0
Population outlook (Kent County) Hauer SSP2
- Today (2025)
- 160,994 people
- By 2030
- 157,428 · -2.2%
- By 2040
- 148,389 · -7.8%
- By 2050
- 137,995 · -14.3%
- By 2075
- 118,536 · -26.4%
- By 2100
- 102,266 · -36.5%
Race, ethnicity, and origin ACS 2023
- Neighborhood character
- Predominantly White (90%)
- Race & ethnicity
- White 90% Two or more races 6% Hispanic / Latino 5% Asian 1%
- Common ancestry
- Lithuanian 13% Russian 8% Romanian 4%
- Foreign-born
- 3% · Canada, China
- Languages at home
- 94% English-only · Spanish 3% Other Indo-European 1% French/Haitian/Cajun 1%
Political lean MEDSL · Kent
- 2024 margin
- Toss-up / Even · D 49.9% · R 48.1% · Other 2.0%
- 2008→2024 swing
- -15.6pp toward R · 2008: 17.5pp · 2024: 1.9pp
- All cycles
- 2024: D+1.9 2020: D+7.6 2016: R+0.7 2012: D+18.4 2008: D+17.5
Not yet ingested
- Civics
- —
Market trends
- HPI YoY
- ▼ -362.74%
- Current HPI
- 336.2662
- Rent YoY
- —
- Metro
- Providence-Warwick, RI-MA
- State GDP YoY
- ▲ 2.25%
- F500 in state
- 10
Industry mix (Fortune 500 HQ in RI)
| Industry | F500 HQs | Revenue |
|---|---|---|
| Healthcare | 1 | $373B |
|
||
| Food Distribution | 1 | $31B |
|
||
| Aerospace / Defense | 1 | $14B |
|
||
| Financial Services | 1 | $8B |
|
||
| Consumer Goods | 1 | $4B |
|
||
Price history
-11.1% since first listed4 events — show timeline
- 2026-04-30 Listed $160,000 RIS
- 2026-04-30 Listing Removed — RIS
- 2026-04-14 Price Changed $170,000 RIS
- 2026-03-07 Listed $180,000 RIS
Property tax history
+6.2%/yrLatest (2025): $2,180 · +1.6% YoY. Source: county tax records.
Cash-flow waterfall
monthlySold comps — $/sqft
last 12 mo · ≤1 miLoading sold comps…