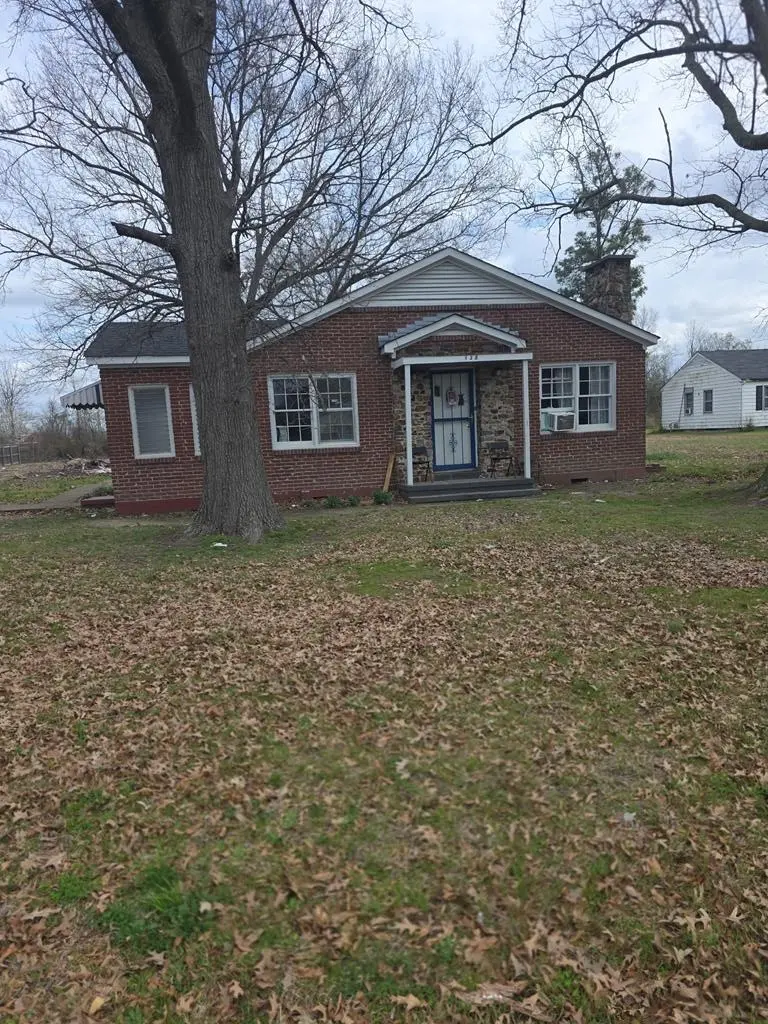
334 S 21st St · West Memphis, AR
Flood risk No data
- FEMA flood zone
- —
- Chance of flooding over 30 yrs
- —
- Est. flood insurance / yr
- —
Fire risk No data
- Est. fire insurance / yr
- —
Heat risk No data
- Hot days now (above threshold)
- —
- Hot days in 30 yrs
- —
Wind risk No data
- Chance of severe wind over 30 yrs
- —
Air-quality risk No data
- Unhealthy air days now
- —
- Unhealthy air days in 30 yrs
- —
Risk factors via First Street. Map © Google.
Why this score? — see what drove the B- grade
The composite is a weighted blend of 9 inputs, each scored 0–100. Each bar is that input's sub-score; the figure is the points it added to the 100-point composite (weight × sub-score).
- Cash flow +30.0/30.0
- DSCR +10.0/10.0
- 1% rule +8.8/10.0
- ARV discount +7.3/15.0
- Livability +2.8/5.0
- Rent growth +2.5/5.0
- Condition / age +2.5/5.0
- Schools +1.2/10.0
- Appreciation +0.0/10.0
$108,000
🖨 Deal sheet 📄 Offer letter ✓ Due diligence
Listing remarks MLS
Wow, 4 bedroom 1.5 bath home. new roof 2024; lot 200' deep, new flooring, kitchen cabinets and countertops, interior paint throughout. Located 5-8 minute transit to downtown Memphis. Do not hesitate to check this home out
Key facts
- New flooring
- Interior paint
- Kitchen cabinets
Tags
Neighborhood map
What this means for you Summary
Snapshot
- This is a 4-bed/1.0-bath single-family listed at $108k.
Deal economics
- At list price, monthly cash flow is $502 ($6k/yr) — positive.
- The deal already cash-flows at list — no discount required.
- Meets the 1% rule at list price ($1k rent vs $108k).
- Recommended offer: $102k (6.0% below list) — sets the bar for market timing.
- Cap rate 11.9% vs local median 7.0% in West Memphis — top-decile yield for the area; either an underpriced asset or a hidden risk that comps aren't pricing in. Stress-test before assuming the spread holds.
Location & tenants
- Location reads 55/100 on livability (#413 in AR) — a working-class tenant base; expect higher turnover. Strengths: cost of living A+, housing A; Watch: schools D-, crime F, amenities F.
- West Memphis School District (suburban): math 16% / reading 15% proficiency, ranked #224 of 238 in AR (top 94%) — low school quality limits family demand, transient renter base, plan for 1-2y turnover; 96% free/reduced lunch — lower-income household profile, screen leases tightly.
- Market conditions: 133 active listings in the ZIP; 9 comparable units currently listed for rent nearby; rentals leasing fast (median 11d on market — plan ~1-2 weeks tenant-placement turnaround); 69 units permitted in Crittenden County in 2024 (0 in 5+ unit buildings).
Forward outlook
- Local home prices are declining (-3.0%/yr); year-one equity from $747 of loan paydown is wiped out by about $3k of value loss. Plan a longer hold.
- Crittenden County population projected at -26% by 2050 — secular population decline; favor cash flow + early exit over multi-decade hold.
- At projected returns (-3.0% appreciation + 3.0% rent growth), your $30k cash investment doubles in ~7 years — after that, you're playing with house money.
Negotiation context
- It's been on market 82 days — a 6% lower offer ($102k) is reasonable based on typical stale-listing flexibility.
- 5 sale attempts since 2y ago with the ask held roughly flat each time — persistent listings suggest the price (not the market) is what's stuck; bring a comps-based counter.
- Current owner paid $18k; list at $108k implies a 500% gain — meaningful room to come down on a strong offer.
Questions for the listing agent
- It's been on market 82 days. Have you received any prior offers? Is the seller open to a 6% concession, seller financing, or rate buy-down credit?
- Why hasn't it sold? Are there any deal-killer items the seller is aware of (foundation, flood, title, zoning, code violations)?
- Is there a deadline driving the sale (1031 exchange, divorce, estate, relocation)? That informs how much negotiation room exists.
- Schools are D-rated, which usually means shorter tenancies and higher turnover. Who's the typical renter profile here, and what's been the actual vacancy rate?
- Crime grade is F in this area — have there been break-ins, vandalism, or insurance claims at this property in the last 3 years? What carrier currently insures it and at what premium?
- What's the average days-on-market for RENTAL listings here right now (not sales)? A rising rental-DOM trend means longer vacancies and softer asking-rent achievability than the comps imply.
- What's the recent tenant-quality profile in this submarket — average credit score on applications, eviction rate, late-payment / NSF rate, and stable-employment percentage? A property-management company in the area should have these aggregated.
- How much new for-sale + rental construction is in the pipeline within 1–3 miles? Heavy new supply typically softens prices + rents 12–24 months out; constrained supply supports both.
Investment metrics
- 1% rule
- 1.38% ✓
- Cap rate
- 11.87%
- Cash-on-cash
- 19.91%
- DSCR
- 1.89
- GRM
- 6.0
CMA / ARV
- ARV (median comp)
- $107,521
- List price
- $108,000
- Delta
- 0.45%
- Verdict
- FAIR
- Comps
- 20 within 1.0 mi
Show comp detail 6 sales within ~0.75 mi
| Address | Dist | Beds/Ba | Sqft | Sold | Price | $/sf | Match |
|---|---|---|---|---|---|---|---|
| 629 S 13th St | 0.63mi | 3/2.0 (-1) | 1,720 (+7%) | 1mo | $189,900 | $110 | 49 |
| 627 S 13th St | 0.62mi | 3/2.0 (-1) | 1,580 (-2%) | 16mo | $184,900 | $117 | 46 |
| 506 Garden Ln | 0.68mi | 3/2.0 (-1) | 1,587 (-1%) | 22mo | $169,900 | $107 | 39 |
| 308 S 12th St | 0.60mi | 3/2.0 (-1) | 1,537 (-4%) | 23mo | $179,000 | $116 | 37 |
| 1933 S Mcauley Dr | 0.54mi | 3/2.0 (-1) | 1,724 (+7%) | 24mo | $127,900 | $74 | 34 |
| 801 14th St | 0.63mi | 3/2.0 (-1) | 1,400 (-13%) | 22mo | $142,500 | $102 | 22 |
Match score weights: distance 35% · size 25% · config 20% · recency 20%. Top-matched comps best support the ARV.
Projected returns pro-forma
-3.0% appreciation · 3.0% rent growth · sell at horizon
- IRR
- 12.0%
- Equity multiple
- 1.48×
- Total profit
- $14,432
- Equity at exit
- $16,103
- IRR
- 21.0%
- Equity multiple
- 2.77×
- Total profit
- $53,626
- Equity at exit
- $9,338
Cash invested: $30,240 (down + closing). Projections, not guarantees.
Landlord ↔ Tenant lean methodology
- Overall (STATE)
- 92 Strongly Landlord-Friendly
- State Arkansas
- 92 Strongly Landlord-Friendly · R+14
- County
- — inherits STATE
- City
- — inherits STATE
ZIP-level market 72301
- Active inventory
- 133
- Price-to-rent
- 6.0×
Monthly cashflow live
- Estimated rent
- $1,490 high interval (Pro) →
- Mortgage (P&I)
- −$566
- Tax from tax record
- −$64 /mo · $765/yr
- Insurance
- −$45
- HOA
- −$0
- Vacancy / Maint / Mgmt
- −$313
- Net cashflow
- $502
Break-even live
UW: 25.0% down · 7.5% · 30yr · 1.5% tax · 5.0% vac · 8.0% maint · 8.0% mgmt
Financing live
Cash to close
- Down payment
- $27,000
- Closing costs
- $3,240
- Reserves months
- —
- Total cash needed
- —
Loan-product check · same deal, 3 products live
Conventional
25% down · 7.5% · 30yr
- Down + closing
- —
- Monthly P&I
- —
- Monthly cashflow
- —
- DSCR
- —
- Eligible?
- —
Personal DTI + credit; lowest rate.
DSCR
20% down · 8.5% · 30yr
- Down + closing
- —
- Monthly P&I
- —
- Monthly cashflow
- —
- DSCR
- —
- Eligible?
- —
No personal income docs; deal must DSCR.
Hard money
10% down · 12.0% · 12mo
- Down + closing
- —
- Monthly P&I
- —
- Monthly cashflow
- —
- DSCR
- —
- Eligible?
- —
Short-term bridge; refi at stabilization.
Rent comps 9 comps
| Address | Beds | Baths | Sqft | Rent | $/sqft | DOM | Units | Dist |
|---|---|---|---|---|---|---|---|---|
| 2501 E Tyler Ave West Memphis, AR | 3.0 | 2.0 | 1220 | $1,500 | $1.23 | 43d | 1 | 0.29mi |
| 2502 E Tyler Ave West Memphis, AR | 3.0 | 2.0 | 1250 | $1,550 | $1.24 | 43d | 1 | 0.30mi |
| 2506 E Tyler Ave West Memphis, AR | 3.0 | 2.0 | 1250 | $1,450 | $1.16 | 16d | 1 | 0.31mi |
| 2504 Tyler Cir West Memphis, AR | 3.0 | 2.0 | 1250 | $1,450 | $1.16 | 1d | 1 | 0.32mi |
| 309 Westree St West Memphis, AR | 3.0 | 2.0 | 1220 | $1,550 | $1.27 | 1d | 1 | 0.33mi |
| 307 Westree St West Memphis, AR | 3.0 | 2.0 | 1220 | $1,550 | $1.27 | 10d | 1 | 0.33mi |
| 316 Chestnut St West Memphis, AR | 3.0 | 2.0 | 1250 | $1,450 | $1.16 | 43d | 1 | 0.43mi |
| 310 Chestnut St West Memphis, AR | 3.0 | 2.0 | 1250 | $1,350 | $1.08 | 1d | 1 | 0.44mi |
| 1398 E Barton Ave West Memphis, AR | 3.0 | 2.0 | 1250 | $1,550 | $1.24 | 10d | 1 | 0.96mi |
Listing history 16 events
-
2026-06-03days on market $108,000 Active 82 DOM
-
2026-06-02days on market $108,000 Active 81 DOM
-
2026-06-01days on market $108,000 Active 80 DOM
-
2026-05-31days on market $108,000 Active 79 DOM
-
2026-03-13$108,000 Active 221-char remark
Show marketing remark (221 chars)
Wow, 4 bedroom 1.5 bath home. new roof 2024; lot 200' deep, new flooring, kitchen cabinets and countertops, interior paint throughout. Located 5-8 minute transit to downtown Memphis. Do not hesitate to check this home out
-
2025-10-16$108,000 Active
-
2025-04-22$115,000 Active
-
2024-12-16soldstatus $18,000 Closed
-
2024-12-03status Pending
-
2024-10-31status Active
-
2024-10-31price $29,900
-
2024-10-04price $33,900
-
2024-09-10price $37,500
-
2024-08-15price $39,900
-
2024-07-29price $45,000
-
2024-07-01$49,900 Active
ⓘ Source: listings_history table (triggers on properties + properties_extension) + one-shot
backfill from property_details.listing_events for pre-trigger history.
Tax reassessment forecast AR · Resets to sale price
- Current annual tax
- $765 · $64/mo
- Projected year-2 tax
- $765 · $64/mo
- Expected delta
- $0/yr ($0/mo · 0.0%)
ⓘ Screening estimate from a state-policy table — verify with the county assessor before closing.
Nearby sold comps map
Loading sold comps map…
Walkable amenities ~0.75 mi
Loading nearby amenities…
Taxation est. · year 1
- Rental income
- $17,876
- − Mortgage interest
- −$6,050
- − Property taxes
- −$765
- − Insurance
- −$540
- − Repairs & maintenance
- −$1,430
- − Management
- −$1,430
- − Depreciation
- −$3,142
- Taxable income
- $4,519
- Est. tax owed @ 24.0%
- −$1,085
- After-tax cash flow
- $4,936/yr
For passive investors: Depreciation is non-cash, so a rental often shows a tax loss while cash-flowing — sheltering income. Rental losses are passive: they offset passive income freely, and up to $25,000/yr can offset ordinary (W-2) income if you actively participate and your MAGI is under $100k (phasing out to $0 by $150k); unused losses carry forward. On sale, claimed depreciation is recaptured at up to 25%, and gains may owe capital-gains tax (a 1031 exchange can defer both). Figures are a year-1 estimate at your 24.0% rate — not tax advice; consult a CPA.
Schools (NCES district)
- District
- West Memphis School District
- NCES district ID
- 0508040
- Math proficiency
- 16% ▼ -14.00%
- Reading proficiency
- 15% ▼ -14.00%
- Median HH income
- $29,382
- Composite
- 12.22/100
- National rank
- #9647
- State rank
- #224 of 238 in AR
Livability — West Memphis
- Score
- 55/100
- State rank
- #413
- US rank
- #23638
Category grades
Schools grade is shown separately in the Schools card above.
Census & demographics
- Census place
- West Memphis, AR
- City population
- 24,182
- Population (ZIP)
- 24,182
Population outlook (Crittenden County) Hauer SSP2
- Today (2025)
- 45,254 people
- By 2030
- 42,953 · -5.1%
- By 2040
- 38,235 · -15.5%
- By 2050
- 33,670 · -25.6%
- By 2075
- 24,315 · -46.3%
- By 2100
- 17,173 · -62.1%
Race, ethnicity, and origin ACS 2023
- Neighborhood character
- Majority Black (64%)
- Race & ethnicity
- Black 64% White 29% Two or more races 6% Hispanic / Latino 2%
- Common ancestry
- Serbian 1%
- Foreign-born
- 1% · Canada
- Languages at home
- 98% English-only · Spanish 1%
Political lean MEDSL · Crittenden
- 2024 margin
- Toss-up / Even · D 50.1% · R 47.9% · Other 2.0%
- 2008→2024 swing
- -12.4pp toward R · 2008: 14.7pp · 2024: 2.3pp
- All cycles
- 2024: D+2.3 2020: D+7.2 2016: D+9.0 2012: D+18.7 2008: D+14.7
Not yet ingested
- Civics
- —
Market trends
- HPI YoY
- ▼ -143.63%
- Current HPI
- 182.7665
- Rent YoY
- —
- Metro
- —
- State GDP YoY
- ▲ 3.80%
- F500 in state
- 10
Industry mix (Fortune 500 HQ in AR)
| Industry | F500 HQs | Revenue |
|---|---|---|
| Retail | 1 | $681B |
|
||
| Food / Agriculture | 1 | $53B |
|
||
| Retail / Energy | 1 | $22B |
|
||
| Transportation / Logistics | 1 | $12B |
|
||
| Energy | 1 | $4B |
|
||
Price history
+116.4% since first listed12 events — show timeline
- 2026-03-13 Listed $108,000 EARA
- 2025-10-16 Listed $108,000 EARA
- 2025-04-22 Listed $115,000 EARA
- 2024-12-16 Sold (MLS) $18,000 EARA
- 2024-12-03 Pending — EARA
- 2024-10-31 Relisted — EARA
- 2024-10-31 Price Changed $29,900 EARA
- 2024-10-04 Price Changed $33,900 EARA
- 2024-09-10 Price Changed $37,500 EARA
- 2024-08-15 Price Changed $39,900 EARA
- 2024-07-29 Price Changed $45,000 EARA
- 2024-07-01 Listed $49,900 EARA
Property tax history
+31.4%/yrLatest (2025): $765 · +115.5% YoY. Source: county tax records.
Cash-flow waterfall
monthlySold comps — $/sqft
last 12 mo · ≤1 miLoading sold comps…