8 Anna Dr · Eldred, NY
Flood risk 1/10 · Minimal
- FEMA flood zone
- X (unshaded)
- Chance of flooding over 30 yrs
- 0.0%
- Est. flood insurance / yr
- $507 – $1,088
Fire risk 4/10 · Minor
- Est. fire insurance / yr
- $691 – $1,283
Heat risk 2/10 · Minimal
- Hot days now (above 94°F)
- 6 days/yr
- Hot days in 30 yrs
- 13 days/yr
Wind risk 3/10 · Minor
- Chance of severe wind over 30 yrs
- 5.0%
Air-quality risk 2/10 · Minimal
- Unhealthy air days now
- 1 days/yr
- Unhealthy air days in 30 yrs
- 1 days/yr
Risk factors via First Street. Map © Google.
Why this score? — see what drove the C grade
The composite is a weighted blend of 9 inputs, each scored 0–100. Each bar is that input's sub-score; the figure is the points it added to the 100-point composite (weight × sub-score).
- Cash flow +17.1/30.0
- Appreciation +10.0/10.0
- ARV discount +7.5/15.0
- DSCR +5.3/10.0
- 1% rule +4.9/10.0
- Schools +3.6/10.0
- Rent growth +2.5/5.0
- Livability +2.5/5.0
- Condition / age +2.5/5.0
$149,000
🖨 Deal sheet 📄 Offer letter ✓ Due diligence
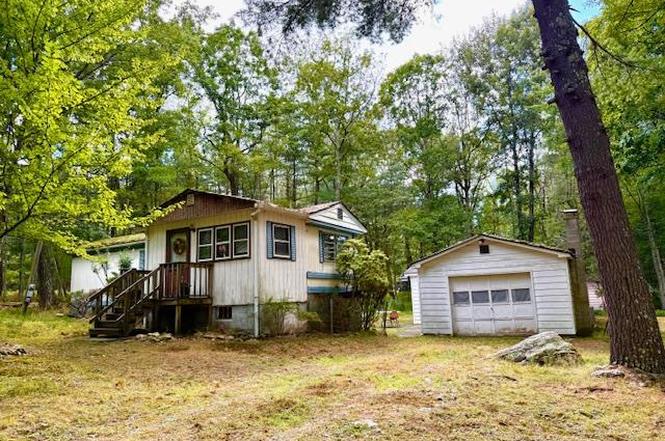
Listing remarks
Unique Opportunity to purchase 2 dwellings on one lot. 1.17 acres in Glen Spey NY with level land within 30 minutes of many area amenities including Port Jervis commuter trains, buses, hiking trails, schools, library, farmers markets and the Delaware River for recreation. Property features a 1991 cottage with bedroom, living room, kitchen and bathroom attached to a 2 car garage. In addition there is a 1969 vintage mobile home with 1 bedroom, living room, bathroom, kitchen and enclosed front porch. Mobile Home and Cottage need TLC so roll up your sleeves get to work ! Well worth the effort to repair these homes and make your home ownership dreams come true for a reasonable price! Only 2 hou
Key facts
- Buses
- Level land
- 1.17 acres
Tags
Neighborhood map
What this means for you Summary
Snapshot
- This is a 1-bed/1.0-bath single-family listed at $149k.
Deal economics
- At list price, monthly cash flow is $104 ($1k/yr) — positive.
- The deal already cash-flows at list — no discount required.
- To meet the 1% rule (rent ≥ 1% of price), the offer needs to be $148k (0.8% below list).
- Recommended offer: $136k (9.0% below list) — sets the bar for market timing.
- Cap rate 7.1% vs local median 2.2% in Eldred — top-decile yield for the area; either an underpriced asset or a hidden risk that comps aren't pricing in. Stress-test before assuming the spread holds.
Location & tenants
- Location reads: area grade C — affects rentability + tenant quality, not the cash-flow math above.
- Eldred Central School District (rural): math 33% / reading 50% proficiency, ranked #495 of 590 in NY (top 84%) — families likely to look elsewhere, expect single-tenant / working-renter base with shorter leases.
- Zoned schools: George Ross Mackenzie Elementary School (math 22% / reading 47%, grade F, #1,577 of 2,108 statewide, top 77%, 242 students, 38% FRL); Eldred Junior-Senior High School (math 47% / reading 57%, grade D+, #946 of 1,100 statewide, top 88%, 230 students, 46% FRL).
- Market conditions: 66 active listings in the ZIP; 739 units permitted in Sullivan County in 2024 (5 in 5+ unit buildings).
Forward outlook
- In year one you build about $16k of equity ($1k loan paydown + $15k appreciation (10.0% local appreciation)).
- Sullivan County population projected at -24% by 2050 — secular population decline; favor cash flow + early exit over multi-decade hold.
- At projected returns (10.0% appreciation + 3.0% rent growth), your $42k cash investment doubles in ~3 years — after that, you're playing with house money.
- By year 3, paydown + projected appreciation supports a ~$40k cash-out refi (75% LTV) — recoverable capital for the next deal without selling this one.
Negotiation context
- It's been on market 91 days — a 9% lower offer ($136k) is reasonable based on typical stale-listing flexibility.
- Current owner paid $16k; list at $149k implies a 831% gain — meaningful room to come down on a strong offer.
Questions for the listing agent
- It's been on market 91 days. Have you received any prior offers? Is the seller open to a 9% concession, seller financing, or rate buy-down credit?
- Why hasn't it sold? Are there any deal-killer items the seller is aware of (foundation, flood, title, zoning, code violations)?
- Is there a deadline driving the sale (1031 exchange, divorce, estate, relocation)? That informs how much negotiation room exists.
- What's the average days-on-market for RENTAL listings here right now (not sales)? A rising rental-DOM trend means longer vacancies and softer asking-rent achievability than the comps imply.
- What's the recent tenant-quality profile in this submarket — average credit score on applications, eviction rate, late-payment / NSF rate, and stable-employment percentage? A property-management company in the area should have these aggregated.
- How much new for-sale + rental construction is in the pipeline within 1–3 miles? Heavy new supply typically softens prices + rents 12–24 months out; constrained supply supports both.
Investment metrics
- 1% rule
- 0.99% ✗
- Cap rate
- 7.13%
- Cash-on-cash
- 2.99%
- DSCR
- 1.13
- GRM
- 8.4
CMA / ARV
No comps found within radius.
Projected returns pro-forma
10.0% appreciation · 3.0% rent growth · sell at horizon
- IRR
- 26.4%
- Equity multiple
- 3.11×
- Total profit
- $87,821
- Equity at exit
- $134,231
- IRR
- 23.2%
- Equity multiple
- 7.08×
- Total profit
- $253,490
- Equity at exit
- $289,474
Cash invested: $41,720 (down + closing). Projections, not guarantees.
Landlord ↔ Tenant lean methodology
- Overall (STATE)
- 15 Strongly Tenant-Friendly
- State New York
- 15 Strongly Tenant-Friendly · D+10
- County
- — inherits STATE
- City
- — inherits STATE
ZIP-level market 12737
- Active inventory
- 66
- Price-to-rent
- 8.4×
Monthly cashflow live
- Estimated rent
- $1,477 medium interval (Pro) →
- Mortgage (P&I)
- −$781
- Tax from tax record
- −$220 /mo · $2,636/yr
- Insurance
- −$62
- HOA
- −$0
- Vacancy / Maint / Mgmt
- −$310
- Net cashflow
- $104
Break-even live
UW: 25.0% down · 7.5% · 30yr · 1.5% tax · 5.0% vac · 8.0% maint · 8.0% mgmt
Financing live
Cash to close
- Down payment
- $37,250
- Closing costs
- $4,470
- Reserves months
- —
- Total cash needed
- —
Loan-product check · same deal, 3 products live
Conventional
25% down · 7.5% · 30yr
- Down + closing
- —
- Monthly P&I
- —
- Monthly cashflow
- —
- DSCR
- —
- Eligible?
- —
Personal DTI + credit; lowest rate.
DSCR
20% down · 8.5% · 30yr
- Down + closing
- —
- Monthly P&I
- —
- Monthly cashflow
- —
- DSCR
- —
- Eligible?
- —
No personal income docs; deal must DSCR.
Hard money
10% down · 12.0% · 12mo
- Down + closing
- —
- Monthly P&I
- —
- Monthly cashflow
- —
- DSCR
- —
- Eligible?
- —
Short-term bridge; refi at stabilization.
Listing history 4 events
-
2025-11-25status Pending
-
2025-10-22price $149,000
-
2025-08-26$169,000 Active
-
1984-12-20soldstatus $16,000
ⓘ Source: listings_history table (triggers on properties + properties_extension) + one-shot
backfill from property_details.listing_events for pre-trigger history.
Tax reassessment forecast NY · Partial reset (capped growth)
- Current annual tax
- $2,636 · $220/mo
- Projected year-2 tax
- $2,636 · $220/mo
- Expected delta
- $0/yr ($0/mo · 0.0%)
ⓘ Screening estimate from a state-policy table — verify with the county assessor before closing.
Climate risk First Street
- Flood 1/10 Low FEMA zone X (unshaded) · 0% chance over 30 yrs
- Wildfire 4/10 Moderate
- Heat 2/10 Low 6 d/yr ≥94°F today · 13 d/yr by 30 yrs out
- Wind 3/10 Moderate 5% chance of damaging wind over 30 yrs
- Air quality 2/10 Low 1 unhealthy d/yr today · 1 by 30 yrs out
Nearby sold comps map
Loading sold comps map…
Walkable amenities ~0.75 mi
Loading nearby amenities…
Taxation est. · year 1
- Rental income
- $17,730
- − Mortgage interest
- −$8,346
- − Property taxes
- −$2,636
- − Insurance
- −$745
- − Repairs & maintenance
- −$1,418
- − Management
- −$1,418
- − Depreciation
- −$4,335
- Taxable loss
- −$1,169
- Est. tax savings @ 24.0%
- +$281
- After-tax cash flow
- $1,529/yr
For passive investors: Depreciation is non-cash, so a rental often shows a tax loss while cash-flowing — sheltering income. Rental losses are passive: they offset passive income freely, and up to $25,000/yr can offset ordinary (W-2) income if you actively participate and your MAGI is under $100k (phasing out to $0 by $150k); unused losses carry forward. On sale, claimed depreciation is recaptured at up to 25%, and gains may owe capital-gains tax (a 1031 exchange can defer both). Figures are a year-1 estimate at your 24.0% rate — not tax advice; consult a CPA.
Schools (NCES district)
- District
- Eldred Central School District
- NCES district ID
- 3610410
- Math proficiency
- 33% ▼ -15.00%
- Reading proficiency
- 50% ▲ 11.00%
- Median HH income
- $52,775
- Composite
- 35.94/100
- National rank
- #4800
- State rank
- #495 of 590 in NY
Livability — Eldred
No livability data for this city. (Only ~50 U.S. cities are tracked.)
Census & demographics
- Population (ZIP)
- 1,817
Population outlook (Sullivan County) Hauer SSP2
- Today (2025)
- 68,974 people
- By 2030
- 65,609 · -4.9%
- By 2040
- 58,878 · -14.6%
- By 2050
- 52,500 · -23.9%
- By 2075
- 39,941 · -42.1%
- By 2100
- 28,880 · -58.1%
Race, ethnicity, and origin ACS 2023
- Neighborhood character
- Predominantly White (82%)
- Race & ethnicity
- White 82% Hispanic / Latino 13% Two or more races 12%
- Hispanic origin (detail)
- Puerto Rican 9% Cuban 1%
- Common ancestry
- Romanian 7% Slovak 5% Lithuanian 4%
- Foreign-born
- 5% · South Korea
- Languages at home
- 92% English-only · Russian/Polish/Slavic 3% Other Indo-European 3% Spanish 2%
Political lean MEDSL · Sullivan
- 2024 margin
- R (+16.7) · D 41.6% · R 58.4%
- 2008→2024 swing
- -26.2pp toward R · 2008: 9.5pp · 2024: -16.7pp
- All cycles
- 2024: R+16.7 2020: R+9.2 2016: R+13.7 2012: D+10.4 2008: D+9.5
Not yet ingested
- Civics
- —
Market trends
- HPI YoY
- ▲ 132.02%
- Current HPI
- 443.8248
- Rent YoY
- —
- Metro
- —
- State GDP YoY
- ▲ 2.60%
- F500 in state
- 92
Industry mix (Fortune 500 HQ in NY)
| Industry | F500 HQs | Revenue |
|---|---|---|
| Financial Services | 10 | $950B |
|
||
| Consumer Goods | 9 | $162B |
|
||
| Insurance | 4 | $225B |
|
||
| Telecommunications | 2 | $144B |
|
||
| Pharmaceuticals | 2 | $112B |
|
||
| Media / Entertainment | 2 | $69B |
|
||
Price history
+831.2% since first listed4 events — show timeline
- 2025-11-25 Pending — OneKey® MLS as Distributed by MLS Grid
- 2025-10-22 Price Changed $149,000 OneKey® MLS as Distributed by MLS Grid
- 2025-08-26 Listed $169,000 OneKey® MLS as Distributed by MLS Grid
- 1984-12-20 Sold (Public Records) $16,000 Public Records
Property tax history
+0.6%/yrLatest (2025): $2,636 · +1.6% YoY. Source: county tax records.
Cash-flow waterfall
monthlySold comps — $/sqft
last 12 mo · ≤1 miLoading sold comps…