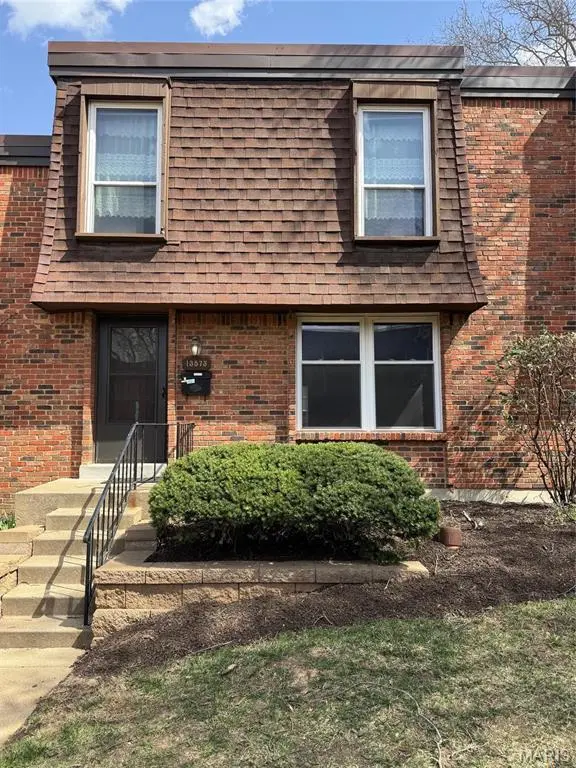
13573 Coliseum Dr · Chesterfield, MO
Flood risk 1/10 · Minimal
- FEMA flood zone
- X (unshaded)
- Chance of flooding over 30 yrs
- 0.0%
- Est. flood insurance / yr
- $473 – $860
Fire risk 1/10 · Minimal
- Est. fire insurance / yr
- $1,054 – $1,958
Heat risk 5/10 · Moderate
- Hot days now (above 106°F)
- 7 days/yr
- Hot days in 30 yrs
- 21 days/yr
Wind risk 2/10 · Minimal
- Chance of severe wind over 30 yrs
- 1.0%
Air-quality risk 2/10 · Minimal
- Unhealthy air days now
- 2 days/yr
- Unhealthy air days in 30 yrs
- 2 days/yr
Risk factors via First Street. Map © Google.
Why this score? — see what drove the D grade
The composite is a weighted blend of 9 inputs, each scored 0–100. Each bar is that input's sub-score; the figure is the points it added to the 100-point composite (weight × sub-score).
- Cash flow +10.5/30.0
- ARV discount +9.5/15.0
- 1% rule +6.0/10.0
- Schools +5.1/10.0
- Rent growth +3.9/5.0
- Livability +3.6/5.0
- DSCR +3.0/10.0
- Condition / age +2.5/5.0
- Appreciation +0.0/10.0
$189,900
🖨 Deal sheet (PDF) 📄 Offer letter ✓ Due diligence
Listing remarks
Back on market! This condo has been owned and occupied by the same family for the past 28 years. The spacious living and dining room combination provides an ideal setting for large family gatherings. It flows seamlessly into a generously sized breakfast room, which opens to a sizable deck—perfect for outdoor enjoyment—while the cozy, updated kitchen offers both function and style. The home features beautiful wood floors throughout the main and upper levels. Recent upgrades include updated kitchen, newer windows, Trane HVAC system, a new water heater, and numerous electrical improvements. The partially finished lower level provides additional living space for flexibility and comf
Key facts
- New water heater
- Sizable deck
- Trane hvac system
Tags
Property features AI
Finance
- Other: Estimated above-grade finished area and living area provided by assessor/estimate
- Financial info: Lease not considered
- HOA & community: Forum West HOA; Monthly HOA fee of $529; HOA amenities include clubhouse and pool; HOA fee covers insurance, exterior maintenance, grounds maintenance, pool, sewer, trash and water
Exterior
- Parking: Carport with 2 spaces
- Utilities: Public water; Public sewer; Electric service by Ameren; Electricity and natural gas available
- Home design: Residential condominium; Two-story design; Entry level information not specified
- Construction: Brick veneer construction
- Exterior features: Close to clubhouse
Interior
- Bedrooms: 3 bedrooms, all on the upper level
- Bathrooms: 2 full bathrooms; 2 half bathrooms (one half bath on main level, one half bath on lower level)
- Heating & cooling: Forced air heating; Central air conditioning
- Interior features: Basement with walk-out access and bathroom; Fireplace located in the basement; Two levels
Neighborhood map
What this means for you Summary
Snapshot
- This is a 3-bed/2.5-bath condo listed at $190k.
Deal economics
- At list price, monthly cash flow is $-99 ($-1k/yr) — negative.
- To cash-flow at today's rent, offer at most $172k (9.2% below list).
- Meets the 1% rule at list price ($2k rent vs $190k).
- Recommended offer: $172k (9.2% below list) — sets the bar for cash-flow.
- Cap rate 5.7% vs local median 2.9% in Chesterfield — top-decile yield for the area; either an underpriced asset or a hidden risk that comps aren't pricing in. Stress-test before assuming the spread holds.
Location & tenants
- Location reads 71/100 on livability (#110 in MO) — a middle-class / working-renter tenant base. Strengths: employment A+, housing A+, crime A; Watch: amenities F, commute F, cost of living D-.
- Parkway C-2 (suburban): math 49% / reading 62% proficiency, ranked #18 of 324 in MO (top 6%) — acceptable for families but not a draw, mixed tenant base, ~2y average lease; only 14% free/reduced lunch — higher-income household profile.
- Zoned schools: River Bend Elem. (math 42% / reading 61%, grade C-, #268 of 1,115 statewide, top 24%, 423 students, 18% FRL); Central Middle (math 53% / reading 64%, grade B, #24 of 391 statewide, top 6%, 925 students, 14% FRL); Central High (math 53% / reading 73%, grade B-, #26 of 521 statewide, top 5%, 1,244 students, 13% FRL) — zoned schools at 15% FRL track the district average.
- Market conditions: Rents rising fast (+5.5%/yr); 228 active listings in the ZIP; 8 comparable units currently listed for rent nearby; rentals lingering (median 46d on market — plan ~5-8 weeks vacancy on turnover, expect pricing pressure); 50% of comp listings sitting > 30 days — soft ceiling on asking rent; high-income renter base; 920 units permitted in St. Louis County in 2024 (250 in 5+ unit buildings).
Forward outlook
- Local home prices are declining (-3.0%/yr); year-one equity from $1k of loan paydown is wiped out by about $6k of value loss. Plan a longer hold.
Negotiation context
- It's been on market 60 days — a 3% lower offer ($184k) is reasonable based on typical stale-listing flexibility.
- 4 sale attempts since 2y ago with the ask held roughly flat each time — persistent listings suggest the price (not the market) is what's stuck; bring a comps-based counter.
- Current owner paid $68k; list at $190k implies a 179% gain — meaningful room to come down on a strong offer.
Risks & watch-outs
- Watch-outs: HOA is 25% of rent.
- Climate carrying-cost: extreme-heat days projected 7→21/yr by 2055 (HVAC capex compounding) — expect insurance premiums to compound above CPI over the hold.
Questions for the listing agent
- What do current leases actually rent for vs. the listed asking? Can we see a recent rent roll and the last 12 months of T-12 income?
- It's been on market 60 days. Have you received any prior offers? Is the seller open to a 9% concession, seller financing, or rate buy-down credit?
- Built in 1968 — when were the roof, HVAC, electrical panel, plumbing, and water heater last replaced?
- What does the HOA fee cover, when was the last increase, and are there any pending special assessments or reserve-fund shortfalls?
- Any open or pending special assessments — roof, HVAC, plumbing, elevator, façade? What's the per-unit balance and payoff schedule, and is the seller paying it off at close or rolling it to the buyer?
- Is there a deadline driving the sale (1031 exchange, divorce, estate, relocation)? That informs how much negotiation room exists.
- Schools are A-rated — typically a magnet for longer-tenancy family renters. What's the average tenant stay here, and is there a school-zone premium baked into asking?
- The area grade is low — what's the realistic commute time and amenity access for the typical tenant pool here? Any planned neighborhood developments (good or bad) we should know about?
- What's the average days-on-market for RENTAL listings here right now (not sales)? A rising rental-DOM trend means longer vacancies and softer asking-rent achievability than the comps imply.
- What's the recent tenant-quality profile in this submarket — average credit score on applications, eviction rate, late-payment / NSF rate, and stable-employment percentage? A property-management company in the area should have these aggregated.
- How much new apartment / multifamily construction is in the pipeline within 1–3 miles? Heavy new supply (>2% of stock underway) typically softens rents 12–24 months out; light construction supports rent growth.
Investment metrics
- 1% rule
- 1.10% ✓
- Cap rate
- 5.67%
- Cash-on-cash
- -2.22%
- DSCR
- 0.90
- GRM
- 7.6
CMA / ARV
- ARV (median comp)
- $198,613
- List price
- $189,900
- Delta
- -4.39%
- Verdict
- FAIR
- Comps
- 20 within 1.0 mi
Projected returns pro-forma
-3.0% appreciation · 5.52% rent growth · sell at horizon
- IRR
- -16.1%
- Equity multiple
- 0.41×
- Total profit
- $-31,328
- Equity at exit
- $28,315
- IRR
- -2.6%
- Equity multiple
- 0.80×
- Total profit
- $-10,717
- Equity at exit
- $16,419
Cash invested: $53,172 (down + closing). Projections, not guarantees.
Landlord ↔ Tenant lean methodology
- Overall (STATE)
- 81 Strongly Landlord-Friendly
- State Missouri
- 81 Strongly Landlord-Friendly · R+10
- County
- — inherits STATE
- City
- — inherits STATE
ZIP-level market 63017
- Rents YoY
- 5.5%
- Active inventory
- 228
- Price-to-rent
- 7.6×
Monthly cashflow live
- Estimated rent
- $2,086 high interval (Pro) →
- Mortgage (P&I)
- −$996
- Tax from tax record
- −$143 /mo · $1,715/yr
- Insurance
- −$79
- HOA
- −$529
- Vacancy / Maint / Mgmt
- −$438
- Net cashflow
- $-99
Break-even live
Sensitivity live
| Price | -10% $9 | -5% $-45 | +0% $-99 | +5% $-152 | +10% $-206 |
|---|---|---|---|---|---|
| Rent | -10% $-263 | -5% $-181 | +0% $-99 | +5% $-16 | +10% $66 |
| Rate | -1.0pp $-3 | -0.5pp $-50 | base $-99 | +0.5pp $-148 | +1.0pp $-198 |
UW: 25.0% down · 7.5% · 30yr · 1.5% tax · 5.0% vac · 8.0% maint · 8.0% mgmt
Financing live
Cash to close
- Down payment
- $47,475
- Closing costs
- $5,697
- Reserves months
- —
- Total cash needed
- —
Loan-product check · same deal, 3 products live
Conventional
25% down · 7.5% · 30yr
- Down + closing
- —
- Monthly P&I
- —
- Monthly cashflow
- —
- DSCR
- —
- Eligible?
- —
Personal DTI + credit; lowest rate.
DSCR
20% down · 8.5% · 30yr
- Down + closing
- —
- Monthly P&I
- —
- Monthly cashflow
- —
- DSCR
- —
- Eligible?
- —
No personal income docs; deal must DSCR.
Hard money
10% down · 12.0% · 12mo
- Down + closing
- —
- Monthly P&I
- —
- Monthly cashflow
- —
- DSCR
- —
- Eligible?
- —
Short-term bridge; refi at stabilization.
Rent comps 8 comps
| Address | Beds | Baths | Sqft | Rent | $/sqft | DOM | Units | Dist |
|---|---|---|---|---|---|---|---|---|
| 616 Broadmoor Dr Unit C Chesterfield, MO | 3.0 | 2.0 | 1120 | $1,795 | $1.60 | 9d | 1 | 0.11mi |
| 621 Broadmoor Dr Chesterfield, MO | 2.0 | 2.0 | 900 | $1,945 | $2.16 | 45d | 1 | 0.15mi |
| 631 Broadmoor Dr Unit A Chesterfield, MO | 3.0 | 2.0 | 1050 | $2,000 | $1.90 | 45d | 1 | 0.23mi |
| 506 Broadmoor Dr Chesterfield, MO | 3.0 | 2.5 | 1500 | $2,250 | $1.50 | 45d | 1 | 0.24mi |
| 502 Broadmoor Dr Unit 506 Chesterfield, MO | 3.0 | 2.5 | 1500 | $2,250 | $1.50 | 25d | 1 | 0.24mi |
| 1173 Pompeii Dr Chesterfield, MO | 1.0–2.0 | 1.0–2.0 | 950 | $1,799 | $1.89 | 0d | 24 | 0.30mi |
| 815 Montmartre Ct Saint Louis, MO | 3.0 | 2.0 | 1862 | $2,300 | $1.24 | 45d | 1 | 1.10mi |
| 14512 Cazado Dr Chesterfield, MO | 2.0 | 2.0 | 945 | $1,400 | $1.48 | 6d | 1 | 1.50mi |
HOA detail condo
- Monthly dues
- $529 · $6,348/yr
- Likely covers
- waterelectric
- Assessments
- None detected in remarks — confirm with the listing agent.
Listing history 26 events
-
2026-06-21days on market $189,900 Active 60 DOM
-
2026-06-18days on market $189,900 Active 57 DOM
-
2026-06-17days on market $189,900 Active 56 DOM
-
2026-06-16days on market $189,900 Active 55 DOM
-
2026-06-15days on market $189,900 Active 54 DOM
-
2026-06-13days on market $189,900 Active 52 DOM
-
2026-06-13days on market $189,900 Active 51 DOM
-
2026-06-09days on market $189,900 Active 48 DOM
-
2026-06-08days on market $189,900 Active 47 DOM
-
2026-06-07days on market $189,900 Active 46 DOM
-
2026-06-03days on market $189,900 Active 42 DOM
-
2026-06-02days on market $189,900 Active 41 DOM
-
2026-06-01days on market $189,900 Active 40 DOM
-
2026-05-31days on market $189,900 Active 39 DOM
-
2026-05-11price $189,900 1104-char remark
-
2026-04-22$184,900 Active 1104-char remark
-
2025-07-03price $179,900
-
2025-07-03$184,900 Active
-
2025-06-17price $184,900
-
2025-05-02status Active
-
2025-04-09historical Active Under Contract
-
2024-12-13$189,900 Active
-
2024-12-04historical
-
1996-06-11soldstatus $68,000
-
1990-07-01soldstatus $67,300
-
1986-08-01soldstatus $74,500
ⓘ Source: listings_history table (triggers on properties + properties_extension) + one-shot
backfill from property_details.listing_events for pre-trigger history.
Tax reassessment forecast MO · Resets to sale price
- Current annual tax
- $1,715 · $143/mo
- Projected year-2 tax
- $1,842 · $154/mo
- Expected delta
- +$127/yr (+$11/mo · 7.4%)
ⓘ Screening estimate from a state-policy table — verify with the county assessor before closing.
Climate risk First Street
- Flood 1/10 Low FEMA zone X (unshaded) · 0% chance over 30 yrs
- Wildfire 1/10 Low
- Heat 5/10 Major 7 d/yr ≥106°F today · 21 d/yr by 30 yrs out
- Wind 2/10 Low 100% chance of damaging wind over 30 yrs
- Air quality 2/10 Low 2 unhealthy d/yr today · 2 by 30 yrs out
Nearby sold comps map
Loading sold comps map…
Walkable amenities ~0.75 mi
Loading nearby amenities…
Taxation est. · year 1
- Rental income
- $25,038
- − Mortgage interest
- −$10,637
- − Property taxes
- −$1,715
- − Insurance
- −$950
- − Repairs & maintenance
- −$2,003
- − Management
- −$2,003
- − HOA
- −$6,348
- − Depreciation
- −$5,524
- Taxable loss
- −$4,142
- Est. tax savings @ 24.0%
- +$994
- After-tax cash flow
- $-189/yr
For passive investors: Depreciation is non-cash, so a rental often shows a tax loss while cash-flowing — sheltering income. Rental losses are passive: they offset passive income freely, and up to $25,000/yr can offset ordinary (W-2) income if you actively participate and your MAGI is under $100k (phasing out to $0 by $150k); unused losses carry forward. On sale, claimed depreciation is recaptured at up to 25%, and gains may owe capital-gains tax (a 1031 exchange can defer both). Figures are a year-1 estimate at your 24.0% rate — not tax advice; consult a CPA.
Schools (NCES district)
- District
- Parkway C-2
- NCES district ID
- 2923580
- Math proficiency
- 49% ▼ -11.00%
- Reading proficiency
- 62% ▼ -2.00%
- Median HH income
- $83,551
- Composite
- 50.5/100
- National rank
- #1851
- State rank
- #18 of 324 in MO
Livability — Chesterfield
- Score
- 71/100
- State rank
- #110
- US rank
- #7054
Category grades
Schools grade is shown separately in the Schools card above.
Census & demographics
- Census place
- Chesterfield, MO
- County
- Saint Louis County · 888,823 people
- City population
- 43,243
- Metro
- St. Louis, MO-IL
- Population (ZIP)
- 43,243
- Household income
- $127,095
- Rent vs Own
- Severe rent burden
- 1012.0
Population outlook (St. Louis County) Hauer SSP2
- Today (2025)
- 1,025,227 people
- By 2030
- 1,028,023 · +0.3%
- By 2040
- 1,020,940 · -0.4%
- By 2050
- 1,007,280 · -1.8%
- By 2075
- 987,277 · -3.7%
- By 2100
- 921,984 · -10.1%
Race, ethnicity, and origin ACS 2023
- Neighborhood character
- Predominantly White (75%)
- Race & ethnicity
- White 75% Asian 13% Two or more races 7% Black 4% Hispanic / Latino 3%
- Common ancestry
- Scotch-Irish 3% Romanian 3% Slovak 3%
- Foreign-born
- 16% · China, Canada, South Korea
- Languages at home
- 84% English-only · Other Indo-European 5% Other Asian/Pacific 4% Chinese 2%
Political lean MEDSL · St. Louis
- 2024 margin
- Strong D (+23.4) · D 60.8% · R 37.4% · Other 1.7%
- 2008→2024 swing
- +3.5pp toward D · 2008: 19.9pp · 2024: 23.4pp
- All cycles
- 2024: D+23.4 2020: D+24.0 2016: D+16.2 2012: D+13.7 2008: D+19.9
Not yet ingested
- Civics
- —
Market trends
- HPI YoY
- ▼ -230.79%
- Current HPI
- 218.3938
- Rent YoY
- ▲ 5.52%
- Metro
- St. Louis, MO-IL
- State GDP YoY
- ▲ 1.84%
- F500 in state
- 20
Industry mix (Fortune 500 HQ in MO)
| Industry | F500 HQs | Revenue |
|---|---|---|
| Healthcare | 1 | $163B |
|
||
| Insurance | 1 | $21B |
|
||
| Industrial Technology | 1 | $17B |
|
||
| Retail | 1 | $16B |
|
||
| Industrial Distribution | 1 | $10B |
|
||
| Utilities | 1 | $9B |
|
||
Price history
+154.9% since first listed12 events — show timeline
- 2026-05-11 Price Changed $189,900 MARIS as Distributed by MLS Grid
- 2026-04-22 Listed $184,900 MARIS as Distributed by MLS Grid
- 2025-07-03 Price Changed $179,900 MARIS as Distributed by MLS Grid
- 2025-07-03 Listed $184,900 MARIS as Distributed by MLS Grid
- 2025-06-17 Price Changed $184,900 MARIS as Distributed by MLS Grid
- 2025-05-02 Relisted — MARIS as Distributed by MLS Grid
- 2025-04-09 Contingent — MARIS as Distributed by MLS Grid
- 2024-12-13 Listed $189,900 MARIS as Distributed by MLS Grid
- 2024-12-04 Coming Soon — MARIS as Distributed by MLS Grid
- 1996-06-11 Sold (Public Records) $68,000 Public Records
- 1990-07-01 Sold (Public Records) $67,300 Public Records
- 1986-08-01 Sold (Public Records) $74,500 Public Records
Property tax history
+3.1%/yrLatest (2022): $1,715 · +0.4% YoY. Source: county tax records.
Cash-flow waterfall
monthlySold comps — $/sqft
last 12 mo · ≤1 miLoading sold comps…