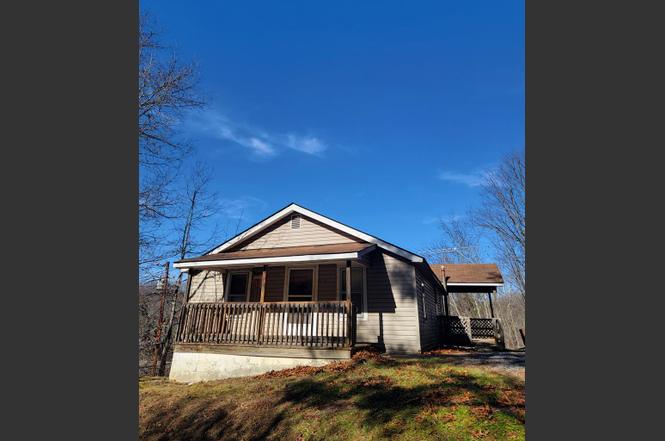
416 Summit St · Sophia, WV
Flood risk 1/10 · Minimal
- FEMA flood zone
- X (unshaded)
- Chance of flooding over 30 yrs
- 0.0%
- Est. flood insurance / yr
- $507 – $1,088
Fire risk 3/10 · Minor
- Est. fire insurance / yr
- $787 – $1,461
Heat risk 2/10 · Minimal
- Hot days now (above 91°F)
- 7 days/yr
- Hot days in 30 yrs
- 20 days/yr
Wind risk 1/10 · Minimal
- Chance of severe wind over 30 yrs
- —
Air-quality risk 1/10 · Minimal
- Unhealthy air days now
- 0 days/yr
- Unhealthy air days in 30 yrs
- 0 days/yr
Risk factors via First Street. Map © Google.
Why this score? — see what drove the B grade
The composite is a weighted blend of 9 inputs, each scored 0–100. Each bar is that input's sub-score; the figure is the points it added to the 100-point composite (weight × sub-score).
- Cash flow +30.0/30.0
- DSCR +10.0/10.0
- 1% rule +9.4/10.0
- ARV discount +8.5/15.0
- Appreciation +4.6/10.0
- Schools +3.0/10.0
- Livability +2.9/5.0
- Rent growth +2.5/5.0
- Condition / age +2.5/5.0
$59,000
🖨 Deal sheet 📄 Offer letter ✓ Due diligence
Listing remarks
Investors Special! With a little TLC this 2 bedroom 1 bath home would make a great rental. Or if you're looking for a quaint home to put your own DIY special touch on, this would be the perfect place for you. It has arched doorways, a huge eat in kitchen, a spacious living room, original hardwood floors, & plenty of storage in the attic. Outside there are 2 covered porches to relax on & enjoy the quiet country setting. There are 2 lots, one cleared & the other perfectly wooded for privacy. Plenty of parking as well!
Key facts
- Covered porches
- Plenty of storage
- Huge eat in kitchen
Tags
Property features AI
Exterior
- Parking: Open parking on gravel; no garage
- Utilities: Public water; Public sewer
- Home design: Residential property
- Construction: Vinyl siding; Asphalt roof; Has basement (crawl space, exterior entry, unfinished)
- Exterior features: Garden; Covered porch/patio; Rolling lot/rolling slope; Has a view
Interior
- Kitchen: Eat-in kitchen; Gas water heater
- Bedrooms: 2 main-level bedrooms
- Flooring: Hardwood; Vinyl; Laminate
- Bathrooms: 1 full bathroom
- Heating & cooling: Natural gas heating; Floor furnace; Ceiling fan(s); no central air
- Interior features: Eat-in kitchen; Ceiling fans; Window coverings and blinds; Gas water heater
- Laundry & utility: Washer hookup; Unfinished basement with exterior entry and crawl space
Neighborhood map
What this means for you Summary
Snapshot
- This is a 2-bed/1.0-bath single-family listed at $59k.
Deal economics
- At list price, monthly cash flow is $265 ($3k/yr) — positive.
- The deal already cash-flows at list — no discount required.
- Meets the 1% rule at list price ($852 rent vs $59k).
- Recommended offer: $52k (12.0% below list) — sets the bar for market timing.
Location & tenants
- Location reads 57/100 on livability (#260 in WV) — a working-class tenant base; expect higher turnover. Strengths: crime A+, cost of living A+, housing A+; Watch: amenities F, commute F, employment F.
- Raleigh County Schools (rural): math 29% / reading 42% proficiency, ranked #14 of 55 in WV (top 26%) — families likely to look elsewhere, expect single-tenant / working-renter base with shorter leases.
- Zoned schools: Coal City Elementary (math 22% / reading 27%, grade F, #287 of 377 statewide, top 85%, 374 students, 0% FRL); Independence Middle School (math 33% / reading 52%, grade D-, #13 of 109 statewide, top 13%, 477 students, 0% FRL); Independence High School (math 12% / reading 37%, grade F, #91 of 110 statewide, top 85%, 572 students, 0% FRL) — zoned schools average 0% FRL vs 46% district-wide (46 pts lower); this property's tenant base skews higher-income than the district average.
- Market conditions: 3 active listings in the ZIP; 41 units permitted in Raleigh County in 2024 (0 in 5+ unit buildings).
Forward outlook
- Local home prices are declining (-0.9%/yr); year-one equity from $408 of loan paydown is wiped out by about $509 of value loss. Plan a longer hold.
- Raleigh County population projected at -16% by 2050 — secular population decline; favor cash flow + early exit over multi-decade hold.
- At projected returns (-0.9% appreciation + 3.0% rent growth), your $17k cash investment doubles in ~5 years — after that, you're playing with house money.
Negotiation context
- It's been on market 179 days — a 12% lower offer ($52k) is reasonable based on typical stale-listing flexibility.
Risks & watch-outs
- Watch-outs: built in 1935 — expect roof / HVAC / electrical / plumbing capex.
Questions for the listing agent
- It's been on market 179 days. Have you received any prior offers? Is the seller open to a 12% concession, seller financing, or rate buy-down credit?
- Built in 1935 — when were the roof, HVAC, electrical panel, plumbing, and water heater last replaced?
- Why hasn't it sold? Are there any deal-killer items the seller is aware of (foundation, flood, title, zoning, code violations)?
- Is there a deadline driving the sale (1031 exchange, divorce, estate, relocation)? That informs how much negotiation room exists.
- Schools are F-rated, which usually means shorter tenancies and higher turnover. Who's the typical renter profile here, and what's been the actual vacancy rate?
- What's the average days-on-market for RENTAL listings here right now (not sales)? A rising rental-DOM trend means longer vacancies and softer asking-rent achievability than the comps imply.
- What's the recent tenant-quality profile in this submarket — average credit score on applications, eviction rate, late-payment / NSF rate, and stable-employment percentage? A property-management company in the area should have these aggregated.
- How much new for-sale + rental construction is in the pipeline within 1–3 miles? Heavy new supply typically softens prices + rents 12–24 months out; constrained supply supports both.
Investment metrics
- 1% rule
- 1.44% ✓
- Cap rate
- 11.69%
- Cash-on-cash
- 19.28%
- DSCR
- 1.86
- GRM
- 5.8
CMA / ARV
- ARV (on-the-fly)
- $60,384
- Comps found
- 4
Show comp detail 4 sales within ~0.75 mi
| Address | Dist | Beds/Ba | Sqft | Sold | Price | $/sf | Match |
|---|---|---|---|---|---|---|---|
| 203 Summit St | 0.11mi | 2/1.0 | 968 (+9%) | 18mo | $39,950 | $41 | 65 |
| 118 Thorn St | 0.30mi | 2/1.5 | 980 (+10%) | 5mo | $106,000 | $108 | 63 |
| 128 Dunn St | 0.57mi | 2/1.0 | 768 (-14%) | 3mo | $52,500 | $68 | 48 |
| 129 Maple Ave | 0.59mi | 3/1.0 (+1) | 768 (-14%) | 11mo | $12,000 | $16 | 36 |
Match score weights: distance 35% · size 25% · config 20% · recency 20%. Top-matched comps best support the ARV.
Projected returns pro-forma
-0.86% appreciation · 3.0% rent growth · sell at horizon
- IRR
- 17.0%
- Equity multiple
- 1.78×
- Total profit
- $12,837
- Equity at exit
- $14,629
- IRR
- 22.5%
- Equity multiple
- 3.31×
- Total profit
- $38,179
- Equity at exit
- $15,694
Cash invested: $16,520 (down + closing). Projections, not guarantees.
Landlord ↔ Tenant lean methodology
- Overall (STATE)
- 83 Strongly Landlord-Friendly
- State West Virginia
- 83 Strongly Landlord-Friendly · R+22
- County
- — inherits STATE
- City
- — inherits STATE
ZIP-level market 25921
- Home prices YoY
- -0.3%
- Active inventory
- 3
- Price-to-rent
- 5.8×
Monthly cashflow live
- Estimated rent
- $852 medium interval (Pro) →
- Mortgage (P&I)
- −$309
- Tax est. 1.5%
- −$74 /mo · $885/yr
- Insurance
- −$25
- HOA
- −$0
- Vacancy / Maint / Mgmt
- −$179
- Net cashflow
- $265
Break-even live
UW: 25.0% down · 7.5% · 30yr · 1.5% tax · 5.0% vac · 8.0% maint · 8.0% mgmt
Financing live
Cash to close
- Down payment
- $14,750
- Closing costs
- $1,770
- Reserves months
- —
- Total cash needed
- —
Loan-product check · same deal, 3 products live
Conventional
25% down · 7.5% · 30yr
- Down + closing
- —
- Monthly P&I
- —
- Monthly cashflow
- —
- DSCR
- —
- Eligible?
- —
Personal DTI + credit; lowest rate.
DSCR
20% down · 8.5% · 30yr
- Down + closing
- —
- Monthly P&I
- —
- Monthly cashflow
- —
- DSCR
- —
- Eligible?
- —
No personal income docs; deal must DSCR.
Hard money
10% down · 12.0% · 12mo
- Down + closing
- —
- Monthly P&I
- —
- Monthly cashflow
- —
- DSCR
- —
- Eligible?
- —
Short-term bridge; refi at stabilization.
Listing history 17 events
-
2026-06-19days on market $59,000 Active 179 DOM
-
2026-06-18days on market $59,000 Active 178 DOM
-
2026-06-17days on market $59,000 Active 177 DOM
-
2026-06-16days on market $59,000 Active 176 DOM
-
2026-06-15days on market $59,000 Active 175 DOM
-
2026-06-14days on market $59,000 Active 173 DOM
-
2026-06-12days on market $59,000 Active 172 DOM
-
2026-06-09days on market $59,000 Active 169 DOM
-
2026-06-08days on market $59,000 Active 168 DOM
-
2026-06-07pricedays on market $59,000 Active 167 DOM
-
2026-06-03days on market $67,000 Active 163 DOM
-
2026-06-02days on market $67,000 Active 162 DOM
-
2026-06-01days on market $67,000 Active 161 DOM
-
2026-05-31days on market $67,000 Active 160 DOM
-
2026-05-30days on market $67,000 Active 159 DOM
-
2026-01-07price $67,000
-
2025-12-22$75,000 Active
ⓘ Source: listings_history table (triggers on properties + properties_extension) + one-shot
backfill from property_details.listing_events for pre-trigger history.
Climate risk First Street
- Flood 1/10 Low FEMA zone X (unshaded) · 0% chance over 30 yrs
- Wildfire 3/10 Moderate
- Heat 2/10 Low 7 d/yr ≥91°F today · 20 d/yr by 30 yrs out
- Wind 1/10 Low
- Air quality 1/10 Low 0 unhealthy d/yr today · 0 by 30 yrs out
Nearby sold comps map
Loading sold comps map…
Walkable amenities ~0.75 mi
Loading nearby amenities…
Taxation est. · year 1
- Rental income
- $10,225
- − Mortgage interest
- −$3,305
- − Property taxes
- −$885
- − Insurance
- −$295
- − Repairs & maintenance
- −$818
- − Management
- −$818
- − Depreciation
- −$1,716
- Taxable income
- $2,387
- Est. tax owed @ 24.0%
- −$573
- After-tax cash flow
- $2,612/yr
For passive investors: Depreciation is non-cash, so a rental often shows a tax loss while cash-flowing — sheltering income. Rental losses are passive: they offset passive income freely, and up to $25,000/yr can offset ordinary (W-2) income if you actively participate and your MAGI is under $100k (phasing out to $0 by $150k); unused losses carry forward. On sale, claimed depreciation is recaptured at up to 25%, and gains may owe capital-gains tax (a 1031 exchange can defer both). Figures are a year-1 estimate at your 24.0% rate — not tax advice; consult a CPA.
Schools (NCES district)
- District
- Raleigh County Schools
- NCES district ID
- 5401230
- Math proficiency
- 29% ▼ -8.00%
- Reading proficiency
- 42% ▼ -3.00%
- Median HH income
- $39,828
- Composite
- 29.74/100
- National rank
- #6445
- State rank
- #14 of 55 in WV
Livability — Sophia
- Score
- 57/100
- State rank
- #260
- US rank
- #22313
Category grades
Schools grade is shown separately in the Schools card above.
Census & demographics
- Census place
- Sophia, WV
- Population (ZIP)
- 2,820
Population outlook (Raleigh County) Hauer SSP2
- Today (2025)
- 73,505 people
- By 2030
- 70,954 · -3.5%
- By 2040
- 66,038 · -10.2%
- By 2050
- 61,919 · -15.8%
- By 2075
- 51,954 · -29.3%
- By 2100
- 39,724 · -46.0%
Race, ethnicity, and origin ACS 2023
- Neighborhood character
- Predominantly White (94%)
- Race & ethnicity
- White 94% Black 6%
- Common ancestry
- Serbian 2% Swiss 2% Portuguese 2%
- Foreign-born
- 2%
- Languages at home
- 99% English-only · Spanish 1%
Political lean MEDSL · Raleigh
- 2024 margin
- Solid R (+54.3) · D 22.0% · R 76.3% · Other 1.6%
- 2008→2024 swing
- -28.5pp toward R · 2008: -25.9pp · 2024: -54.3pp
- All cycles
- 2024: R+54.3 2020: R+50.4 2016: R+52.8 2012: R+44.6 2008: R+25.9
Not yet ingested
- Civics
- —
Market trends
- HPI YoY
- ▼ -0.86%
- Current HPI
- 285.3708
- Rent YoY
- —
- Metro
- —
- State GDP YoY
- —
- F500 in state
- 0
Price history
-10.7% since first listed2 events — show timeline
- 2026-01-07 Price Changed $67,000 BBOR
- 2025-12-22 Listed $75,000 BBOR
Cash-flow waterfall
monthlySold comps — $/sqft
last 12 mo · ≤1 miLoading sold comps…