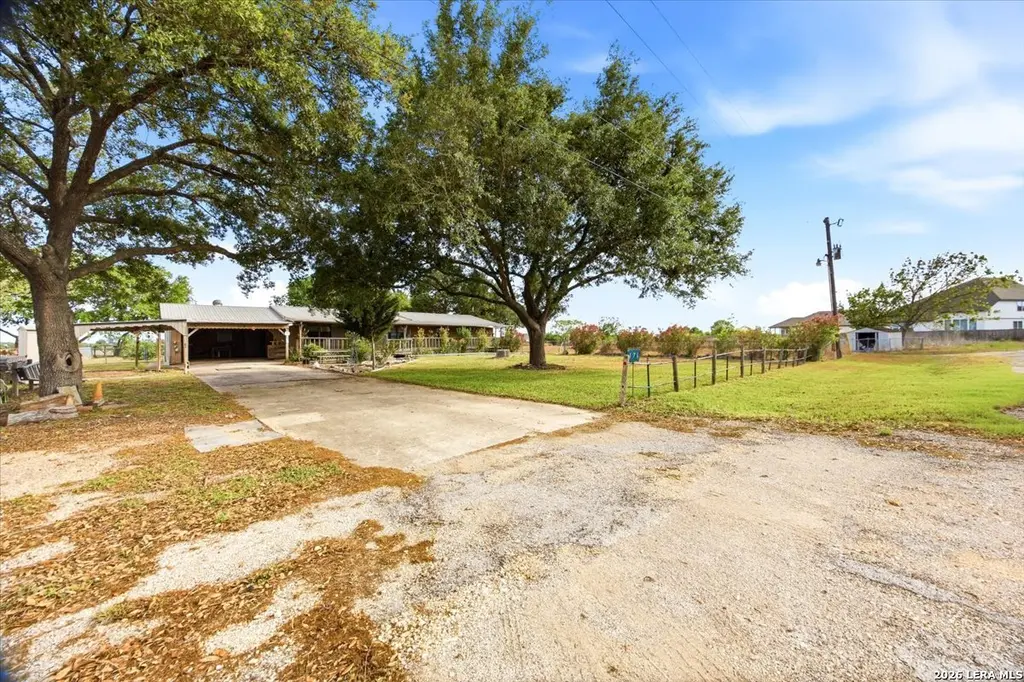
176 Golden Mdw · Cibolo, TX
Flood risk 1/10 · Minimal
- FEMA flood zone
- X (unshaded)
- Chance of flooding over 30 yrs
- 0.0%
- Est. flood insurance / yr
- $507 – $1,088
Fire risk 4/10 · Minor
- Est. fire insurance / yr
- $1,222 – $2,270
Heat risk 8/10 · Major
- Hot days now (above 109°F)
- 7 days/yr
- Hot days in 30 yrs
- 21 days/yr
Wind risk 8/10 · Major
- Chance of severe wind over 30 yrs
- 80.0%
Air-quality risk 1/10 · Minimal
- Unhealthy air days now
- 0 days/yr
- Unhealthy air days in 30 yrs
- 0 days/yr
Risk factors via First Street. Map © Google.
Why this score? — see what drove the B grade
The composite is a weighted blend of 9 inputs, each scored 0–100. Each bar is that input's sub-score; the figure is the points it added to the 100-point composite (weight × sub-score).
- Cash flow +30.0/30.0
- DSCR +10.0/10.0
- 1% rule +8.8/10.0
- ARV discount +7.5/15.0
- Appreciation +5.2/10.0
- Schools +4.0/10.0
- Livability +3.6/5.0
- Rent growth +3.1/5.0
- Condition / age +2.5/5.0
$155,000
🖨 Deal sheet 📄 Offer letter ✓ Due diligence
Listing remarks MLS
Welcome to 176 Golden Meadow! This home sits just minutes from the city and on a beautiful 1.011 acre lot! This is also the LOWEST priced home with land in this subdivision in the last 6 years! Settled down the road from Randolph AFB this property offers quick access to Loop 1604, I35 and I10. This is the perfect blend of country living and if you want to enjoy the city its just a quick drive down the road to San Antonio or New Braunfels! The backyard is completely fenced in with a covered patio. Interior layout is an open concept and split floor plan with plenty of space for entertaining or play time for your children. Home is being sold AS-IS.
Key facts
- 1.011 acre lot
- Covered patio
- Quick access to i35
Tags
Neighborhood map
What this means for you Summary
Snapshot
- This is a 3-bed/2.0-bath single-family listed at $155k.
Deal economics
- At list price, monthly cash flow is $654 ($8k/yr) — positive.
- The deal already cash-flows at list — no discount required.
- Meets the 1% rule at list price ($2k rent vs $155k).
- Recommended offer: $150k (3.0% below list) — sets the bar for market timing.
- Cap rate 11.4% vs local median 3.3% in Cibolo — top-decile yield for the area; either an underpriced asset or a hidden risk that comps aren't pricing in. Stress-test before assuming the spread holds.
Location & tenants
- Location reads 72/100 on livability (#261 in TX) — a middle-class / working-renter tenant base. Strengths: employment A+, housing A+, crime A; Watch: amenities F, commute F, health & safety F.
- Marion ISD (suburban): math 44% / reading 47% proficiency, ranked #243 of 826 in TX (top 29%) — families likely to look elsewhere, expect single-tenant / working-renter base with shorter leases.
- Market conditions: Rents rising (+2.4%/yr); 739 active listings in the ZIP; 4 comparable units currently listed for rent nearby; rentals at typical pace (median 24d on market — plan ~3-4 weeks tenant-placement turnaround); high-income renter base; 2,064 units permitted in Guadalupe County in 2024 (133 in 5+ unit buildings).
Forward outlook
- In year one you build about $2k of equity ($1k loan paydown + $729 appreciation (0.5% local appreciation)).
- Guadalupe County population projected at +61% by 2050 — long-run rental-demand tailwind backs the buy-and-hold thesis.
- At projected returns (0.5% appreciation + 2.4% rent growth), your $43k cash investment doubles in ~5 years — after that, you're playing with house money.
Negotiation context
- It's been on market 44 days — a 3% lower offer ($150k) is reasonable based on typical stale-listing flexibility.
- Current owner paid $50k; list at $155k implies a 210% gain — meaningful room to come down on a strong offer.
Risks & watch-outs
- Climate carrying-cost: severe wind risk, 80% chance of damaging wind over 30y; extreme-heat days projected 7→21/yr by 2055 (HVAC capex compounding) — expect insurance premiums to compound above CPI over the hold.
Questions for the listing agent
- It's been on market 44 days. Have you received any prior offers? Is the seller open to a 3% concession, seller financing, or rate buy-down credit?
- Is there a deadline driving the sale (1031 exchange, divorce, estate, relocation)? That informs how much negotiation room exists.
- Schools are B-rated — typically a magnet for longer-tenancy family renters. What's the average tenant stay here, and is there a school-zone premium baked into asking?
- What's the average days-on-market for RENTAL listings here right now (not sales)? A rising rental-DOM trend means longer vacancies and softer asking-rent achievability than the comps imply.
- What's the recent tenant-quality profile in this submarket — average credit score on applications, eviction rate, late-payment / NSF rate, and stable-employment percentage? A property-management company in the area should have these aggregated.
- How much new for-sale + rental construction is in the pipeline within 1–3 miles? Heavy new supply typically softens prices + rents 12–24 months out; constrained supply supports both.
Investment metrics
- 1% rule
- 1.38% ✓
- Cap rate
- 11.35%
- Cash-on-cash
- 18.08%
- DSCR
- 1.80
- GRM
- 6.0
CMA / ARV
- ARV (median comp)
- $365,654
- List price
- $155,000
- Delta
- -57.61%
- Verdict
- UNDERPRICED
- Comps
- 20 within 1.0 mi
Show comp detail 7 sales within ~0.75 mi
| Address | Dist | Beds/Ba | Sqft | Sold | Price | $/sf | Match |
|---|---|---|---|---|---|---|---|
| 139 Red Deer Pl | 0.28mi | 3/2.0 | 1,619 (-4%) | 9mo | $387,090 | $239 | 73 |
| 616 Mule Deer Grv | 0.31mi | 3/2.5 | 1,663 (-1%) | 21mo | $418,505 | $252 | 64 |
| 111 Red Deer | 0.33mi | 3/2.5 | 1,663 (-1%) | 23mo | $378,465 | $228 | 62 |
| 125 Sambar Main | 0.26mi | 4/3.0 (+1) | 1,788 (+6%) | 18mo | $329,890 | $185 | 54 |
| 219 Moose Trl | 0.36mi | 4/2.0 (+1) | 1,802 (+7%) | 16mo | $417,971 | $232 | 53 |
| 236 Stag Way | 0.26mi | 3/2.0 | 1,901 (+13%) | 18mo | $339,990 | $179 | 51 |
| 135 Red Deer Pl | 0.29mi | 4/2.0 (+1) | 1,802 (+7%) | 23mo | $400,689 | $222 | 50 |
Match score weights: distance 35% · size 25% · config 20% · recency 20%. Top-matched comps best support the ARV.
Projected returns pro-forma
0.47% appreciation · 2.42% rent growth · sell at horizon
- IRR
- 18.4%
- Equity multiple
- 1.91×
- Total profit
- $39,330
- Equity at exit
- $48,687
- IRR
- 21.8%
- Equity multiple
- 3.47×
- Total profit
- $107,194
- Equity at exit
- $61,548
Cash invested: $43,400 (down + closing). Projections, not guarantees.
Landlord ↔ Tenant lean methodology
- Overall (STATE)
- 87 Strongly Landlord-Friendly
- State Texas
- 87 Strongly Landlord-Friendly · R+5
- County
- — inherits STATE
- City
- — inherits STATE
ZIP-level market 78108
- Home prices YoY
- 0.3%
- Rents YoY
- 2.4%
- Active inventory
- 739
- Price-to-rent
- 6.0×
Monthly cashflow live
- Estimated rent
- $2,139 medium interval (Pro) →
- Mortgage (P&I)
- −$813
- Tax from tax record
- −$159 /mo · $1,903/yr
- Insurance
- −$65
- HOA
- −$0
- Vacancy / Maint / Mgmt
- −$449
- Net cashflow
- $654
Break-even live
UW: 25.0% down · 7.5% · 30yr · 1.5% tax · 5.0% vac · 8.0% maint · 8.0% mgmt
Financing live
Cash to close
- Down payment
- $38,750
- Closing costs
- $4,650
- Reserves months
- —
- Total cash needed
- —
Loan-product check · same deal, 3 products live
Conventional
25% down · 7.5% · 30yr
- Down + closing
- —
- Monthly P&I
- —
- Monthly cashflow
- —
- DSCR
- —
- Eligible?
- —
Personal DTI + credit; lowest rate.
DSCR
20% down · 8.5% · 30yr
- Down + closing
- —
- Monthly P&I
- —
- Monthly cashflow
- —
- DSCR
- —
- Eligible?
- —
No personal income docs; deal must DSCR.
Hard money
10% down · 12.0% · 12mo
- Down + closing
- —
- Monthly P&I
- —
- Monthly cashflow
- —
- DSCR
- —
- Eligible?
- —
Short-term bridge; refi at stabilization.
Rent comps 4 comps
| Address | Beds | Baths | Sqft | Rent | $/sqft | DOM | Units | Dist |
|---|---|---|---|---|---|---|---|---|
| 148 Sambar Main Schertz, TX | 4.0 | 2.5 | 1868 | $2,100 | $1.12 | 1d | 1 | 0.24mi |
| 405 Sika Way Schertz, TX | 3.0 | 2.0 | 2002 | $2,150 | $1.07 | 1d | 1 | 0.35mi |
| 112 Stag Way Schertz, TX | 4.0 | 2.0 | 1950 | $2,150 | $1.10 | 43d | 1 | 0.39mi |
| 125 Clinton Rd Cibolo, TX | 2.0–3.0 | 2.0 | 1056 | $1,235 | $1.17 | 23d | 3 | 1.48mi |
Listing history 4 events
-
2026-04-13$155,000 New 653-char remark
Show marketing remark (653 chars)
Welcome to 176 Golden Meadow! This home sits just minutes from the city and on a beautiful 1.011 acre lot! This is also the LOWEST priced home with land in this subdivision in the last 6 years! Settled down the road from Randolph AFB this property offers quick access to Loop 1604, I35 and I10. This is the perfect blend of country living and if you want to enjoy the city its just a quick drive down the road to San Antonio or New Braunfels! The backyard is completely fenced in with a covered patio. Interior layout is an open concept and split floor plan with plenty of space for entertaining or play time for your children. Home is being sold AS-IS.
-
2025-12-30soldstatus
-
2004-01-30soldstatus $50,000
-
1988-09-13soldstatus
ⓘ Source: listings_history table (triggers on properties + properties_extension) + one-shot
backfill from property_details.listing_events for pre-trigger history.
Tax reassessment forecast TX · Resets to sale price
- Current annual tax
- $1,903 · $159/mo
- Projected year-2 tax
- $2,836 · $236/mo
- Expected delta
- +$933/yr (+$78/mo · 49.0%)
ⓘ Screening estimate from a state-policy table — verify with the county assessor before closing.
Climate risk First Street
- Flood 1/10 Low FEMA zone X (unshaded) · 0% chance over 30 yrs
- Wildfire 4/10 Moderate
- Heat 8/10 Severe 7 d/yr ≥109°F today · 21 d/yr by 30 yrs out
- Wind 8/10 Severe 80% chance of damaging wind over 30 yrs
- Air quality 1/10 Low 0 unhealthy d/yr today · 0 by 30 yrs out
Nearby sold comps map
Loading sold comps map…
Walkable amenities ~0.75 mi
Loading nearby amenities…
Taxation est. · year 1
- Rental income
- $25,667
- − Mortgage interest
- −$8,682
- − Property taxes
- −$1,903
- − Insurance
- −$775
- − Repairs & maintenance
- −$2,053
- − Management
- −$2,053
- − Depreciation
- −$4,509
- Taxable income
- $5,691
- Est. tax owed @ 24.0%
- −$1,366
- After-tax cash flow
- $6,479/yr
For passive investors: Depreciation is non-cash, so a rental often shows a tax loss while cash-flowing — sheltering income. Rental losses are passive: they offset passive income freely, and up to $25,000/yr can offset ordinary (W-2) income if you actively participate and your MAGI is under $100k (phasing out to $0 by $150k); unused losses carry forward. On sale, claimed depreciation is recaptured at up to 25%, and gains may owe capital-gains tax (a 1031 exchange can defer both). Figures are a year-1 estimate at your 24.0% rate — not tax advice; consult a CPA.
Schools (NCES district)
- District
- Marion ISD
- NCES district ID
- 4829100
- Math proficiency
- 44% ▼ -10.00%
- Reading proficiency
- 47% ▼ -4.00%
- Median HH income
- $58,465
- Composite
- 39.86/100
- National rank
- #3867
- State rank
- #243 of 826 in TX
Livability — Cibolo
- Score
- 72/100
- State rank
- #261
- US rank
- #6177
Category grades
Schools grade is shown separately in the Schools card above.
Census & demographics
- County
- Guadalupe County · 147,291 people
- City population
- 49,784
- Metro
- San Antonio-New Braunfels, TX
- Population (ZIP)
- 49,784
- Household income
- $113,004
- Rent vs Own
- Severe rent burden
- 521.0
Population outlook (Guadalupe County) Hauer SSP2
- Today (2025)
- 196,854 people
- By 2030
- 220,210 · +11.9%
- By 2040
- 268,004 · +36.1%
- By 2050
- 316,333 · +60.7%
- By 2075
- 434,747 · +120.8%
- By 2100
- 520,447 · +164.4%
Race, ethnicity, and origin ACS 2023
- Neighborhood character
- Diverse neighborhood (Simpson 0.68)
- Race & ethnicity
- White 46% Hispanic / Latino 30% Two or more races 22% Black 13% Asian 3%
- Hispanic origin (detail)
- Mexican 22% Puerto Rican 4%
- Common ancestry
- Italian 2% Lithuanian 2% Slovak 2%
- Foreign-born
- 7% · Canada, Vietnam, China
- Languages at home
- 83% English-only · Spanish 13% Vietnamese 1% German/W. Germanic 1%
Political lean MEDSL · Guadalupe
- 2024 margin
- Strong R (+29.5) · D 34.8% · R 64.3%
- 2008→2024 swing
- +1.5pp toward D · 2008: -31.0pp · 2024: -29.5pp
- All cycles
- 2024: R+29.5 2020: R+24.2 2016: R+31.8 2012: R+35.1 2008: R+31.0
Not yet ingested
- Civics
- —
Market trends
- HPI YoY
- ▲ 0.47%
- Current HPI
- 182.7296
- Rent YoY
- ▲ 2.42%
- Metro
- San Antonio-New Braunfels, TX
- State GDP YoY
- ▲ 3.95%
- F500 in state
- 110
Industry mix (Fortune 500 HQ in TX)
| Industry | F500 HQs | Revenue |
|---|---|---|
| Energy | 16 | $1,198B |
|
||
| Technology | 5 | $198B |
|
||
| Engineering / Construction | 4 | $72B |
|
||
| Energy Services | 3 | $60B |
|
||
| Utilities | 3 | $41B |
|
||
| Healthcare | 2 | $330B |
|
||
Price history
+210.0% since first listed4 events — show timeline
- 2026-04-13 Listed $155,000 LERA
- 2025-12-30 Sold (Public Records) — Public Records
- 2004-01-30 Sold (Public Records) $50,000 Public Records
- 1988-09-13 Sold (Public Records) — Public Records
Property tax history
+18.6%/yrLatest (2026): $1,903 · +206.6% YoY. Source: county tax records.
Cash-flow waterfall
monthlySold comps — $/sqft
last 12 mo · ≤1 miLoading sold comps…