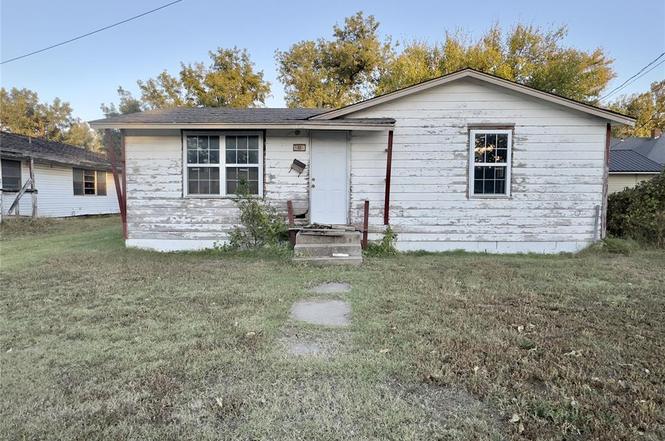
210 N Byers Ave · Mangum, OK
Flood risk 1/10 · Minimal
- FEMA flood zone
- X (unshaded)
- Chance of flooding over 30 yrs
- 0.0%
- Est. flood insurance / yr
- $507 – $1,088
Fire risk 5/10 · Moderate
- Est. fire insurance / yr
- $2,463 – $4,575
Heat risk 6/10 · Moderate
- Hot days now (above 108°F)
- 7 days/yr
- Hot days in 30 yrs
- 20 days/yr
Wind risk 2/10 · Minimal
- Chance of severe wind over 30 yrs
- 3.0%
Air-quality risk 1/10 · Minimal
- Unhealthy air days now
- 0 days/yr
- Unhealthy air days in 30 yrs
- 0 days/yr
Risk factors via First Street. Map © Google.
Why this score? — see what drove the D+ grade
The composite is a weighted blend of 9 inputs, each scored 0–100. Each bar is that input's sub-score; the figure is the points it added to the 100-point composite (weight × sub-score).
- Cash flow +15.0/30.0
- ARV discount +7.5/15.0
- 1% rule +5.0/10.0
- DSCR +5.0/10.0
- Appreciation +3.8/10.0
- Livability +3.2/5.0
- Rent growth +2.5/5.0
- Condition / age +2.5/5.0
- Schools +2.3/10.0
$15,000
🖨 Deal sheet 📄 Offer letter ✓ Due diligence
Listing remarks
Here is your opportunity to own 2 homes for the price of 1. Only one home shows on the tax records but there is a carport and 2nd home behind that is the identical floor plan. Both have been gutted and under construction and ready for the new owner to come in and take over. Seller has installed newer windows on both homes, Central heat and air units are included with purchase but not installed. All roofing materials were removed and replaced on both homes in 2019. These homes would make a great rental investment ! Can also buy 418 W Filmore St on the same property if you are interested in a true compound or a multi-family or multi-generational dwelling.
Key facts
- Newer windows
- 4,900 sq ft lot
- Built 1940
Tags
Property features AI
Finance
- Other: Property located in Dodson addition; No storm shelter; Not homesteaded; Lot size approximately 0.1125 acres; Directions: Corner of Byers Avenue and Filmore Street in Mangum, OK
- Financial info: Not assumable; Not qualifying for listed loan option
- HOA & community: No mandatory association dues
Exterior
- Home design: One-level single family residence; Faces west; Residential property; Existing property
- Construction: Composition roof (replaced/installed in 2019); Other construction materials; Conventional foundation
- Exterior features: Accessory dwelling unit; Interior lot
Interior
- Bedrooms: 2 bedrooms
- Bathrooms: 1 full bathroom
- Interior features: One living area; No fireplace; No study; Not an in-law plan
Neighborhood map
What this means for you Summary
Snapshot
- This is a 2-bed/1.0-bath single-family listed at $15k.
Deal economics
- At list price, monthly cash flow is $550 ($7k/yr) — positive.
- The deal already cash-flows at list — no discount required.
- Meets the 1% rule at list price ($807 rent vs $15k).
- Recommended offer: $13k (12.0% below list) — sets the bar for market timing.
- Cap rate 50.3% vs local median 7.8% in Mangum — top-decile yield for the area; either an underpriced asset or a hidden risk that comps aren't pricing in. Stress-test before assuming the spread holds.
Location & tenants
- Location reads 65/100 on livability (#144 in OK) — a middle-class / working-renter tenant base. Strengths: cost of living A+, housing A+, crime A-; Watch: amenities F, commute F, employment F.
- Mangum (town): math 27% / reading 28% proficiency, ranked #89 of 270 in OK (top 33%) — low school quality limits family demand, transient renter base, plan for 1-2y turnover.
- Zoned schools: Edison Es (math 47% / reading 32%, grade F, #107 of 845 statewide, top 14%, 239 students, 0% FRL); Mangum Hs (math 15% / reading 24%, grade F, #274 of 447 statewide, top 66%, 175 students, 0% FRL) — zoned schools average 0% FRL vs 56% district-wide (56 pts lower); this property's tenant base skews higher-income than the district average.
- Market conditions: 45 active listings in the ZIP.
Forward outlook
- Local home prices are declining (-2.5%/yr); year-one equity from $104 of loan paydown is wiped out by about $368 of value loss. Plan a longer hold.
- Greer County population projected to shrink 3% by 2050 — rents likely to lag national; underwrite the cash flow, not the appreciation.
- At projected returns (-2.5% appreciation + 3.0% rent growth), your $4k cash investment doubles in ~1 year — after that, you're playing with house money.
Negotiation context
- It's been on market 188 days — a 12% lower offer ($13k) is reasonable based on typical stale-listing flexibility.
- 2 sale attempts; this cycle's ask has dropped $45k (75%) from the opening price — seller is motivated, your offer sets the floor, not the list.
Risks & watch-outs
- Watch-outs: built in 1940 — expect roof / HVAC / electrical / plumbing capex.
- Climate carrying-cost: moderate wildfire risk; extreme-heat days projected 7→20/yr by 2055 (HVAC capex compounding) — expect insurance premiums to compound above CPI over the hold.
Questions for the listing agent
- It's been on market 188 days. Have you received any prior offers? Is the seller open to a 12% concession, seller financing, or rate buy-down credit?
- Built in 1940 — when were the roof, HVAC, electrical panel, plumbing, and water heater last replaced?
- Why hasn't it sold? Are there any deal-killer items the seller is aware of (foundation, flood, title, zoning, code violations)?
- Is there a deadline driving the sale (1031 exchange, divorce, estate, relocation)? That informs how much negotiation room exists.
- The area grade is low — what's the realistic commute time and amenity access for the typical tenant pool here? Any planned neighborhood developments (good or bad) we should know about?
- What's the average days-on-market for RENTAL listings here right now (not sales)? A rising rental-DOM trend means longer vacancies and softer asking-rent achievability than the comps imply.
- What's the recent tenant-quality profile in this submarket — average credit score on applications, eviction rate, late-payment / NSF rate, and stable-employment percentage? A property-management company in the area should have these aggregated.
- How much new for-sale + rental construction is in the pipeline within 1–3 miles? Heavy new supply typically softens prices + rents 12–24 months out; constrained supply supports both.
Investment metrics
- 1% rule
- 5.38% ✓
- Cap rate
- 50.27%
- Cash-on-cash
- 157.04%
- DSCR
- 7.99
- GRM
- 1.5
CMA / ARV
- ARV (on-the-fly)
- $38,896
- Comps found
- 2
Show comp detail 2 sales within ~0.75 mi
| Address | Dist | Beds/Ba | Sqft | Sold | Price | $/sf | Match |
|---|---|---|---|---|---|---|---|
| 315 N Hardin St | 0.13mi | 2/1.0 | 704 (-6%) | 10mo | $17,000 | $24 | 76 |
| 118 N Louisiana Ave | 0.59mi | 2/1.0 | 670 (-10%) | 14mo | $35,000 | $52 | 44 |
Match score weights: distance 35% · size 25% · config 20% · recency 20%. Top-matched comps best support the ARV.
Projected returns pro-forma
-2.45% appreciation · 3.0% rent growth · sell at horizon
- IRR
- —
- Equity multiple
- 8.84×
- Total profit
- $32,924
- Equity at exit
- $2,603
- IRR
- —
- Equity multiple
- 18.63×
- Total profit
- $74,058
- Equity at exit
- $1,935
Cash invested: $4,200 (down + closing). Projections, not guarantees.
Landlord ↔ Tenant lean methodology
- Overall (STATE)
- 83 Strongly Landlord-Friendly
- State Oklahoma
- 83 Strongly Landlord-Friendly · R+20
- County
- — inherits STATE
- City
- — inherits STATE
ZIP-level market 73554
- Home prices YoY
- -2.7%
- Active inventory
- 45
- Price-to-rent
- 1.5×
Monthly cashflow live
- Estimated rent
- $807 medium interval (Pro) →
- Mortgage (P&I)
- −$79
- Tax from tax record
- −$3 /mo · $37/yr
- Insurance
- −$6
- HOA
- −$0
- Vacancy / Maint / Mgmt
- −$170
- Net cashflow
- $550
Break-even live
UW: 25.0% down · 7.5% · 30yr · 1.5% tax · 5.0% vac · 8.0% maint · 8.0% mgmt
Financing live
Cash to close
- Down payment
- $3,750
- Closing costs
- $450
- Reserves months
- —
- Total cash needed
- —
Loan-product check · same deal, 3 products live
Conventional
25% down · 7.5% · 30yr
- Down + closing
- —
- Monthly P&I
- —
- Monthly cashflow
- —
- DSCR
- —
- Eligible?
- —
Personal DTI + credit; lowest rate.
DSCR
20% down · 8.5% · 30yr
- Down + closing
- —
- Monthly P&I
- —
- Monthly cashflow
- —
- DSCR
- —
- Eligible?
- —
No personal income docs; deal must DSCR.
Hard money
10% down · 12.0% · 12mo
- Down + closing
- —
- Monthly P&I
- —
- Monthly cashflow
- —
- DSCR
- —
- Eligible?
- —
Short-term bridge; refi at stabilization.
Listing history 18 events
-
2026-06-18days on market $15,000 Active 188 DOM
-
2026-06-17days on market $15,000 Active 187 DOM
-
2026-06-16days on market $15,000 Active 186 DOM
-
2026-06-15days on market $15,000 Active 185 DOM
-
2026-06-13days on market $15,000 Active 183 DOM
-
2026-06-12days on market $15,000 Active 182 DOM
-
2026-06-09days on market $15,000 Active 179 DOM
-
2026-06-08days on market $15,000 Active 178 DOM
-
2026-06-08days on market $15,000 Active 177 DOM
-
2026-06-07days on market $15,000 Active 176 DOM
-
2026-06-04pricedays on market $15,000 Active 173 DOM
-
2026-06-02days on market $39,000 Active 172 DOM
-
2026-06-01days on market $39,000 Active 171 DOM
-
2026-05-31days on market $39,000 Active 170 DOM
-
2026-03-09status Active
-
2026-03-01status Pending
-
2026-02-28price $39,000
-
2025-12-04$60,000 Active
ⓘ Source: listings_history table (triggers on properties + properties_extension) + one-shot
backfill from property_details.listing_events for pre-trigger history.
Tax reassessment forecast OK · Resets to sale price
- Current annual tax
- $37 · $3/mo
- Projected year-2 tax
- $135 · $11/mo
- Expected delta
- +$98/yr (+$8/mo · 264.9%)
ⓘ Screening estimate from a state-policy table — verify with the county assessor before closing.
Climate risk First Street
- Flood 1/10 Low FEMA zone X (unshaded) · 0% chance over 30 yrs
- Wildfire 5/10 Major
- Heat 6/10 Major 7 d/yr ≥108°F today · 20 d/yr by 30 yrs out
- Wind 2/10 Low 3% chance of damaging wind over 30 yrs
- Air quality 1/10 Low 0 unhealthy d/yr today · 0 by 30 yrs out
Nearby sold comps map
Loading sold comps map…
Walkable amenities ~0.75 mi
Loading nearby amenities…
Taxation est. · year 1
- Rental income
- $9,686
- − Mortgage interest
- −$840
- − Property taxes
- −$37
- − Insurance
- −$75
- − Repairs & maintenance
- −$775
- − Management
- −$775
- − Depreciation
- −$436
- Taxable income
- $6,747
- Est. tax owed @ 24.0%
- −$1,619
- After-tax cash flow
- $4,976/yr
For passive investors: Depreciation is non-cash, so a rental often shows a tax loss while cash-flowing — sheltering income. Rental losses are passive: they offset passive income freely, and up to $25,000/yr can offset ordinary (W-2) income if you actively participate and your MAGI is under $100k (phasing out to $0 by $150k); unused losses carry forward. On sale, claimed depreciation is recaptured at up to 25%, and gains may owe capital-gains tax (a 1031 exchange can defer both). Figures are a year-1 estimate at your 24.0% rate — not tax advice; consult a CPA.
Schools (NCES district)
- District
- Mangum
- NCES district ID
- 4018780
- Math proficiency
- 27% ▼ -18.00%
- Reading proficiency
- 28% ▼ -15.00%
- Median HH income
- $36,568
- Composite
- 22.85/100
- National rank
- #8012
- State rank
- #89 of 270 in OK
Livability — Mangum
- Score
- 65/100
- State rank
- #144
- US rank
- #13248
Category grades
Schools grade is shown separately in the Schools card above.
Census & demographics
- Census place
- Mangum, OK
- Population (ZIP)
- 3,361
Population outlook (Greer County) Hauer SSP2
- Today (2025)
- 5,904 people
- By 2030
- 5,869 · -0.6%
- By 2040
- 5,790 · -1.9%
- By 2050
- 5,712 · -3.3%
- By 2075
- 5,196 · -12.0%
- By 2100
- 4,326 · -26.7%
Race, ethnicity, and origin ACS 2023
- Neighborhood character
- Predominantly White (75%)
- Race & ethnicity
- White 75% Hispanic / Latino 15% Two or more races 8% Black 3% Native American 1%
- Hispanic origin (detail)
- Mexican 14%
- Common ancestry
- Iranian 2% Serbian 2% Slovak 1%
- Foreign-born
- 1% · China, Canada
- Languages at home
- 94% English-only · Spanish 5%
Political lean MEDSL · Greer
- 2024 margin
- Solid R (+65.7) · D 16.6% · R 82.3% · Other 1.1%
- 2008→2024 swing
- -19.3pp toward R · 2008: -46.5pp · 2024: -65.7pp
- All cycles
- 2024: R+65.7 2020: R+64.7 2016: R+61.1 2012: R+46.7 2008: R+46.5
Not yet ingested
- Civics
- —
Market trends
- HPI YoY
- ▼ -2.45%
- Current HPI
- 88.9252
- Rent YoY
- —
- Metro
- —
- State GDP YoY
- ▲ 1.55%
- F500 in state
- 6
Industry mix (Fortune 500 HQ in OK)
| Industry | F500 HQs | Revenue |
|---|---|---|
| Energy | 3 | $48B |
|
||
Price history
-35.0% since first listed4 events — show timeline
- 2026-03-09 Relisted — MLSOK
- 2026-03-01 Pending — MLSOK
- 2026-02-28 Price Changed $39,000 MLSOK
- 2025-12-04 Listed $60,000 MLSOK
Property tax history
-11.4%/yrLatest (2025): $37 · +2.8% YoY. Source: county tax records.
Cash-flow waterfall
monthlySold comps — $/sqft
last 12 mo · ≤1 miLoading sold comps…