000 SW Deer Rdg Lot 52, 60, 61, 62 · Osceola, MO
Flood risk 1/10 · Minimal
- FEMA flood zone
- —
- Chance of flooding over 30 yrs
- 0.0%
- Est. flood insurance / yr
- —
Fire risk 3/10 · Minor
- Est. fire insurance / yr
- $1,054 – $1,958
Heat risk 4/10 · Minor
- Hot days now (above 107°F)
- 7 days/yr
- Hot days in 30 yrs
- 17 days/yr
Wind risk 2/10 · Minimal
- Chance of severe wind over 30 yrs
- 1.0%
Air-quality risk 2/10 · Minimal
- Unhealthy air days now
- 1 days/yr
- Unhealthy air days in 30 yrs
- 2 days/yr
Risk factors via First Street. Map © Google.
Why this score? — see what drove the B+ grade
The composite is a weighted blend of 9 inputs, each scored 0–100. Each bar is that input's sub-score; the figure is the points it added to the 100-point composite (weight × sub-score).
- Cash flow +30.0/30.0
- 1% rule +10.0/10.0
- DSCR +10.0/10.0
- ARV discount +7.5/15.0
- Appreciation +7.4/10.0
- Schools +3.7/10.0
- Livability +3.1/5.0
- Rent growth +2.5/5.0
- Condition / age +2.2/5.0
$40,000
🖨 Deal sheet (PDF) 📄 Offer letter ✓ Due diligence
Listing remarks
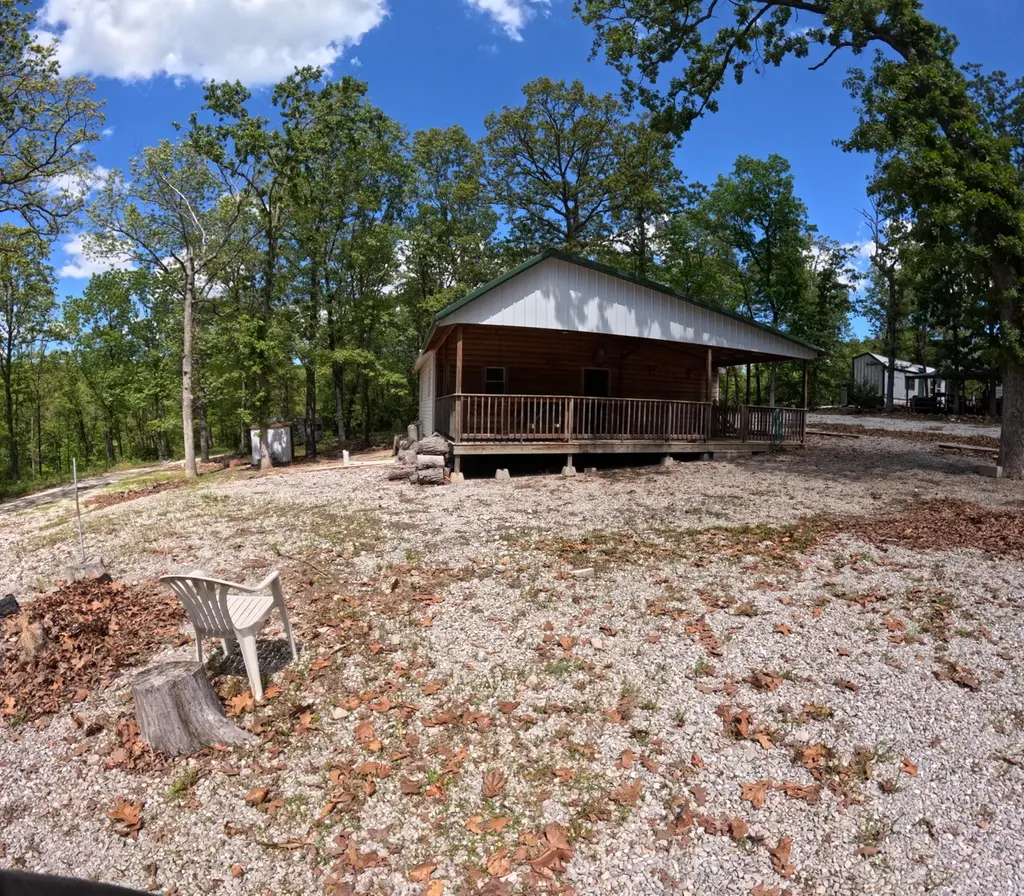
* * Charming Cabin Retreat in Twin Oaks Harbor - Lowry City, MO * * Escape to the lake life with this cozy 2-bedroom, 1-bath cabin nestled on a . 24-acre lot in the desirable Twin Oaks Harbor community! If you're looking for a weekend getaway this property offers the perfect blend of comfort and convenience. Step inside to find a warm and inviting living space with a rustic cabin feel, ideal for relaxing after a day on the water. The functional layout includes two comfortable bedrooms and a full bath, making great use of the space for family and guests. Outside, enjoy the spacious yard with plenty of room for outdoor entertaining, campfires, or simply soaking in the quiet surroundings. Lo
Key facts
- 0.24 acre lot
- Built 1996
- Listed 33 days
Property features AI
Finance
- Other: Listing broker: United Country Buckhorn Land and Realty LLC
- Financial info: Tax information available (amounts not included per instructions)
- HOA & community: Homeowners association with an annual fee of $431 (about $35.92/month)
Exterior
- Parking: Parking details not specified
- Security: Security details not specified
- Utilities: Propane service; Septic tank
- Home design: Single-family residence; One story
- Construction: Construction details not specified; Above-grade finished area: 850
- Exterior features: Approximately 0.24-acre lot; Subdivision: Saint Clair-Not in List; Directions: From Lowry City turn east on C Hwy roughly 6 miles to Twin Oaks Harbor; turn in, take first road on the left, head east to Four Winds, turn right, go less than a quarter mile — property sits on the right on Deer Ridge.
Interior
- Kitchen: Appliances not specified
- Bedrooms: Bedrooms not specified
- Flooring: Flooring details not specified
- Bathrooms: 1 full bathroom
- Heating & cooling: Electric heating; Space heater; Window and wall cooling units
- Interior features: One-level layout
- Laundry & utility: Laundry details not specified
Neighborhood map
What this means for you Summary
Snapshot
- This is a 2-bed/1.0-bath single-family listed at $40k. Condition is rated fair.
Deal economics
- At list price, monthly cash flow is $362 ($4k/yr) — positive.
- The deal already cash-flows at list — no discount required.
- Meets the 1% rule at list price ($854 rent vs $40k).
- Recommended offer: $39k (3.0% below list) — sets the bar for market timing.
Location & tenants
- Location reads 61/100 on livability (#432 in MO) — a middle-class / working-renter tenant base. Strengths: cost of living A+, housing A+, crime A-; Watch: amenities F, commute F, employment F.
- Osceola (rural): math 46% / reading 45% proficiency, ranked #105 of 324 in MO (top 32%) — families likely to look elsewhere, expect single-tenant / working-renter base with shorter leases.
- Zoned schools: Osceola Elem. (math 57% / reading 47%, grade C-, #231 of 1,115 statewide, top 24%, 304 students, 50% FRL); Osceola Jr.-Sr. High (math 37% / reading 42%, grade F, #247 of 521 statewide, top 55%, 249 students, 57% FRL) — zoned schools at 54% FRL track the district average.
- Market conditions: 8 active listings in the ZIP; 3 units permitted in St. Clair County in 2024 (0 in 5+ unit buildings).
Forward outlook
- In year one you build about $2k of equity ($277 loan paydown + $2k appreciation (4.8% local appreciation)).
- St. Clair County population projected at -22% by 2050 — secular population decline; favor cash flow + early exit over multi-decade hold.
- At projected returns (4.8% appreciation + 3.0% rent growth), your $11k cash investment doubles in ~2 years — after that, you're playing with house money.
Negotiation context
- It's been on market 33 days — a 3% lower offer ($39k) is reasonable based on typical stale-listing flexibility.
- 2 sale attempts; this cycle's ask has dropped $5k (11%) from the opening price — seller is motivated, your offer sets the floor, not the list.
Questions for the listing agent
- It's been on market 33 days. Have you received any prior offers? Is the seller open to a 3% concession, seller financing, or rate buy-down credit?
- Have any recent inspections been done? Can we get a copy of the seller's disclosures and any deferred-maintenance estimates?
- What does the HOA fee cover, when was the last increase, and are there any pending special assessments or reserve-fund shortfalls?
- Is there a deadline driving the sale (1031 exchange, divorce, estate, relocation)? That informs how much negotiation room exists.
- Schools are F-rated, which usually means shorter tenancies and higher turnover. Who's the typical renter profile here, and what's been the actual vacancy rate?
- What's the average days-on-market for RENTAL listings here right now (not sales)? A rising rental-DOM trend means longer vacancies and softer asking-rent achievability than the comps imply.
- What's the recent tenant-quality profile in this submarket — average credit score on applications, eviction rate, late-payment / NSF rate, and stable-employment percentage? A property-management company in the area should have these aggregated.
- How much new for-sale + rental construction is in the pipeline within 1–3 miles? Heavy new supply typically softens prices + rents 12–24 months out; constrained supply supports both.
Investment metrics
- 1% rule
- 2.13% ✓
- Cap rate
- 17.15%
- Cash-on-cash
- 38.79%
- DSCR
- 2.73
- GRM
- 3.9
CMA / ARV
- ARV (median comp)
- $165,853
- List price
- $40,000
- Delta
- -75.88%
- Verdict
- UNDERPRICED
- Comps
- 2 within 2.0 mi
Show comp detail 1 sale within ~0.75 mi
| Address | Dist | Beds/Ba | Sqft | Sold | Price | $/sf | Match |
|---|---|---|---|---|---|---|---|
| 000 SW Deer Rdg Lot 52, 60, 61, 62 | 0.00mi | 2/1.0 | 850 (0%) | 0mo | $40,000 | $47 | 100 |
Match score weights: distance 35% · size 25% · config 20% · recency 20%. Top-matched comps best support the ARV.
Projected returns pro-forma
4.83% appreciation · 3.0% rent growth · sell at horizon
- IRR
- 47.0%
- Equity multiple
- 3.85×
- Total profit
- $31,928
- Equity at exit
- $22,256
- IRR
- 45.0%
- Equity multiple
- 7.86×
- Total profit
- $76,842
- Equity at exit
- $38,075
Cash invested: $11,200 (down + closing). Projections, not guarantees.
Landlord ↔ Tenant lean methodology
- Overall (STATE)
- 81 Strongly Landlord-Friendly
- State Missouri
- 81 Strongly Landlord-Friendly · R+10
- County
- — inherits STATE
- City
- — inherits STATE
ZIP-level market 64763
- Home prices YoY
- 2.4%
- Active inventory
- 8
- Price-to-rent
- 3.9×
Monthly cashflow live
- Estimated rent
- $854 medium interval (Pro) →
- Mortgage (P&I)
- −$210
- Tax est. 1.5%
- −$50 /mo · $600/yr
- Insurance
- −$17
- HOA
- −$36
- Vacancy / Maint / Mgmt
- −$179
- Net cashflow
- $362
Break-even live
Sensitivity live
| Price | -10% $390 | -5% $376 | +0% $362 | +5% $348 | +10% $334 |
|---|---|---|---|---|---|
| Rent | -10% $295 | -5% $328 | +0% $362 | +5% $396 | +10% $430 |
| Rate | -1.0pp $382 | -0.5pp $372 | base $362 | +0.5pp $352 | +1.0pp $341 |
UW: 25.0% down · 7.5% · 30yr · 1.5% tax · 5.0% vac · 8.0% maint · 8.0% mgmt
Financing live
Cash to close
- Down payment
- $10,000
- Closing costs
- $1,200
- Reserves months
- —
- Total cash needed
- —
Loan-product check · same deal, 3 products live
Conventional
25% down · 7.5% · 30yr
- Down + closing
- —
- Monthly P&I
- —
- Monthly cashflow
- —
- DSCR
- —
- Eligible?
- —
Personal DTI + credit; lowest rate.
DSCR
20% down · 8.5% · 30yr
- Down + closing
- —
- Monthly P&I
- —
- Monthly cashflow
- —
- DSCR
- —
- Eligible?
- —
No personal income docs; deal must DSCR.
Hard money
10% down · 12.0% · 12mo
- Down + closing
- —
- Monthly P&I
- —
- Monthly cashflow
- —
- DSCR
- —
- Eligible?
- —
Short-term bridge; refi at stabilization.
HOA detail
- Monthly dues
- $36 · $432/yr
- Likely covers
- water
Listing history 8 events
-
2026-06-07statusdays on market $40,000 Pending 33 DOM
-
2026-06-04days on market $40,000 Active 32 DOM
-
2026-06-02days on market $40,000 Active 31 DOM
-
2026-06-01days on market $40,000 Active 30 DOM
-
2026-05-31days on market $40,000 Active 29 DOM
-
2026-05-12status Active 1125-char remark
-
2026-05-07status Pending 1125-char remark
-
2026-04-27$45,000 Active 1125-char remark
ⓘ Source: listings_history table (triggers on properties + properties_extension) + one-shot
backfill from property_details.listing_events for pre-trigger history.
Climate risk First Street
- Flood 1/10 Low 0% chance over 30 yrs
- Wildfire 3/10 Moderate
- Heat 4/10 Moderate 7 d/yr ≥107°F today · 17 d/yr by 30 yrs out
- Wind 2/10 Low 100% chance of damaging wind over 30 yrs
- Air quality 2/10 Low 1 unhealthy d/yr today · 2 by 30 yrs out
Nearby sold comps map
Loading sold comps map…
Walkable amenities ~0.75 mi
Loading nearby amenities…
Taxation est. · year 1
- Rental income
- $10,245
- − Mortgage interest
- −$2,241
- − Property taxes
- −$600
- − Insurance
- −$200
- − Repairs & maintenance
- −$820
- − Management
- −$820
- − HOA
- −$432
- − Depreciation
- −$1,164
- Taxable income
- $3,970
- Est. tax owed @ 24.0%
- −$953
- After-tax cash flow
- $3,392/yr
For passive investors: Depreciation is non-cash, so a rental often shows a tax loss while cash-flowing — sheltering income. Rental losses are passive: they offset passive income freely, and up to $25,000/yr can offset ordinary (W-2) income if you actively participate and your MAGI is under $100k (phasing out to $0 by $150k); unused losses carry forward. On sale, claimed depreciation is recaptured at up to 25%, and gains may owe capital-gains tax (a 1031 exchange can defer both). Figures are a year-1 estimate at your 24.0% rate — not tax advice; consult a CPA.
Condition & rehab AI · 13 photos
The property is in fair condition with moderate repairs and maintenance needed. Improvements in painting, landscaping, and roof inspection can significantly enhance its value.
Repairs flagged
- Moderate Exterior siding — Weathered appearance suggests potential water damage.
- Moderate Paint — Interior walls show signs of wear and may need repainting.
- Moderate Landscaping — Minimal landscaping detracts from curb appeal and could be improved with some landscaping work.
Value-add opportunities
- Both Paint interior walls — Fresh paint can improve the overall appearance and value of the home.
- Both Landscaping — Improved landscaping can enhance curb appeal and attract potential buyers.
- Both Roof inspection — Ensuring the roof is in good condition can prevent costly repairs and improve the home's value.
- Both HVAC maintenance — A well-maintained HVAC system can improve comfort and energy efficiency, enhancing both resale and rental value.
Renovation cost estimate screening
| Repair item | Severity | Est. cost |
|---|---|---|
| Exterior siding · Weathered appearance suggests potential water damage. | Moderate | $3,000–15,000 |
| Paint · Interior walls show signs of wear and may need repainting. | Moderate | $3,000–15,000 |
| Landscaping · Minimal landscaping detracts from curb appeal and could be improved with some landscaping work. | Moderate | $3,000–15,000 |
| Total estimated repair cost · 3 items | $9,000–45,000 |
Value-add ROI direction
- Both Paint interior walls — Fresh paint can improve the overall appearance and value of the home. ↑
- Both Landscaping — Improved landscaping can enhance curb appeal and attract potential buyers. ↑
- Both Roof inspection — Ensuring the roof is in good condition can prevent costly repairs and improve the home's value. ↑
- Both HVAC maintenance — A well-maintained HVAC system can improve comfort and energy efficiency, enhancing both resale and rental value. ↑
ⓘ Cost ranges are severity-bucket heuristics (US national rule-of-thumb). Get contractor quotes + a written scope before underwriting a rehab budget.
Schools (NCES district)
- District
- Osceola
- NCES district ID
- 2923270
- Math proficiency
- 46% ▲ 1.00%
- Reading proficiency
- 45% ▲ 3.00%
- Median HH income
- $30,573
- Composite
- 37.21/100
- National rank
- #4470
- State rank
- #105 of 324 in MO
Livability — Osceola
- Score
- 61/100
- State rank
- #432
- US rank
- #17848
Category grades
Schools grade is shown separately in the Schools card above.
Census & demographics
- Population (ZIP)
- 1,646
Population outlook (St. Clair County) Hauer SSP2
- Today (2025)
- 8,710 people
- By 2030
- 8,281 · -4.9%
- By 2040
- 7,481 · -14.1%
- By 2050
- 6,814 · -21.8%
- By 2075
- 5,836 · -33.0%
- By 2100
- 4,989 · -42.7%
Race, ethnicity, and origin ACS 2023
- Neighborhood character
- Predominantly White (95%)
- Race & ethnicity
- White 95% Two or more races 3% Hispanic / Latino 2% Black 1%
- Common ancestry
- Slovak 4% Iranian 2% Italian 1%
- Foreign-born
- 2%
- Languages at home
- 99% English-only · German/W. Germanic 1%
Political lean MEDSL · St. Clair
- 2024 margin
- Solid R (+60.6) · D 19.2% · R 79.8%
- 2008→2024 swing
- -38.7pp toward R · 2008: -21.9pp · 2024: -60.6pp
- All cycles
- 2024: R+60.6 2020: R+59.2 2016: R+55.4 2012: R+33.7 2008: R+21.9
Not yet ingested
- Civics
- —
Market trends
- HPI YoY
- ▲ 4.83%
- Current HPI
- 205.7999
- Rent YoY
- —
- Metro
- —
- State GDP YoY
- ▲ 1.84%
- F500 in state
- 20
Industry mix (Fortune 500 HQ in MO)
| Industry | F500 HQs | Revenue |
|---|---|---|
| Healthcare | 1 | $163B |
|
||
| Insurance | 1 | $21B |
|
||
| Industrial Technology | 1 | $17B |
|
||
| Retail | 1 | $16B |
|
||
| Industrial Distribution | 1 | $10B |
|
||
| Utilities | 1 | $9B |
|
||
Price history
-11.1% since first listed6 events — show timeline
- 2026-06-17 Sold (MLS) — SOMO
- 2026-06-05 Pending — SOMO
- 2026-05-28 Price Changed $40,000 SOMO
- 2026-05-12 Relisted — SOMO
- 2026-05-07 Pending — SOMO
- 2026-04-27 Listed $45,000 SOMO
Cash-flow waterfall
monthlySold comps — $/sqft
last 12 mo · ≤1 miLoading sold comps…